Introduction
A powerful feature that makes JavaScript unique is its ability to work asynchronously via callback functions. Assigning async callbacks let you write event-driven code but it also makes tracking down bugs a hair pulling experience since the JavaScript is not executing in a linear fashion.
Luckily, now in Chrome DevTools, you can view the full call stack of asynchronous JavaScript callbacks!
Once you enable the async call stack feature in DevTools, you will be able to
drill into the state of your web app at various points in time. Walk the full
stack trace for some event listeners, setInterval,setTimeout, XMLHttpRequest,
promises, requestAnimationFrame, MutationObservers, and more.
As you walk the stack trace, you can also analyze the value of any variable at that particular point of runtime execution. It's like a time machine for your watch expressions!
Let's enable this feature and take a look at a few of these scenarios.
Enable async debugging in Chrome
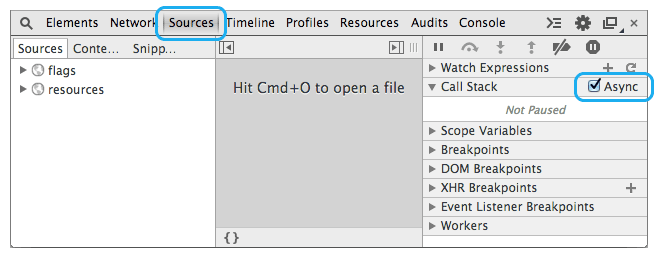
Try out this new feature by enabling it in Chrome. Go to the Sources panel of Chrome Canary DevTools.
Next to the Call Stack panel on the right hand side, there is a new checkbox for "Async". Toggle the checkbox to turn async debugging on or off. (Although once it's on, you may not ever want to turn it off.)
Capture delayed timer events and XHR responses
You've probably seen this before in Gmail:

If there is a problem sending the request (either the server is having problems or there are network connectivity issues on the client side), Gmail will automatically try re-sending the message after a short timeout.
To see how async call stacks can help us analyze delayed timer events and XHR responses, I've recreated that flow with a mock Gmail example. The full JavaScript code can be found in the link above but the flow is as follows:
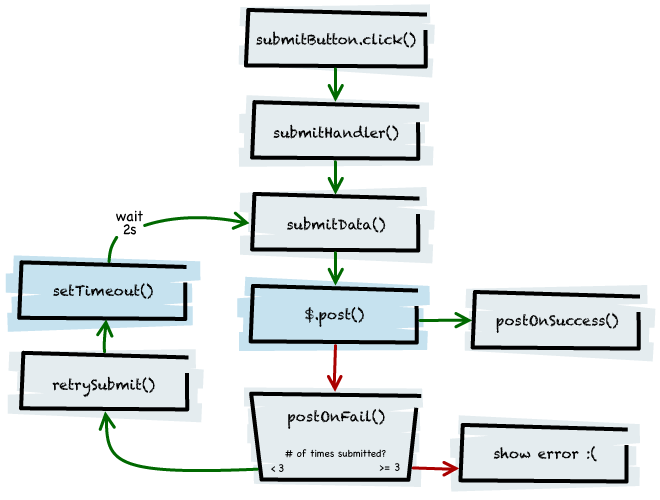
By solely looking at the Call Stack panel in previous versions of DevTools, a
breakpoint within postOnFail() would give you little information about where
postOnFail() was being called from. But look at the difference when turning on
async stacks:
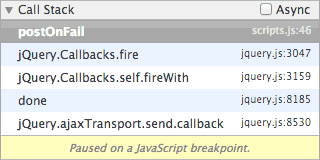
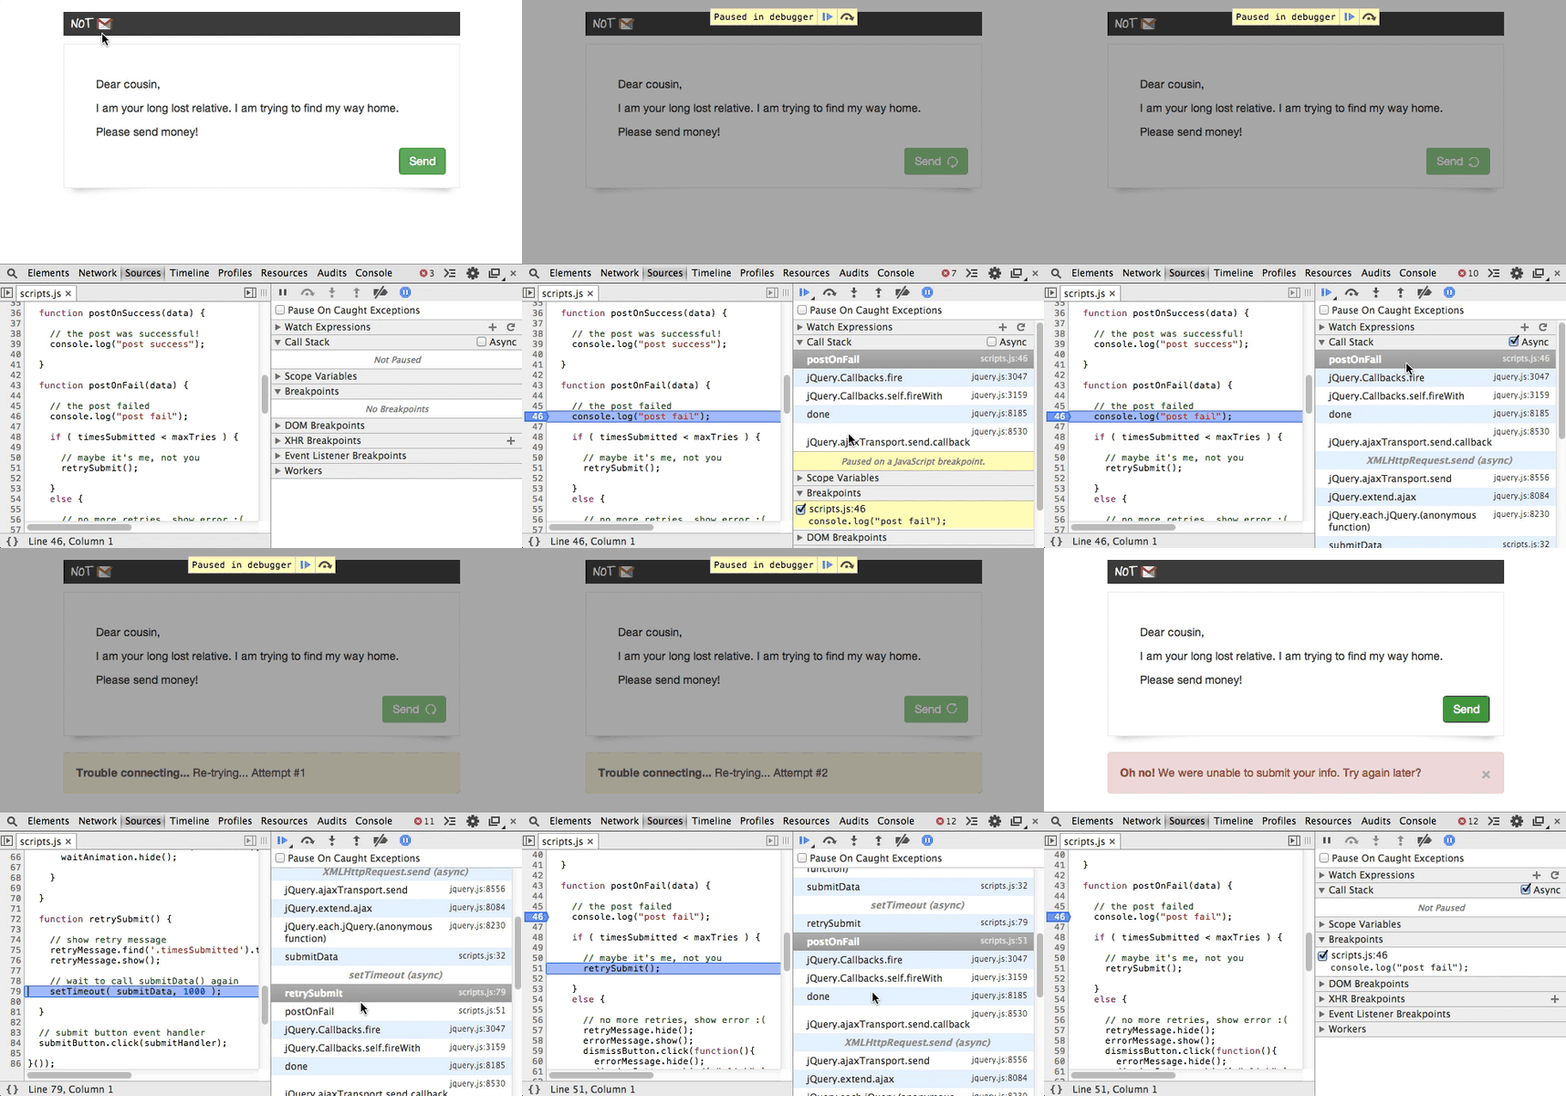
Here you can see that postOnFail() was initiated from an AJAX callback but no further info.
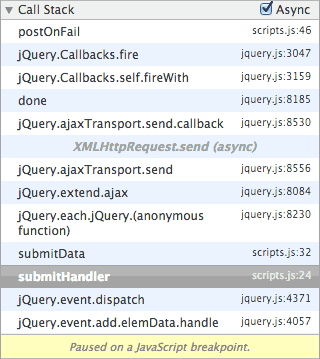
Here you can see that the XHR was initiated from submitHandler(). Nice!
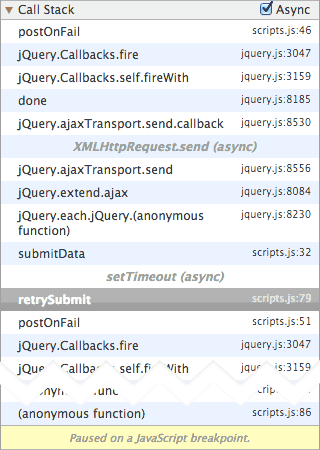
With async call stacks turned on, you can view the entire call stack to easily
see if the request was initiated from submitHandler() (which happens after clicking the submit button) or from
retrySubmit() (which happens after a setTimeout() delay):

Watch expressions asynchronously
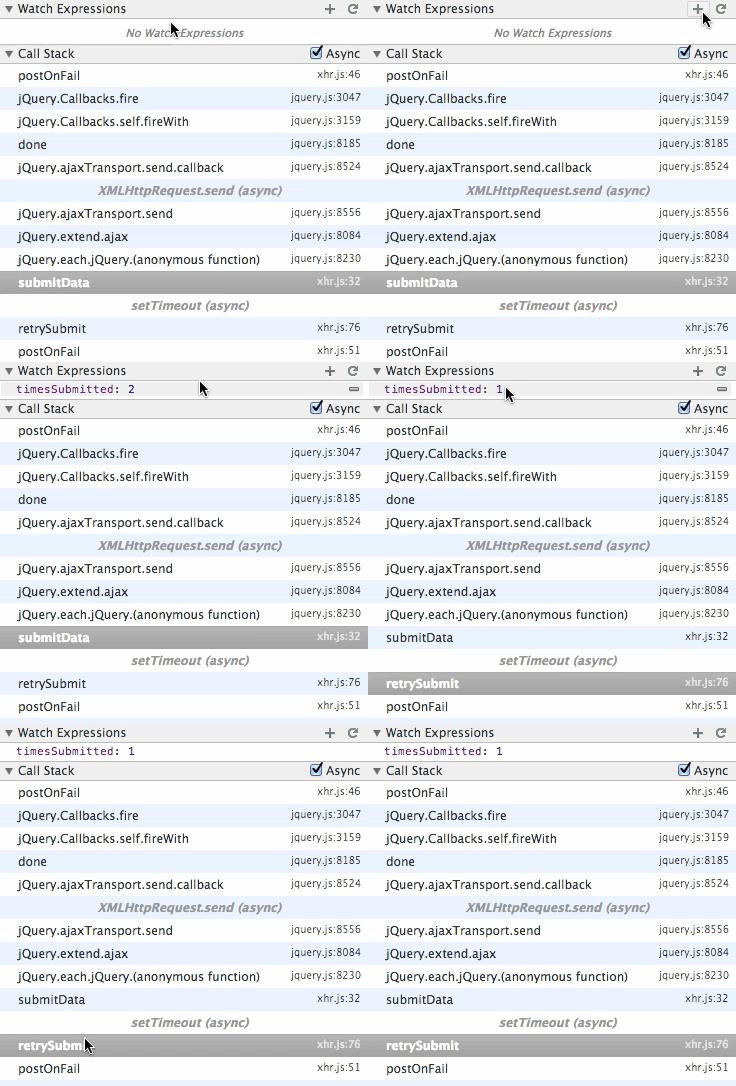
When you walk the full call stack, your watched expressions will also update to reflect the state that it was in at that time!
Evaluate code from past scopes
In addition to simply watching expressions, you can interact with your code from previous scopes right in the DevTools JavaScript console panel.
Imagine that you are Dr. Who and you need a little help comparing the clock from before you got into the Tardis to "now". From the DevTools console, you can easily evaluate, store, and do calculations on values from across different execution points.
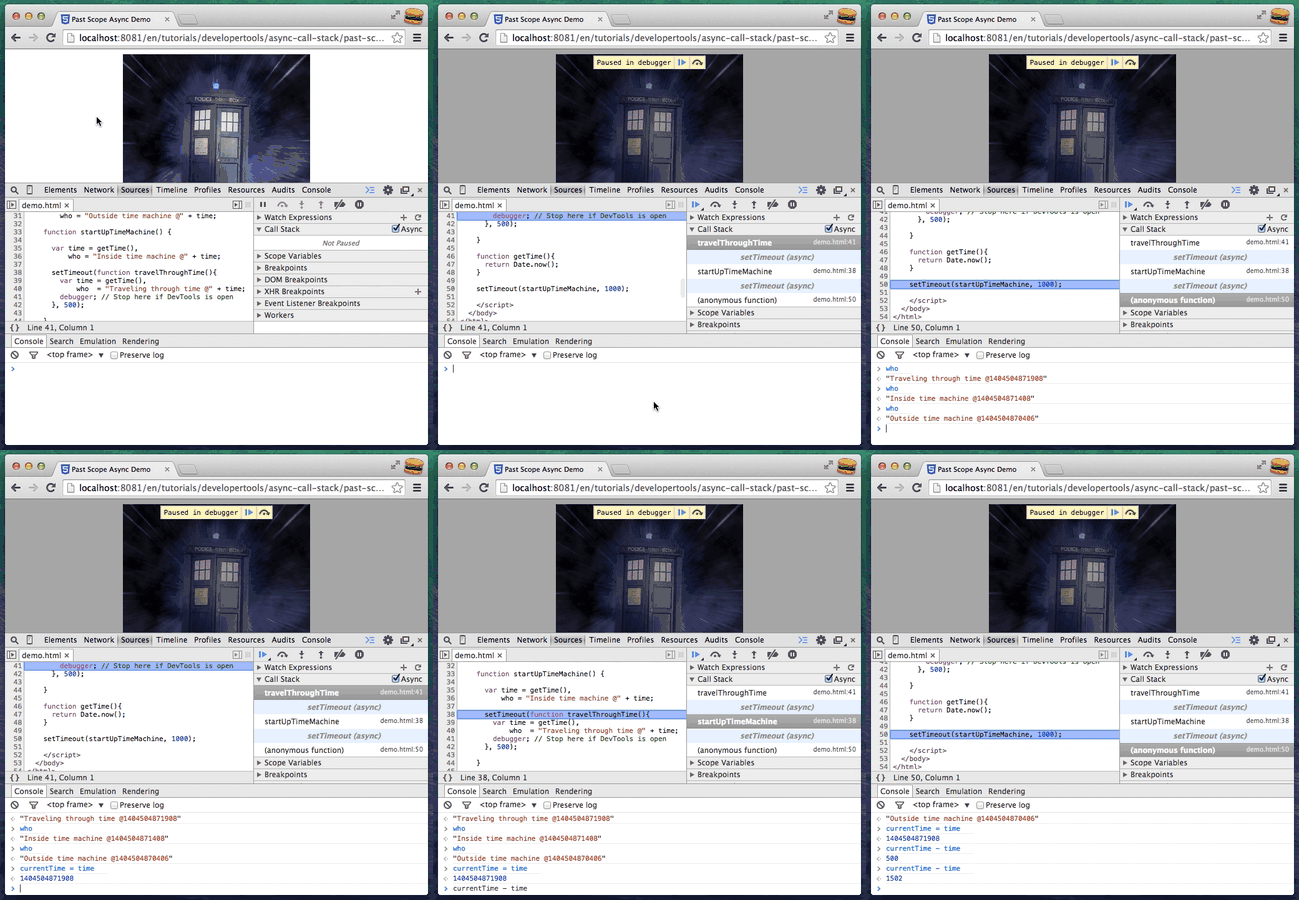
Staying within DevTools to manipulate your expressions will save you time from having to switch back to your source code, make edits, and refresh the browser.
Unravel chained promise resolutions
If you thought the previous mock Gmail flow was hard to unravel without the async call stack feature enabled, can you imagine how much harder it would be with more complex asynchronous flows like chained promises? Let's revisit the final example of Jake Archibald's tutorial on JavaScript Promises.
Here's a little animation of walking the call stacks in Jake's async-best-example.html example.
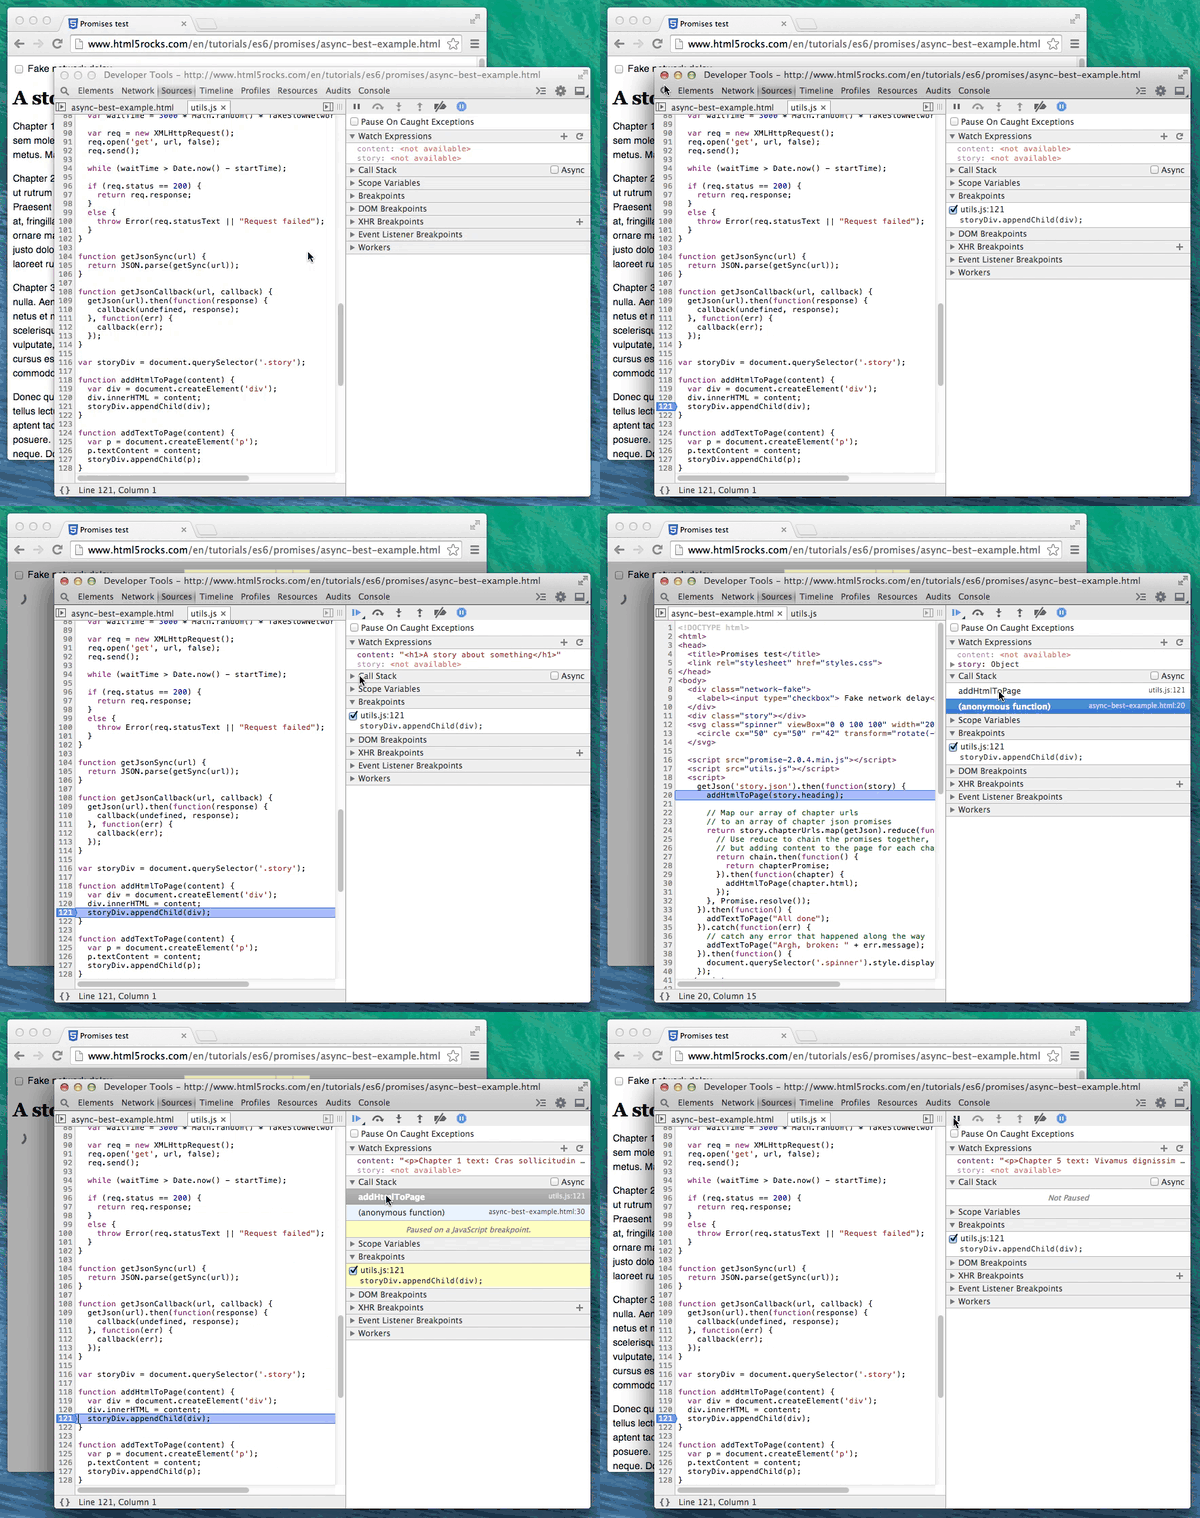
Notice how the Call Stack panel is pretty short on info when trying to debug promises.
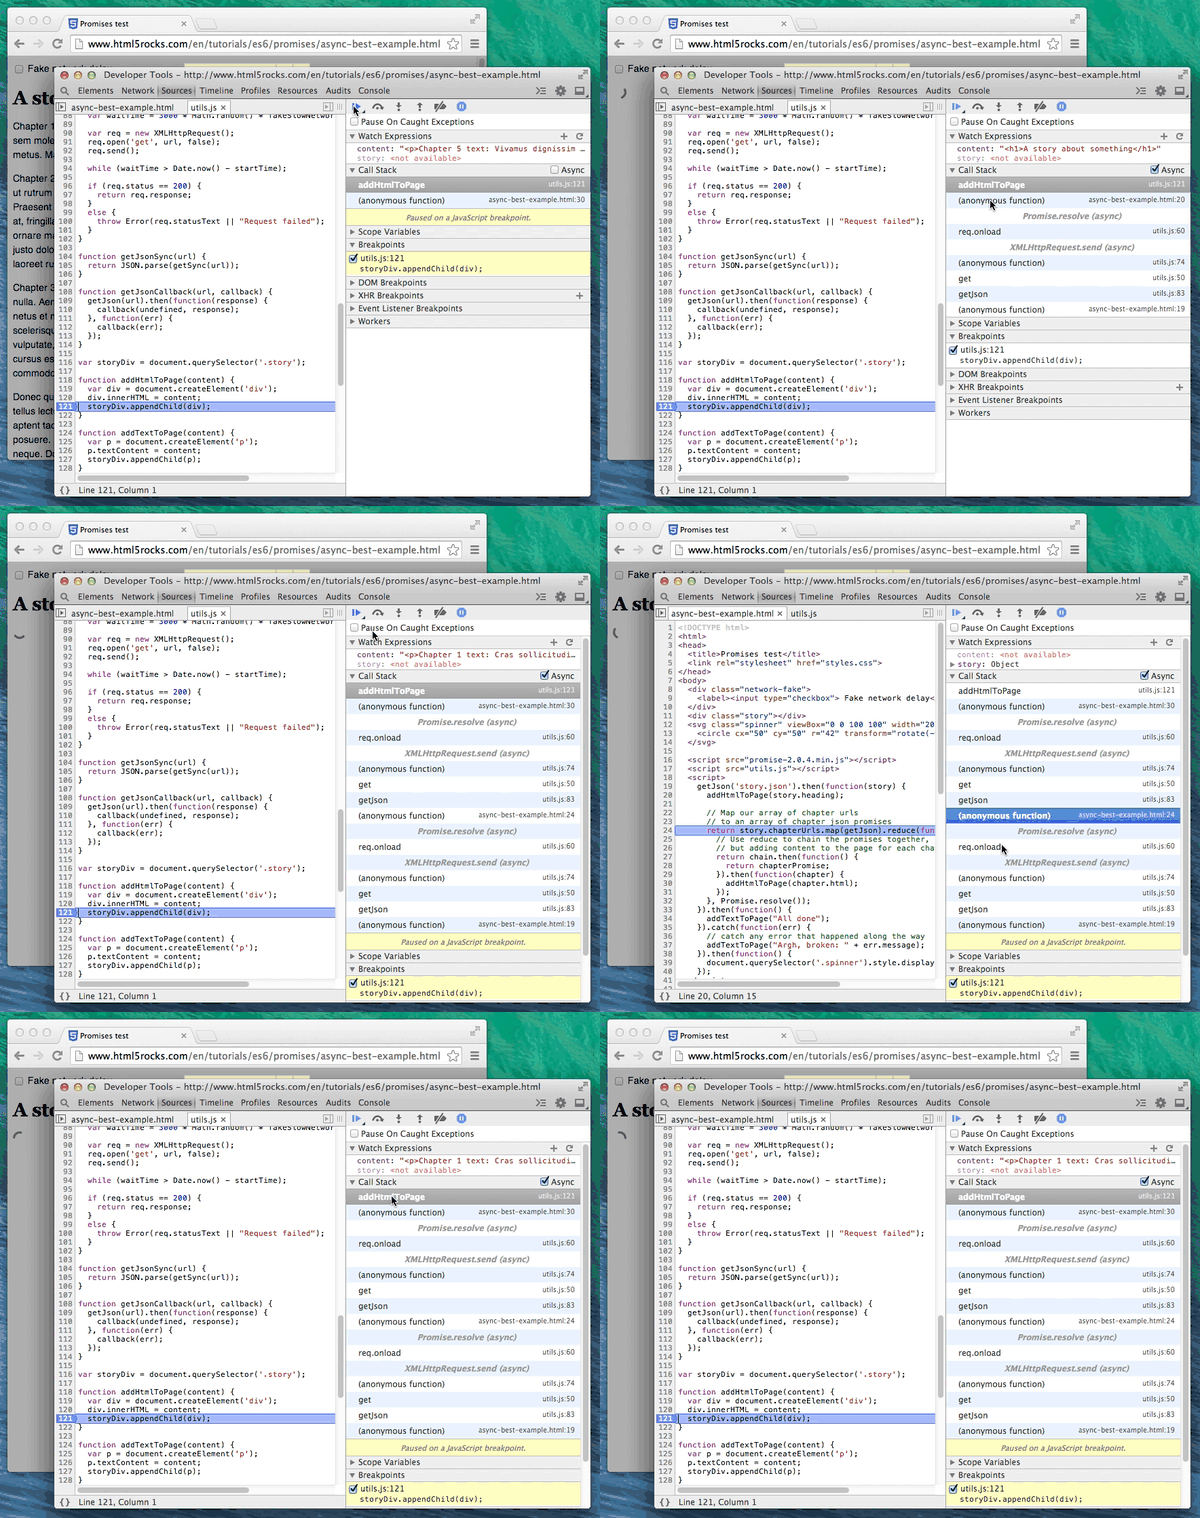
Wow! Such promises. Much callbacks.
Get insights into your web animations
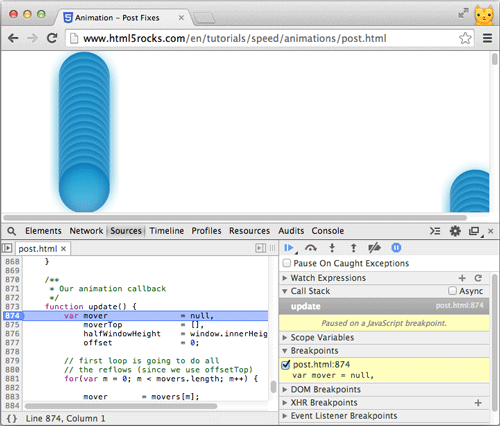
Let's go deeper into the HTML5Rocks archives. Remember Paul Lewis' Leaner, Meaner, Faster Animations with requestAnimationFrame?
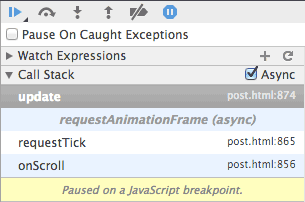
Open up the requestAnimationFrame demo and add a breakpoint at the beginning of the update() method (around line 874) of post.html. With async call stacks we get a lot more insights into requestAnimationFrame, including the ability to walk all the way back to the initiating scroll event callback.
Track down DOM updates when using MutationObserver
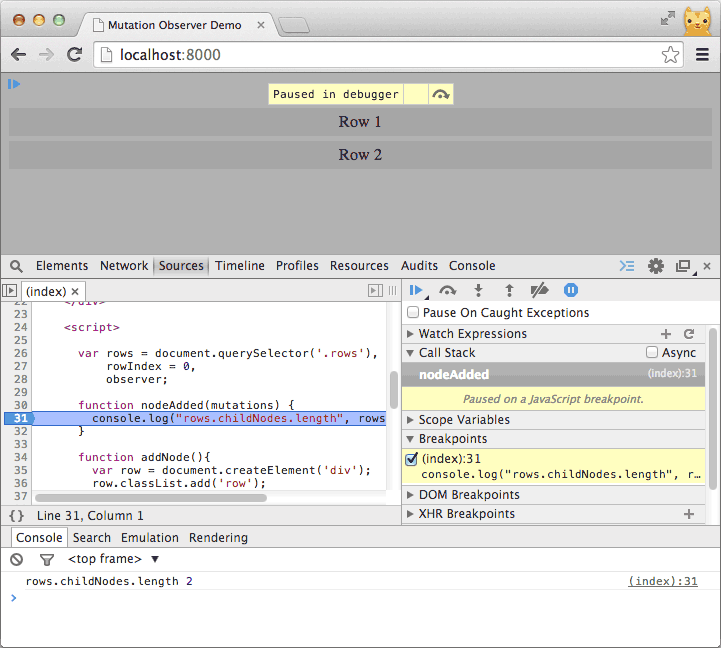
MutationObserver allow us to observe changes in the DOM. In this simple example,
when you click on the button, a new DOM node is appended to <div class="rows"></div>.
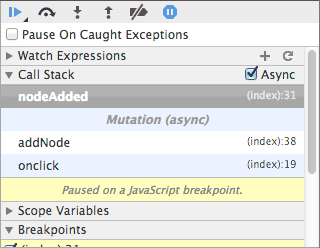
Add a breakpoint within nodeAdded() (line 31) in demo.html. With async call
stacks enabled, you can now walk the call stack back through addNode() to the
initial click event.
Tips for debugging JavaScript in async call stacks
Name your functions
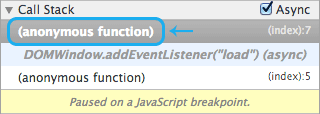
If you tend to assign all of your callbacks as anonymous functions, you may wish to instead give them a name to make viewing the call stack easier.
For example, take an anonymous function like this:
window.addEventListener('load', function() {
  // do something
});
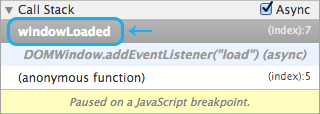
And give it a name like windowLoaded():
window.addEventListener('load', function <strong>windowLoaded</strong>(){
  // do something
});
When the load event fires, it will show up in the DevTools stack trace with its function name instead of the cryptic "(anonymous function)". This makes it much easier to see at a glance what's happening in your stack trace.
Explore further
To recap, these are all the asynchronous callbacks in which DevTools will display the full call stack:
- Timers:
Walk back to where
setTimeout()orsetInterval()was initialized. - XHRs:
Walk back to where
xhr.send()was called. - Animation frames:
Walk back to where
requestAnimationFramewas called. - Promises: Walk back to where a promise has been resolved.
- Object.observe: Walk back to where the observer callback was originally bound.
- MutationObservers: Walk back to where the mutation observer event was fired.
- window.postMessage(): Walk over intra-process messaging calls.
- DataTransferItem.getAsString()
- FileSystem API
- IndexedDB
- WebSQL
- Eligible DOM events via
addEventListener(): Walk back to where the event was fired. Due to performance reasons, not all DOM events are eligible for the async call stacks feature. Examples of currently available events include: 'scroll', 'hashchange', and 'selectionchange'. - Multimedia events via
addEventListener(): Walk back to where the event was fired. Available multimedia events include: audio and video events (e.g. 'play', 'pause', 'ratechange'), WebRTC MediaStreamTrackList events (e.g. 'addtrack', 'removetrack'), and MediaSource events (e.g. 'sourceopen').
Being able to see the full stack trace of your JavaScript callbacks should keep those hairs on your head. This feature in DevTools will be especially helpful when multiple async events happen in relation to each other, or if an uncaught exception is thrown from within an async callback.
Give it a try in Chrome. If you have feedback on this new feature, drop us a line on the Chrome DevTools bug tracker or in the Chrome DevTools Group.
