

Published: Sep 9, 2025
We're planning on deprecating the CrUX Dashboard after the end of November 2025. CrUX Vis is a newer tool that visualizes historical CrUX data that has many advantages over the older CrUX Dashboard.
Why we're deprecating the CrUX Dashboard
The CrUX Dashboard is a Looker Studio-based dashboard created and maintained by the Chrome team to provide a summary of a site's monthly Chrome User Experience Report (CrUX) data.
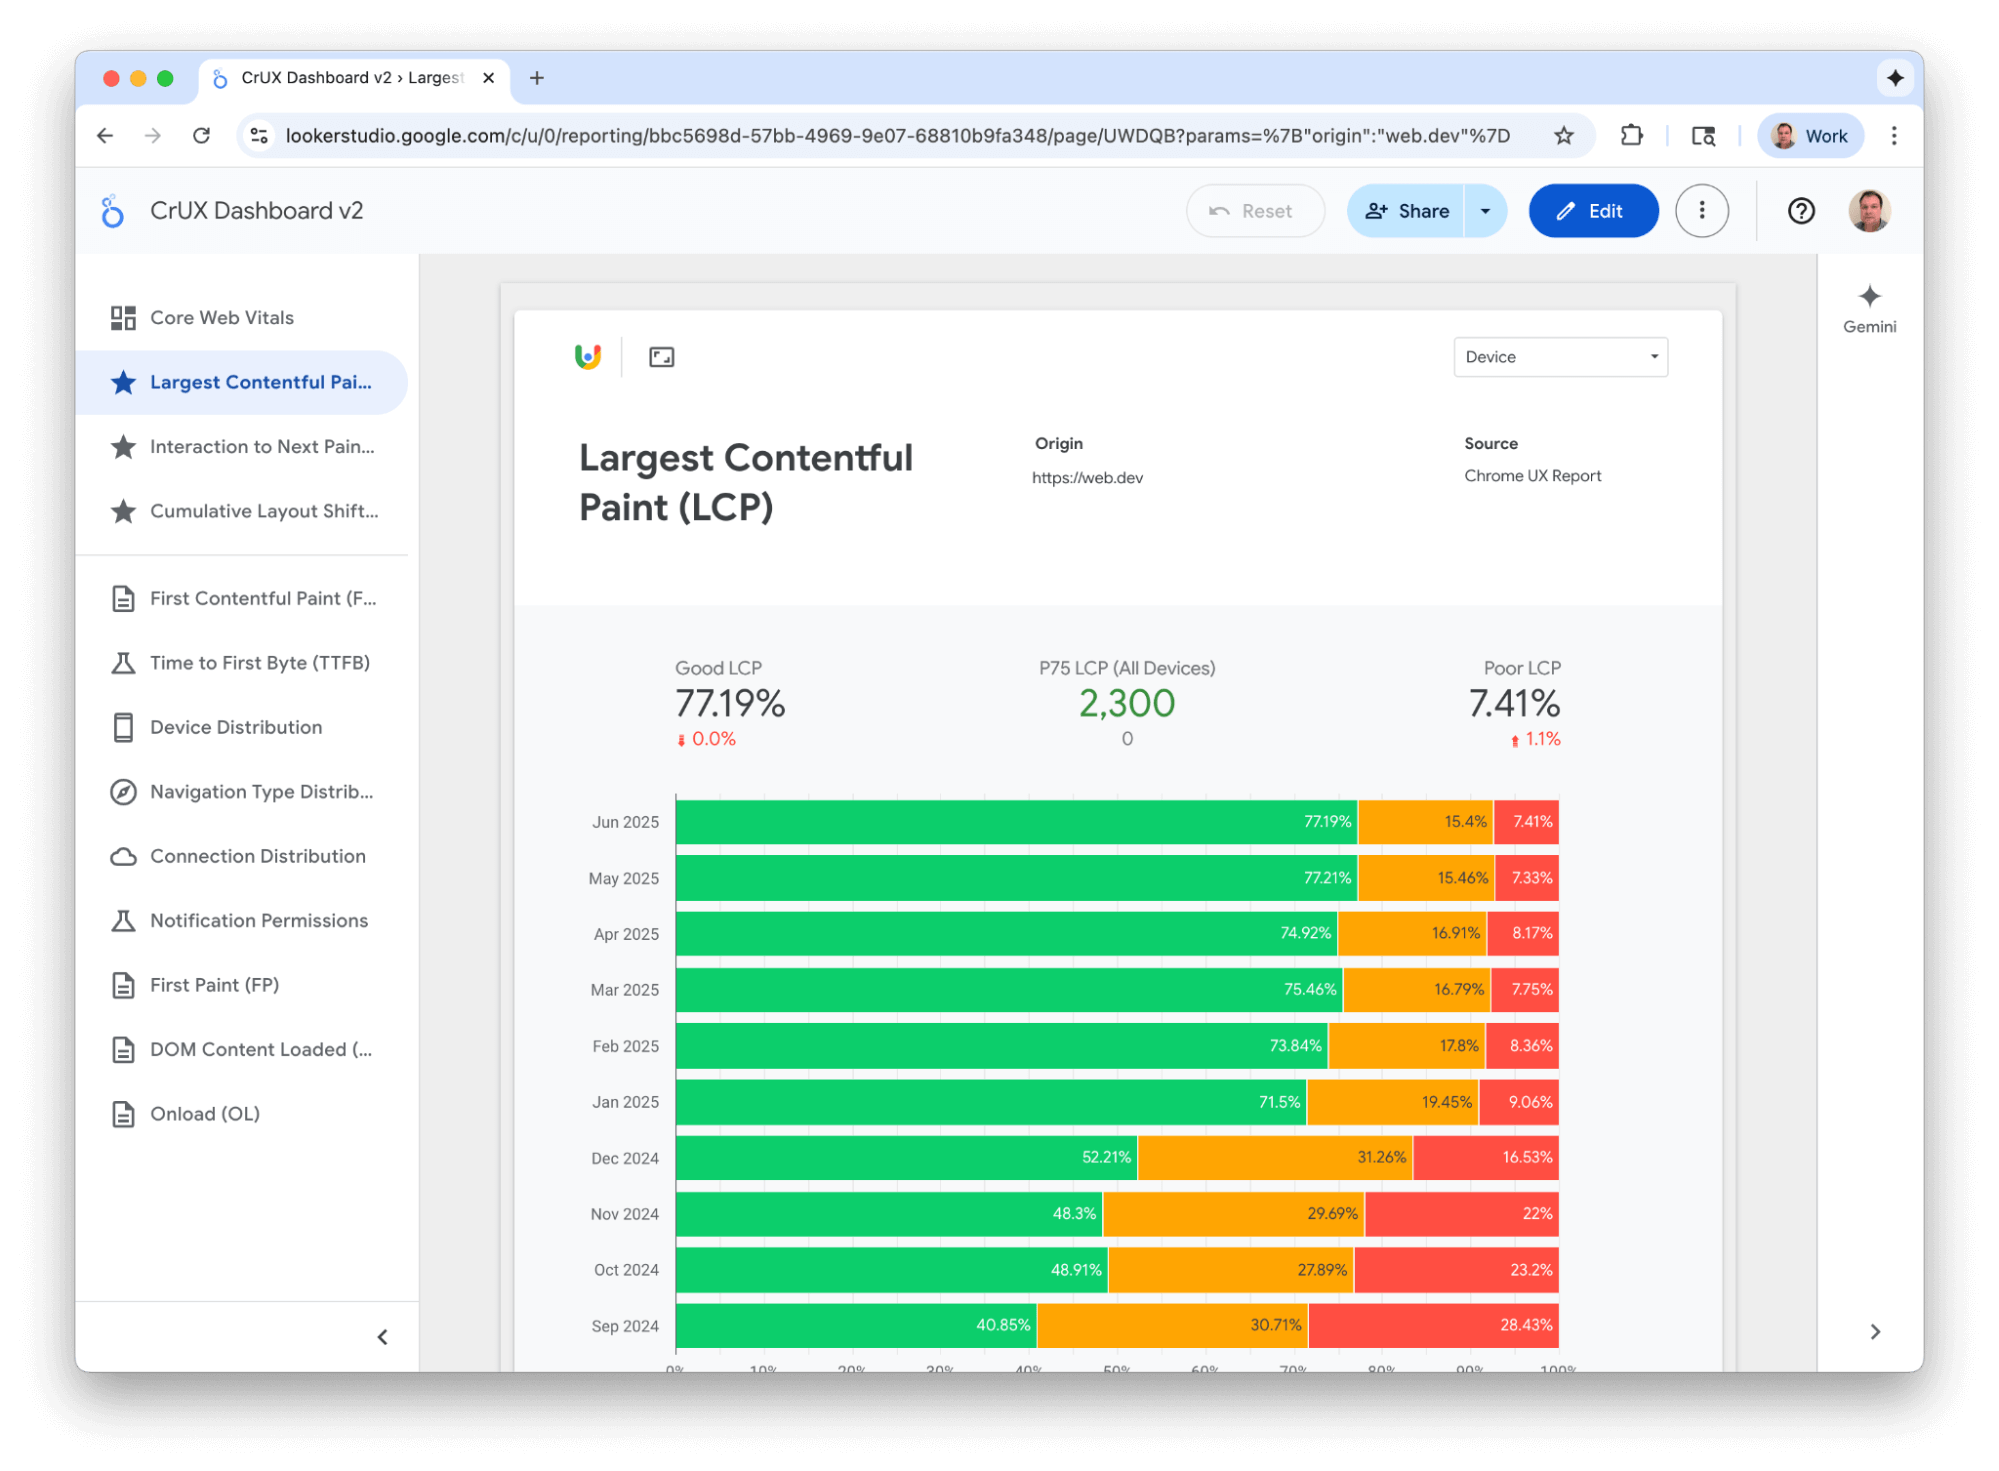
With the launch of the Core Web Vitals initiative in 2020, interest in CrUX exploded! Usage of tools that provided easy access to Core Web Vitals data for popular sites also dramatically increased. Unfortunately the CrUX Dashboard has struggled to meet this demand and has suffered frequent outages, particularly on the second Tuesday of the month when we release the new monthly data.
Ultimately we decided some time ago that the CrUX Dashboard—while a good example of how useful the CrUX data can be—was not built on the right technology for wide-scale use and started working on alternatives.
The CrUX History API and CrUX Vis
In 2023 we released the CrUX History API which provided access to recent historical CrUX data but in a real-time API, that was quicker and more scalable than the Looker Studio and BigQuery solution that the CrUX Dashboard was built on.
The History API included weekly data, rather than monthly data, to allow a more frequent update and monitoring of historical trends. We included 25 weeks months of history initially and then expanded it to 40 weeks to match the CrUX Dashboard. We still populate and maintain the CrUX BigQuery dataset for longer term analysis, where speed is not a priority.
With the History API in place, we started seeing more and more third-party tools adopting this for real-time dashboards—much more so than they had the BigQuery dataset.
In 2024 we introduced CrUX Vis as our own, first-party web application built on top of the CrUX History API:
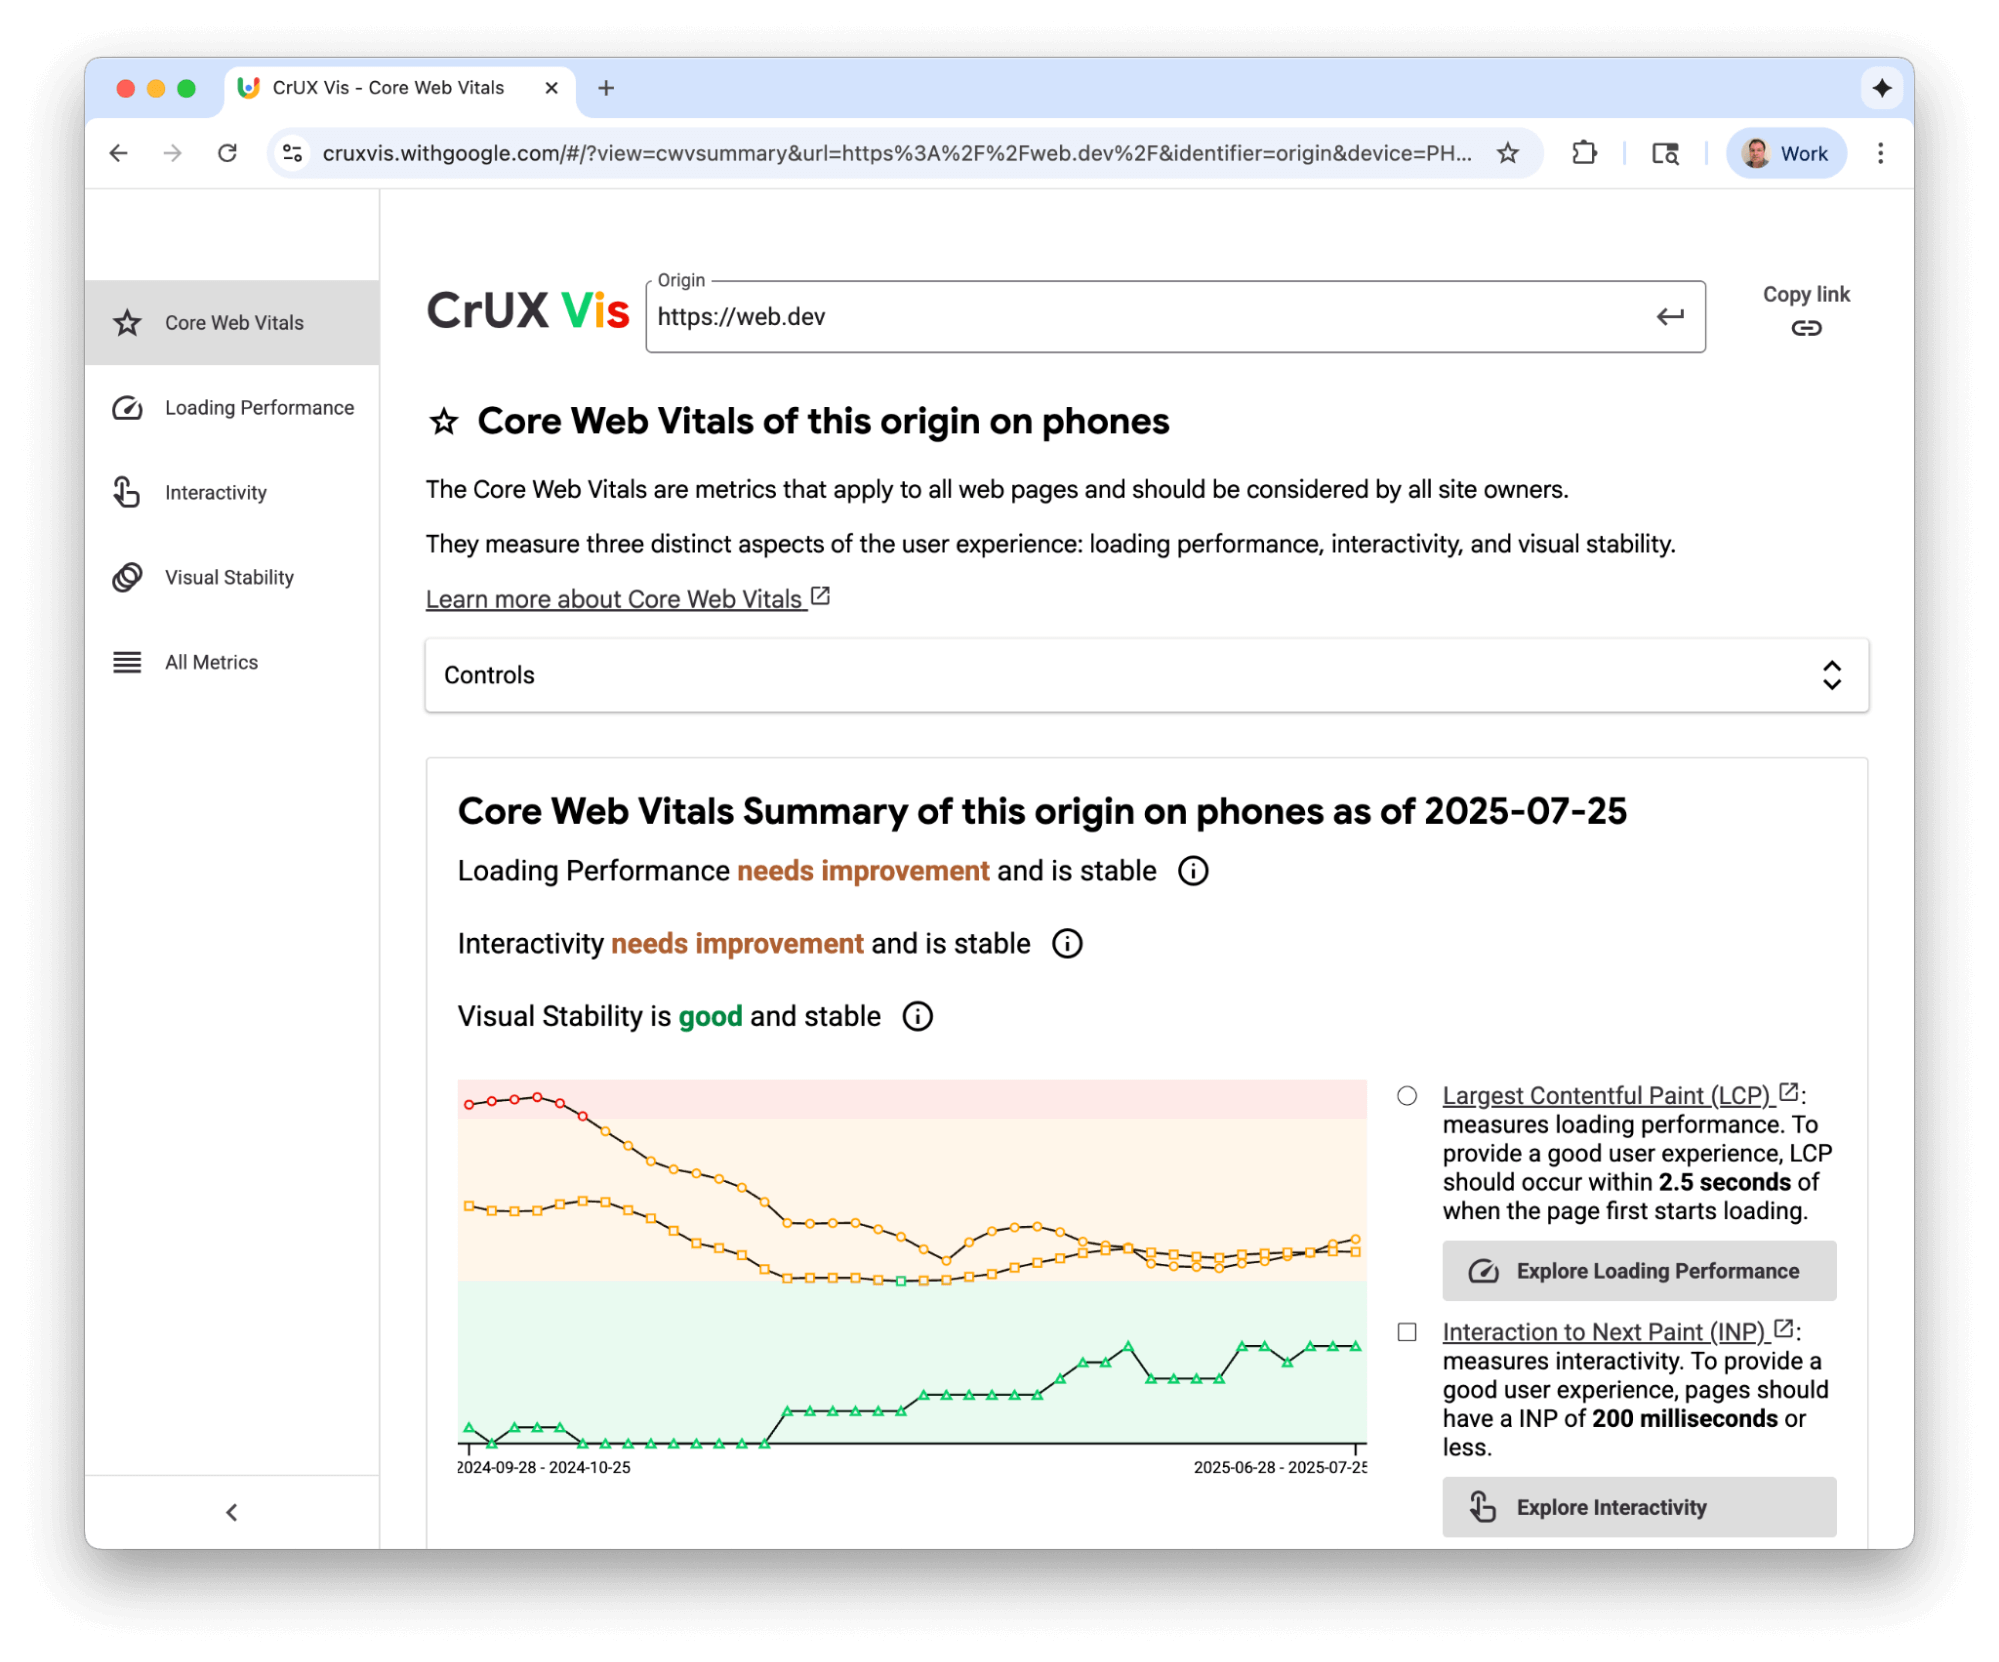
This provided much of the same functionality as the CrUX Dashboard in a more scalable fashion and with quicker load times.
There are some differences in that it has weekly data rather than monthly and so it presents data using line charts, rather than the stacked bar charts, but broadly they are tools with the same purpose in mind—seeing changes in a site's key user-experience metrics over time.
Since its launch we've seen CrUX Vis being adopted more and more and it now gets 4-5 times as many users as the CrUX dashboard, which is getting less and less usage as time goes on.
What the CrUX Dashboard deprecation means for you
We plan to turn off the CrUX Connector that provides access to the BigQuery data after the end of November 2025. At this point any dashboards dependent on this connector will stop to load data.
I want to continue using the CrUX Dashboard
It is possible to keep using the CrUX Dashboard should you want, but you will need to connect directly to Google BigQuery (using your own credentials) as the connector will no longer be available.
To switch away from the CrUX connector, to allow the CrUX Dashboard to continue to be used under your own BigQuery credentials, use the following steps:
- Setup a BigQuery project:
- Ensure you have a Google Cloud account setup.
- Click Select a project and then New Project. This takes you to a New Project page.
- Give your project a name and then click the Create button.
- Optionally setup billing. BigQuery offers a free tier including the first 1 TB of usage and each usage of the dashboard uses approximately 13 GB, meaning you get 80 loads of a Dashboard included in that free tier each month. Note that once billing is set up, you will be billed for all use. See comments below regarding sharing access.
Setup a BigQuery data source:
- Open the Data Sources Panel of Data Studio.
- Hit Create and choose Data Source
- Select BigQuery
- Edit the name at the top to something like "CrUX Dashboard data source"
- Choose CUSTOM QUERY
- Enter your billing project (where it shows
your-billing-projectin below screenshot) - Add the following SQL:
SELECT
  * EXCEPT (date, yyyymm)
FROM
  `chrome-ux-report.materialized.device_summary`
WHERE
  origin = COALESCE(NULLIF(@origin, ''), 'developer.chrome.com') OR
  origin = 'https://' || COALESCE(NULLIF(@origin, ''), 'developer.chrome.com')
ORDER BY
  date DESC
LIMIT 40
(feel free to change the default origin from
developer.chrome.comin both places)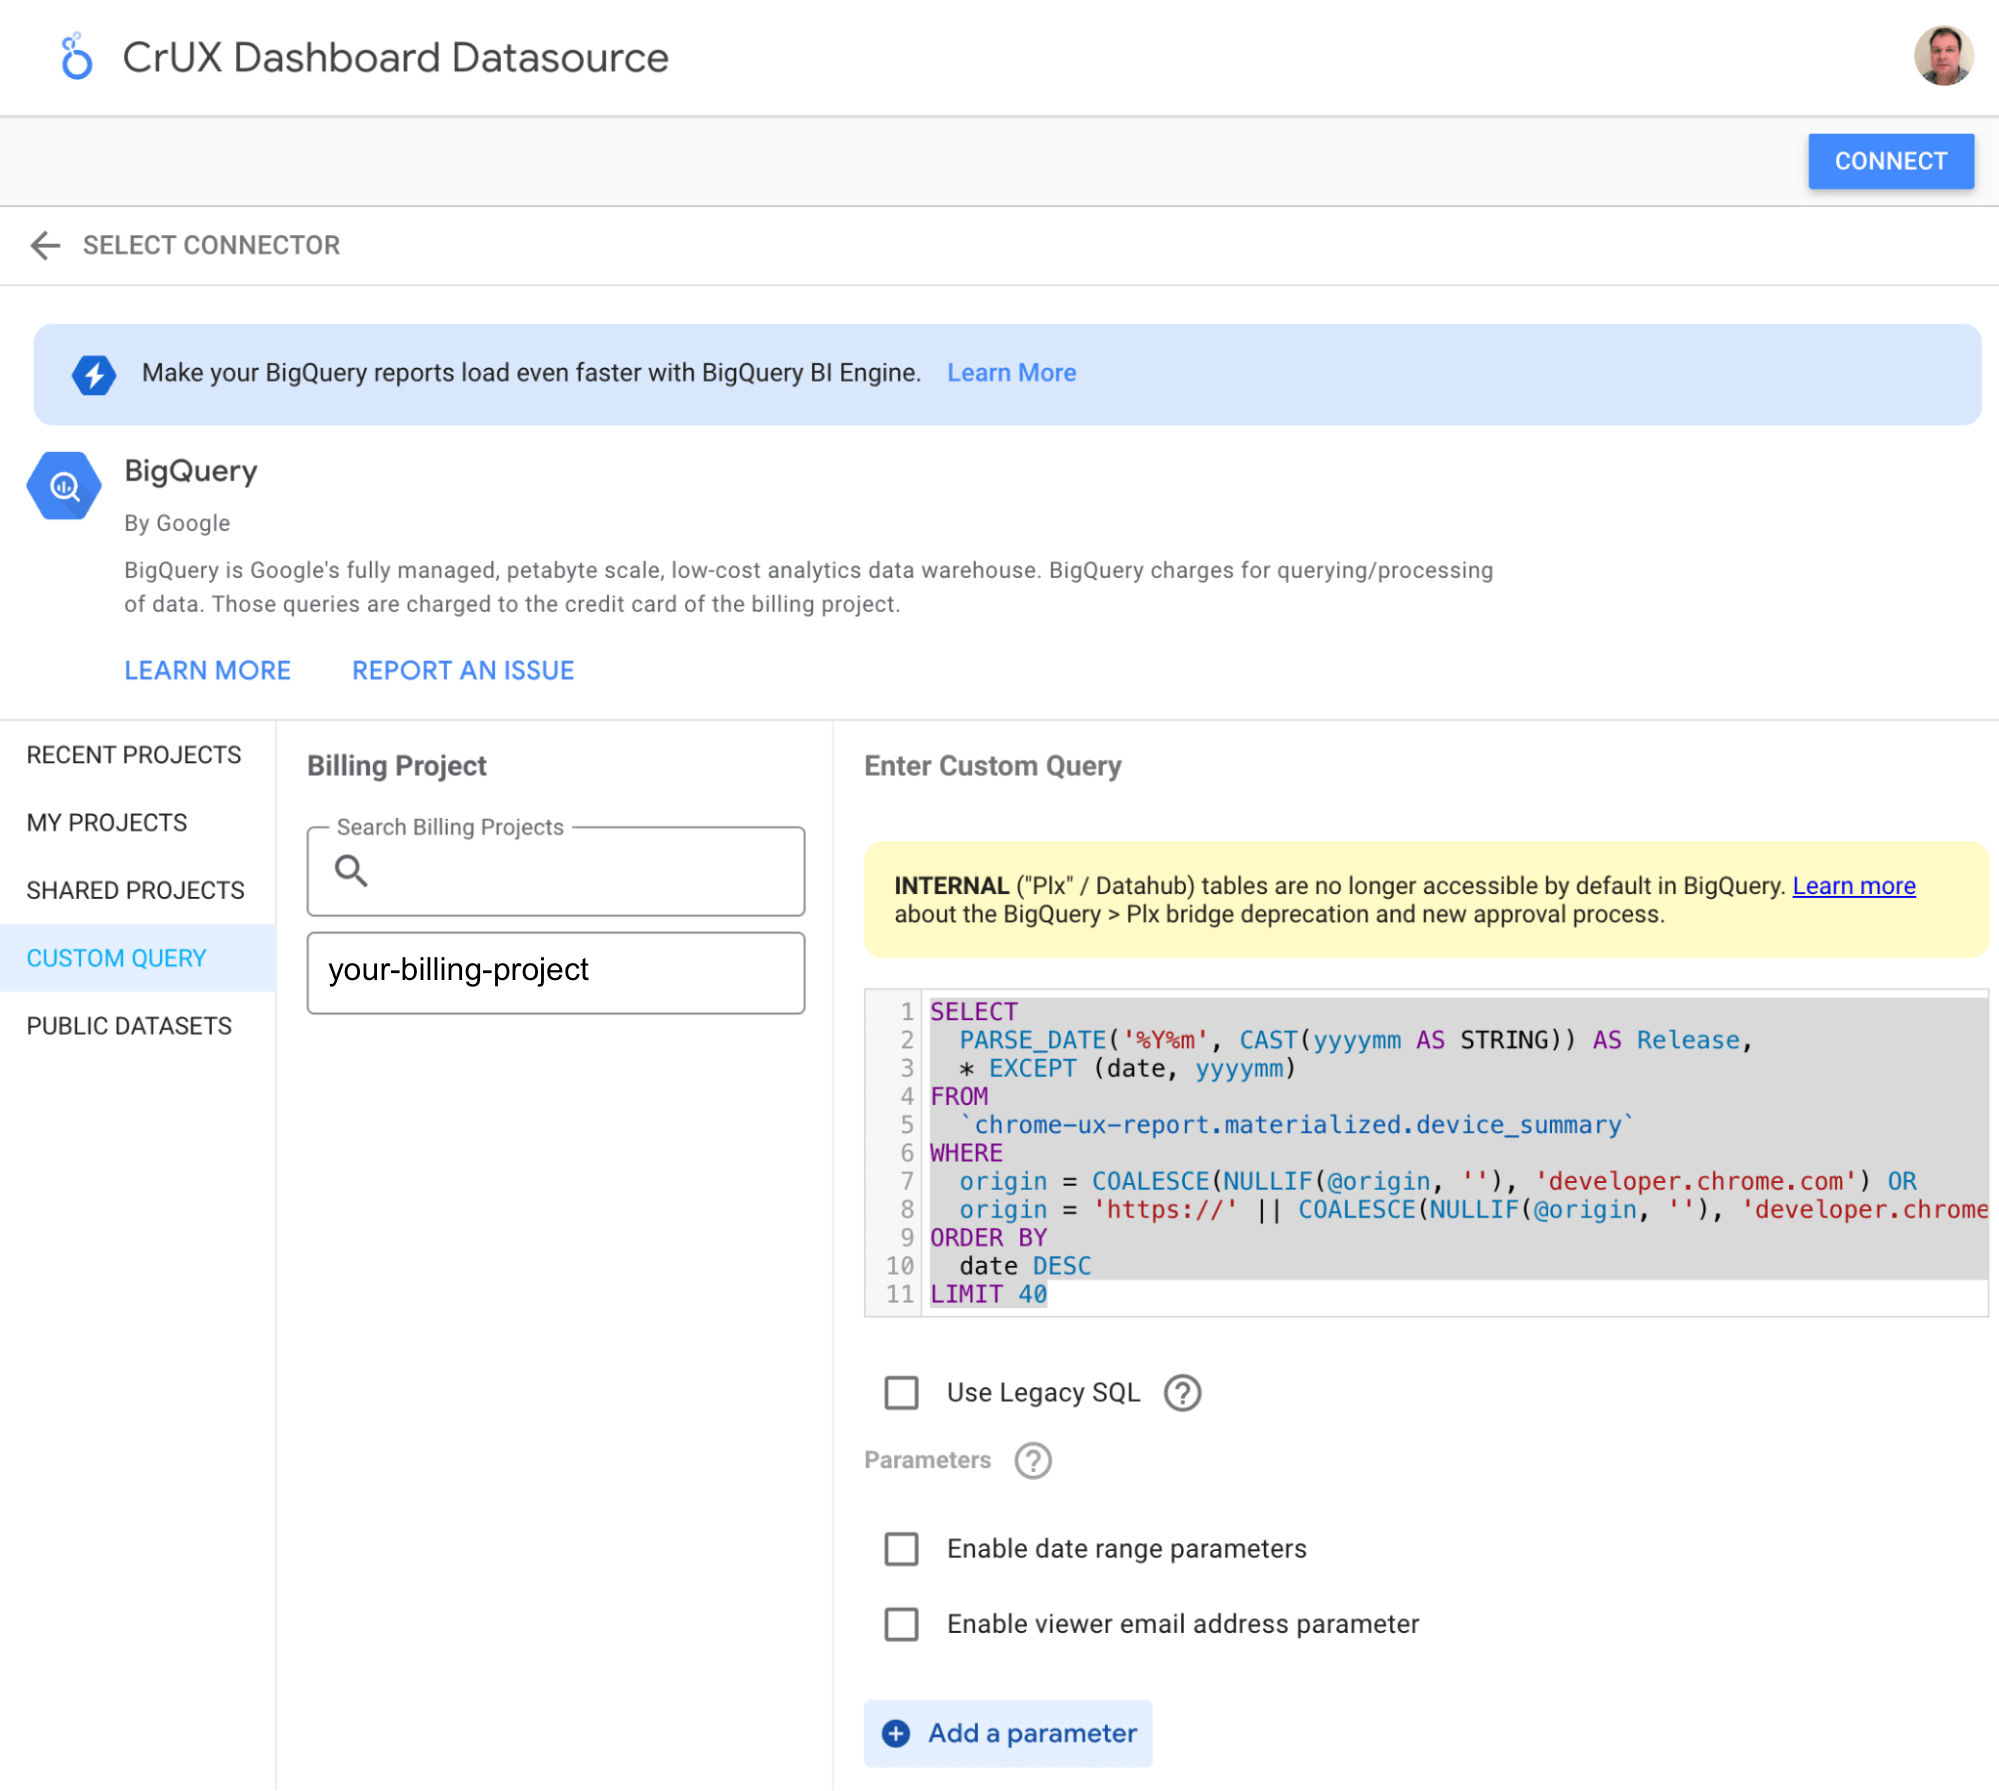
Lookerstudio custom query data connection - Add a parameter and enter the following details:
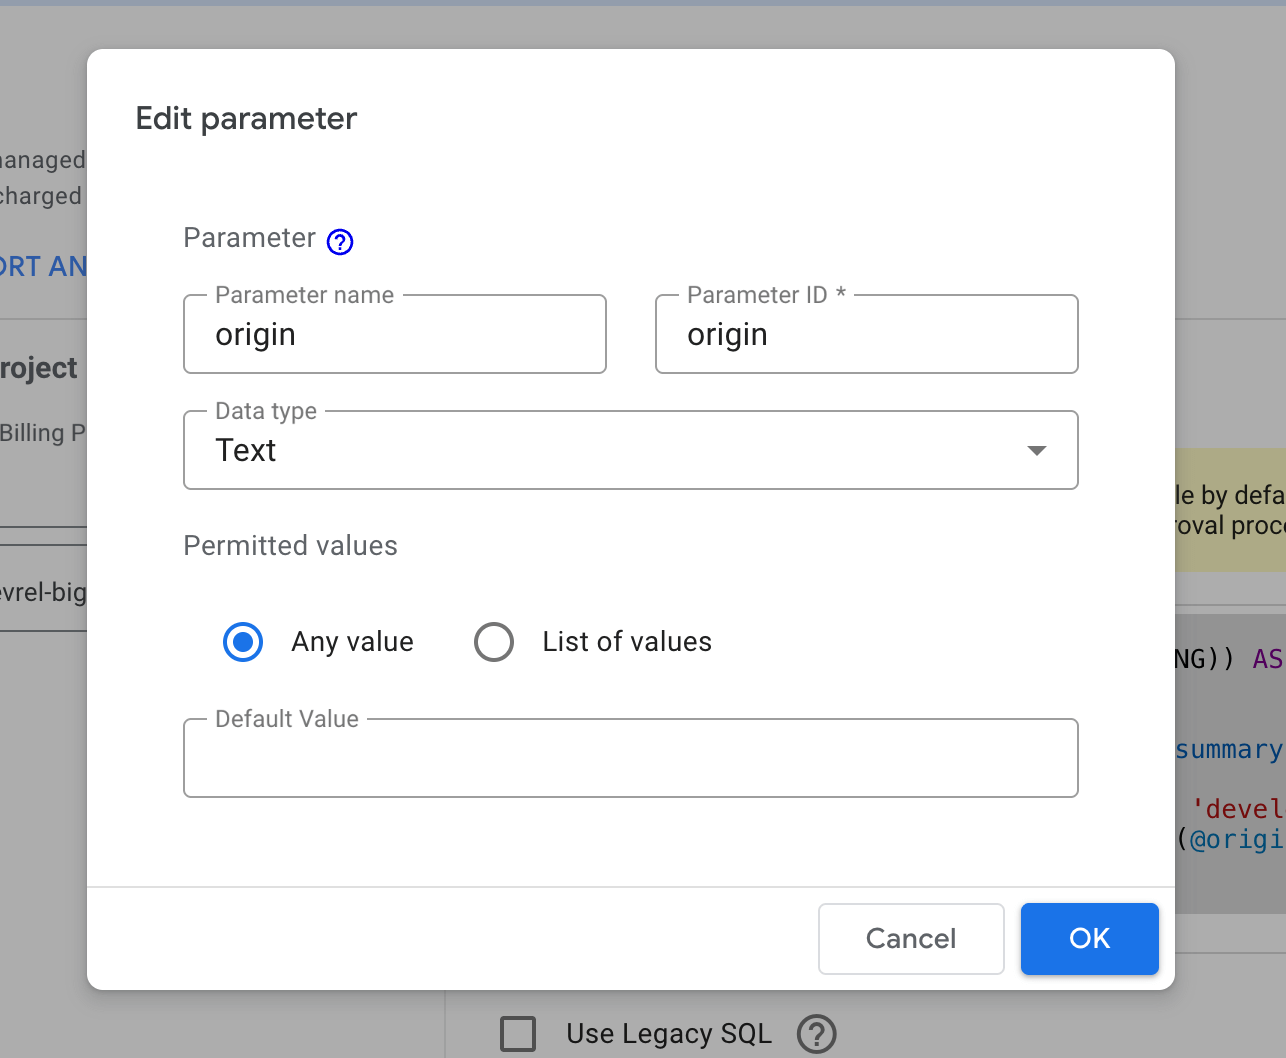
Edit parameter screen - Click Connect
- On the next screen change all Number types to Numeric->Percent except for the p75_ fields, the rank field, and the Record Count field.
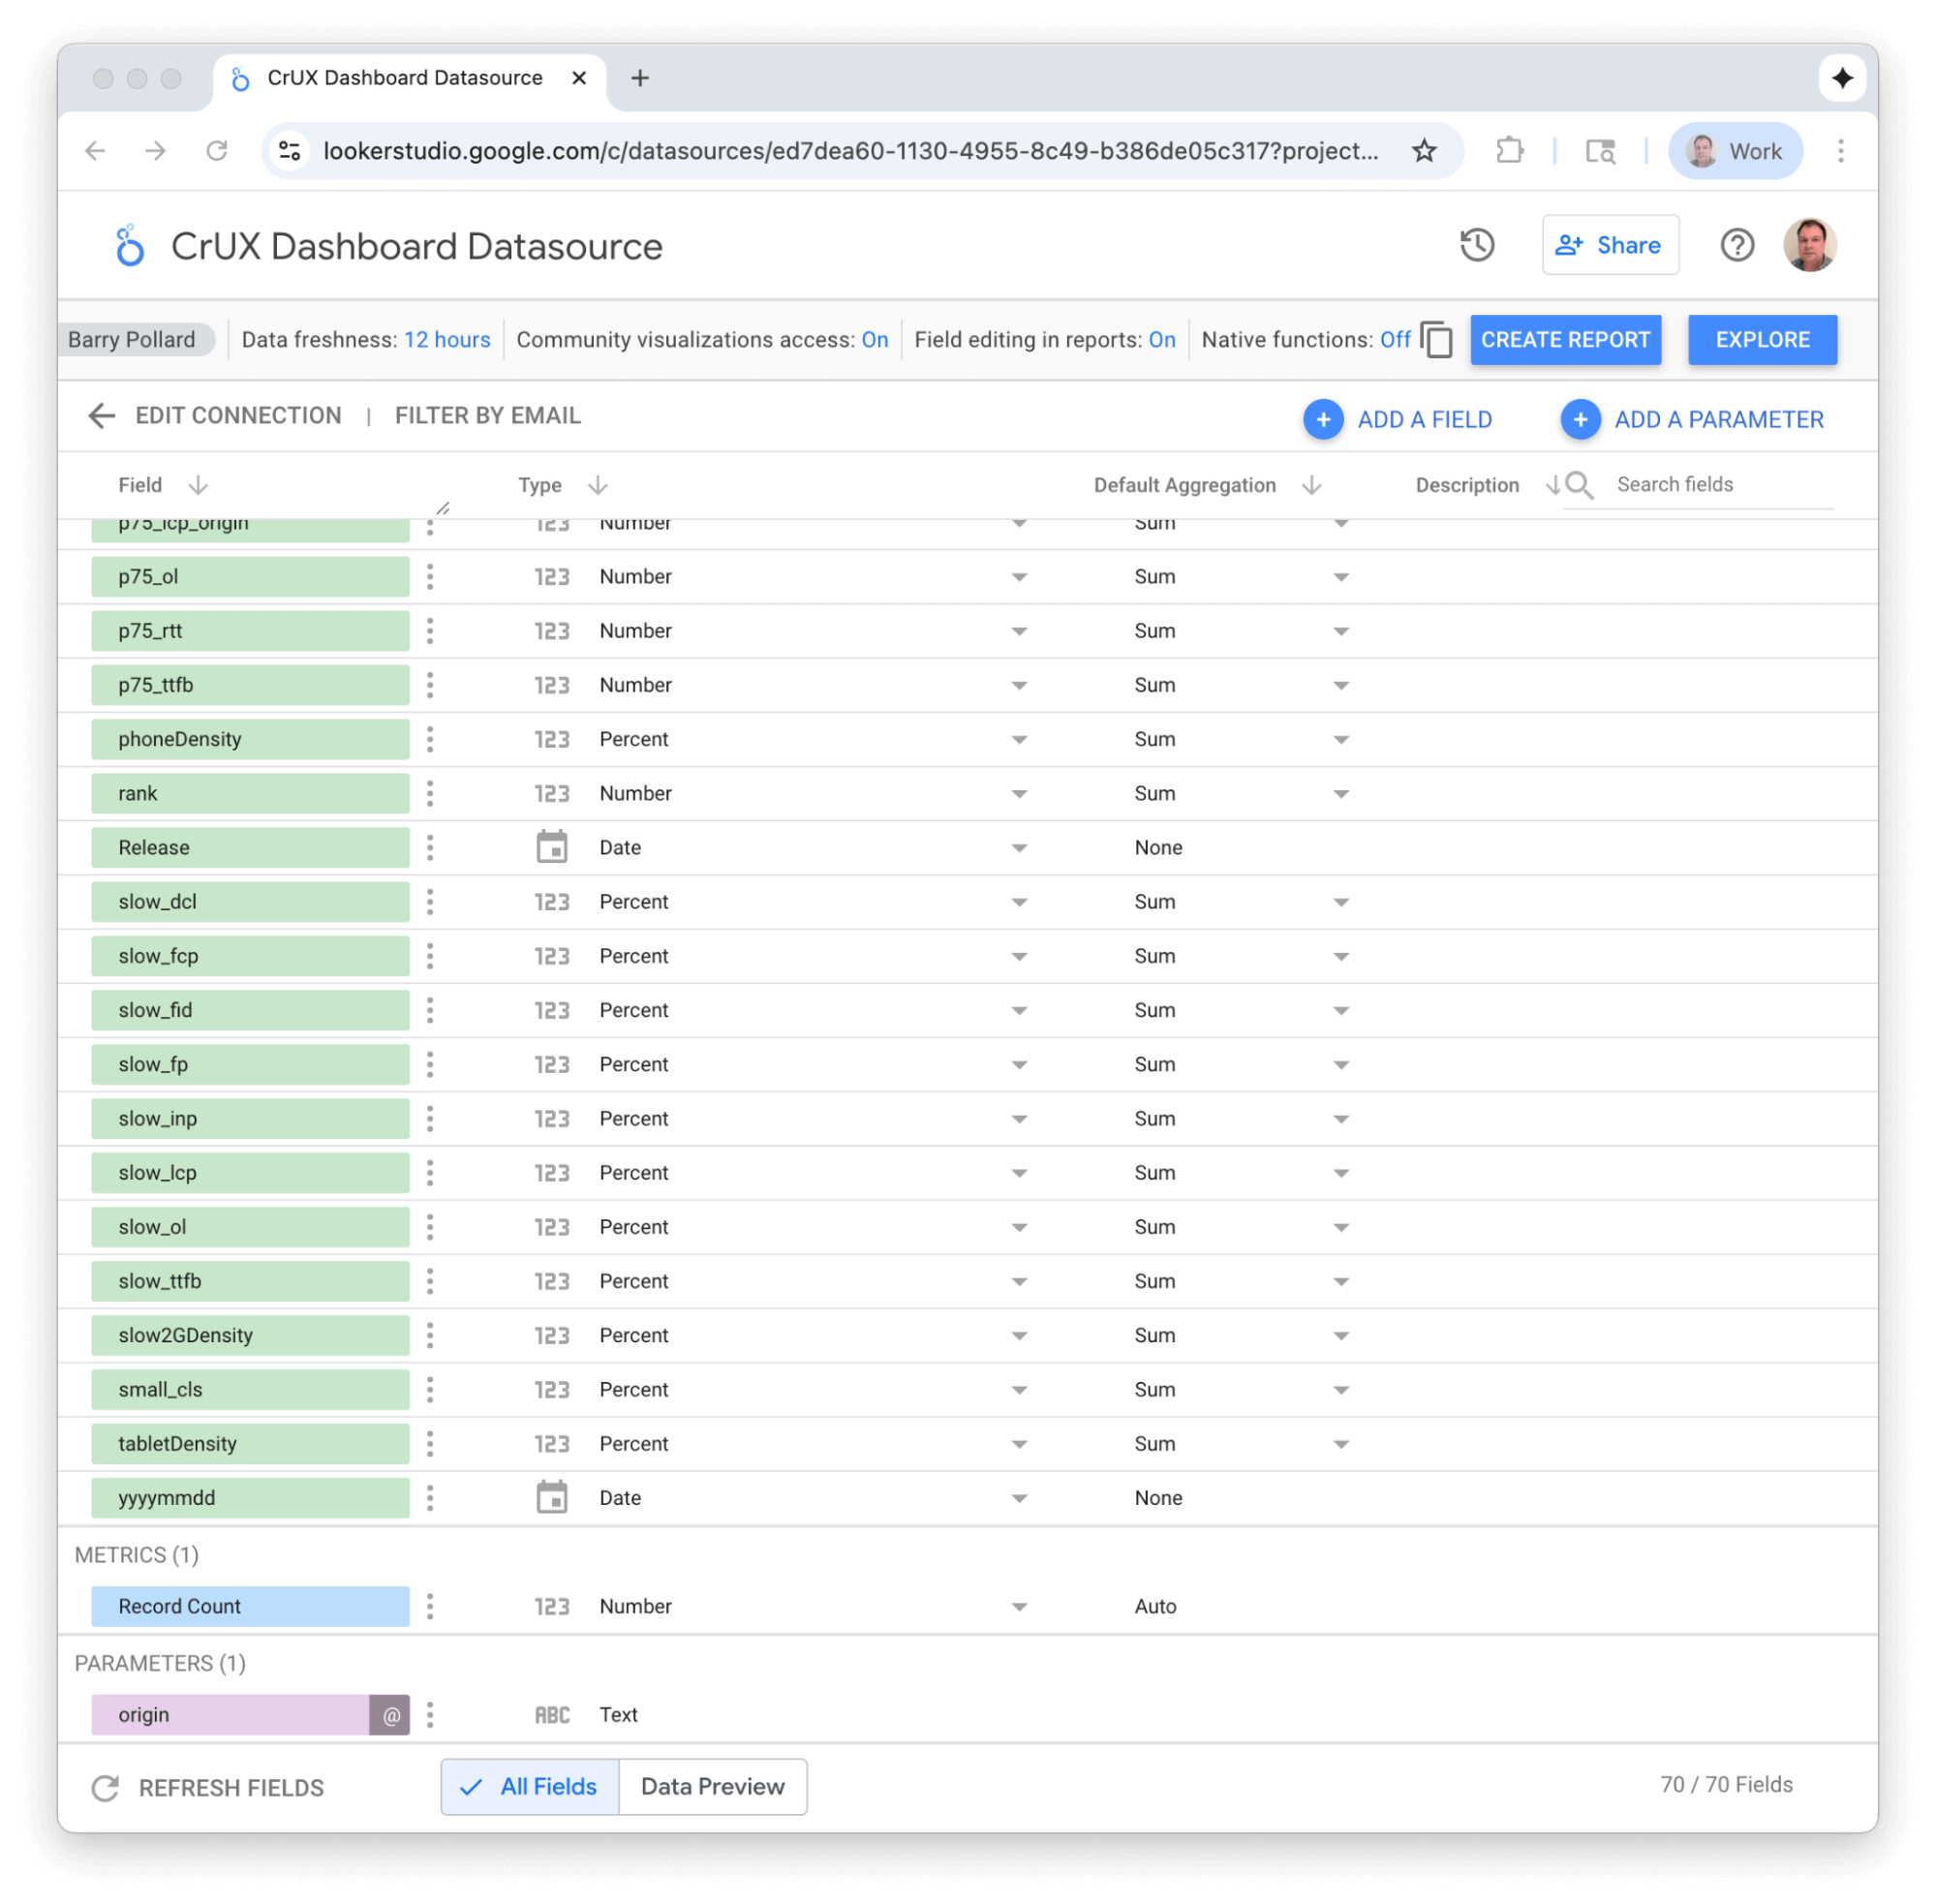
Data source fields - The changes will automatically be saved.
Switch over the Chrome Dashboard.
- Make sure you're using the latest CrUX Dashboard then make a copy of the dashboard using the three dots menu in the top right hand corner:
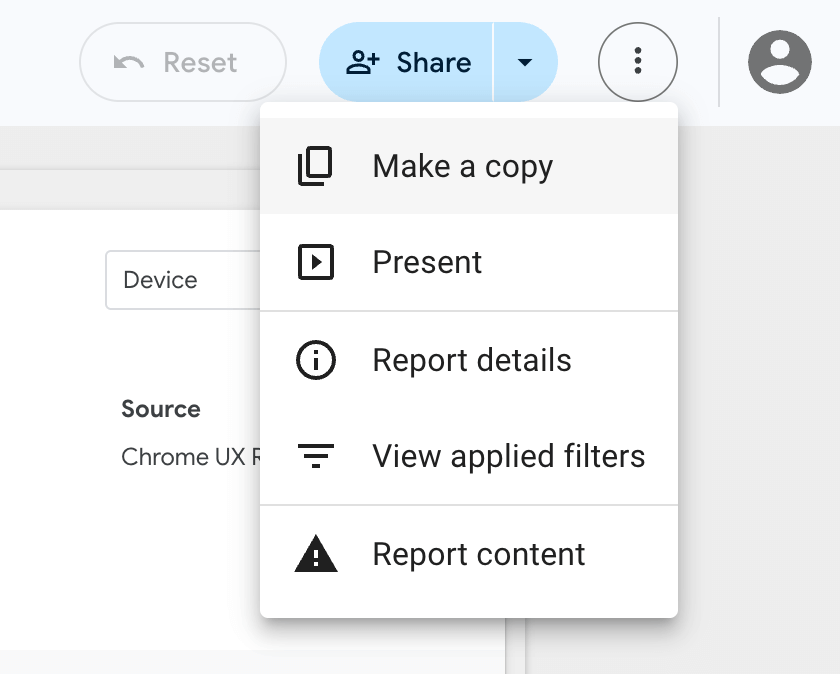
Three dots menu in Lookerstudio - You will be presented with the following option:
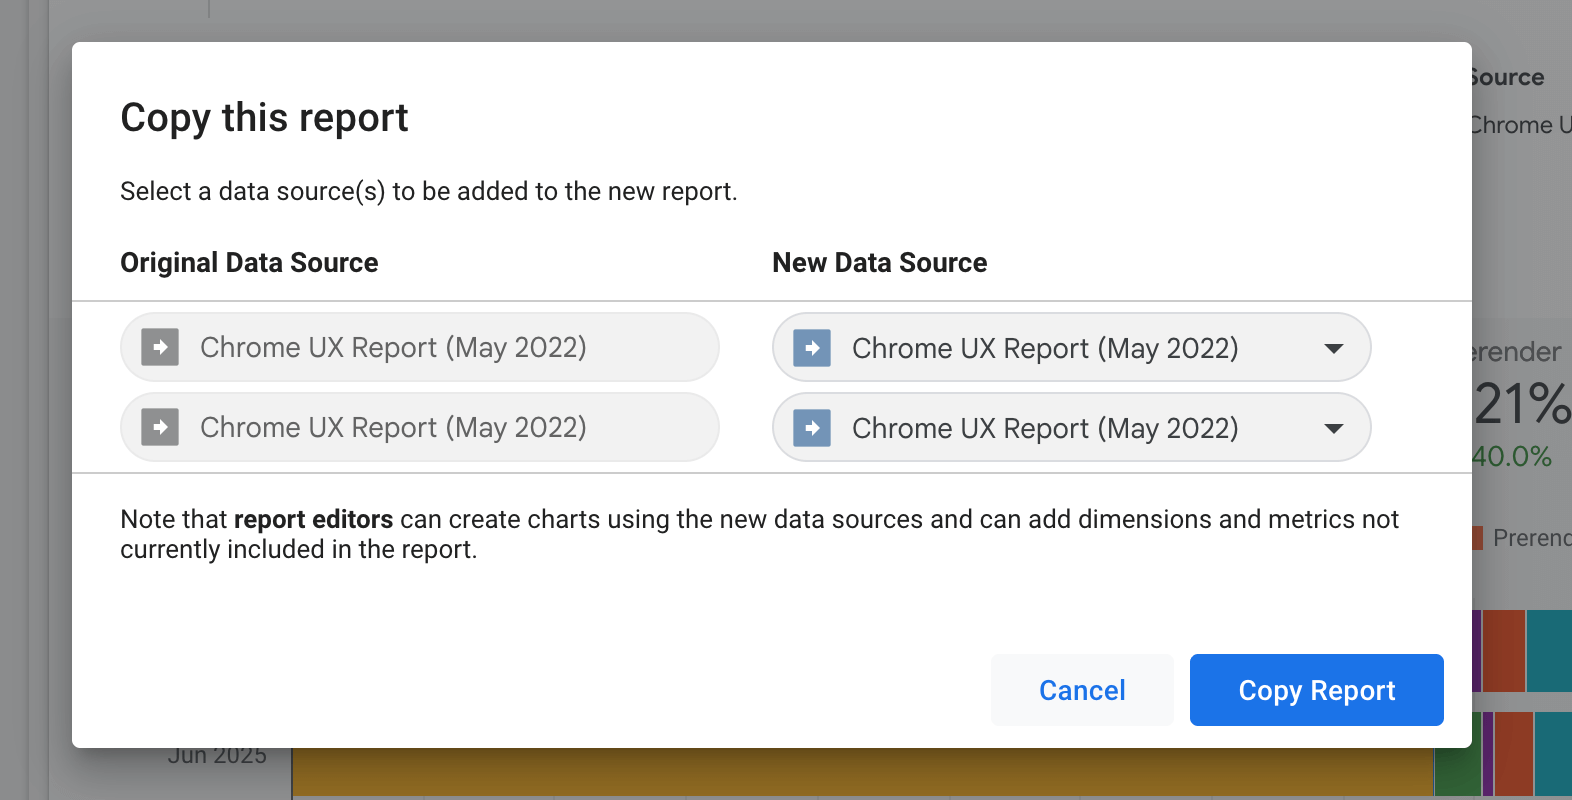
Copy this report dialog Change both to your new Dataset:
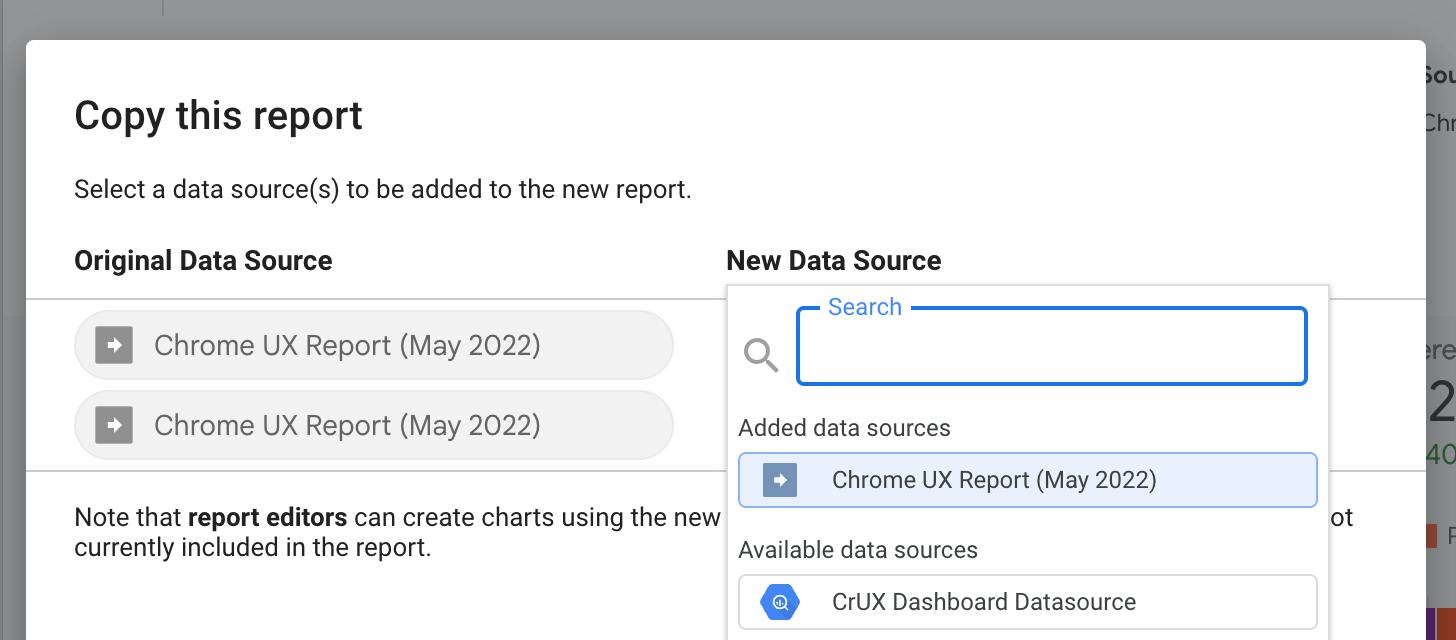
Selecting mapping data sources - When the report is created select Manage variables (parameters) in the Resource menu:
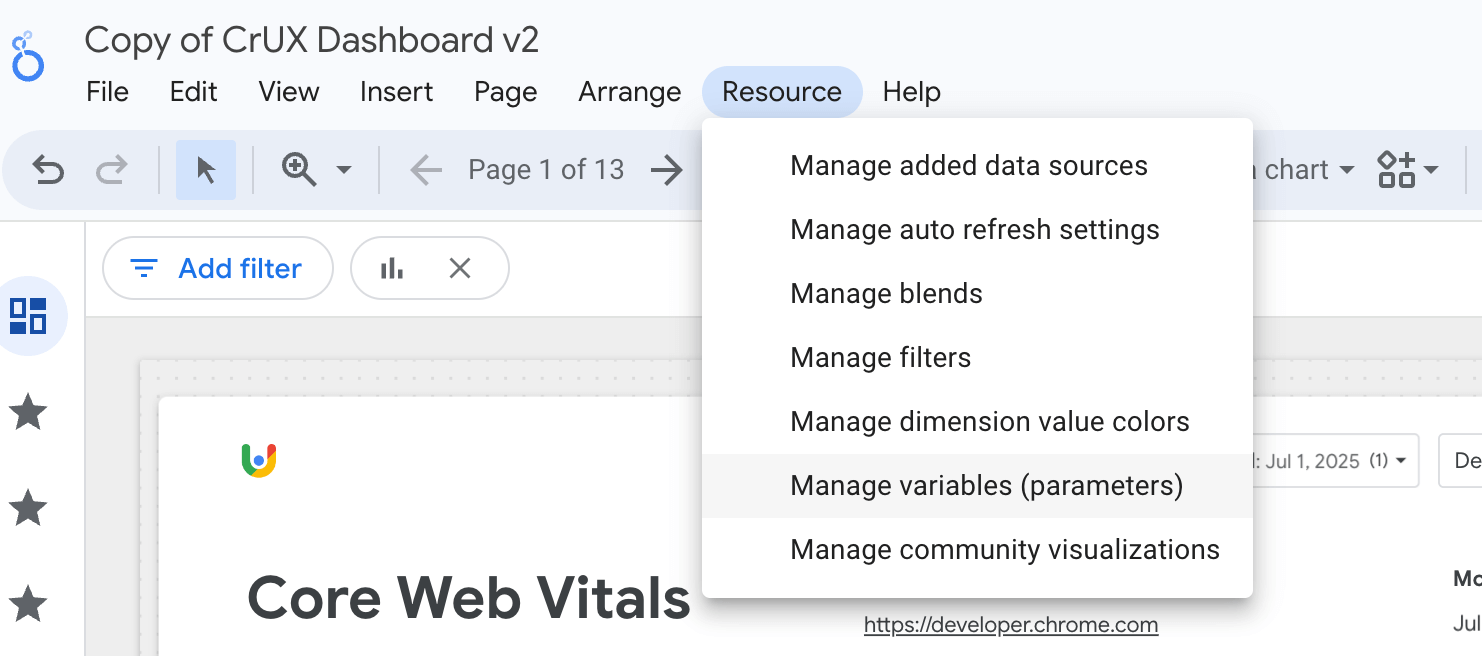
Manage variables (parameters) menu option - Click the Pencil edit button next to the name and remove the prefix (
ds117.in this example)
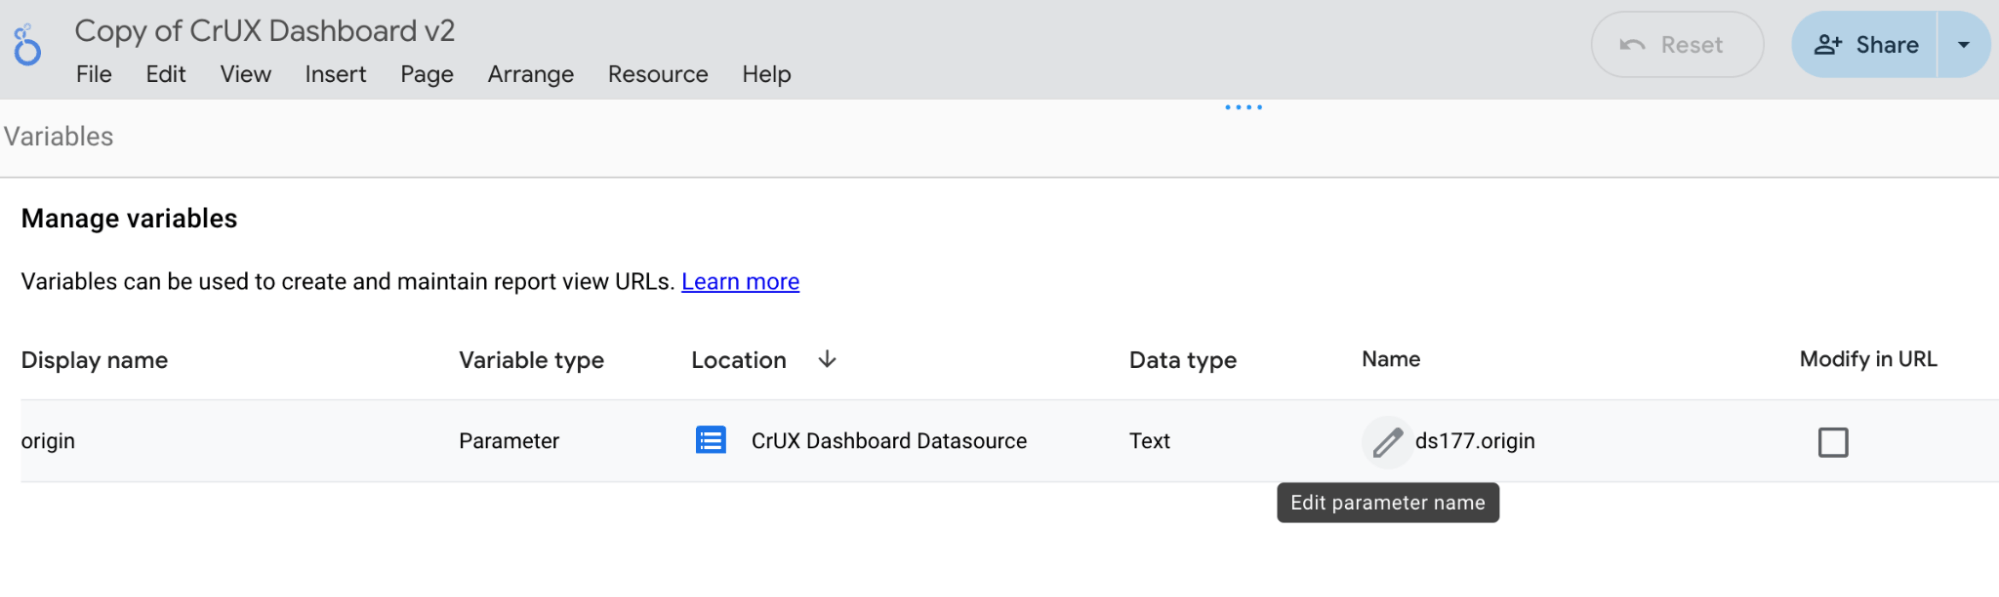
Edit parameter name - Also tick the Modify in URL checkbox to allow you to provide the origin in the URL
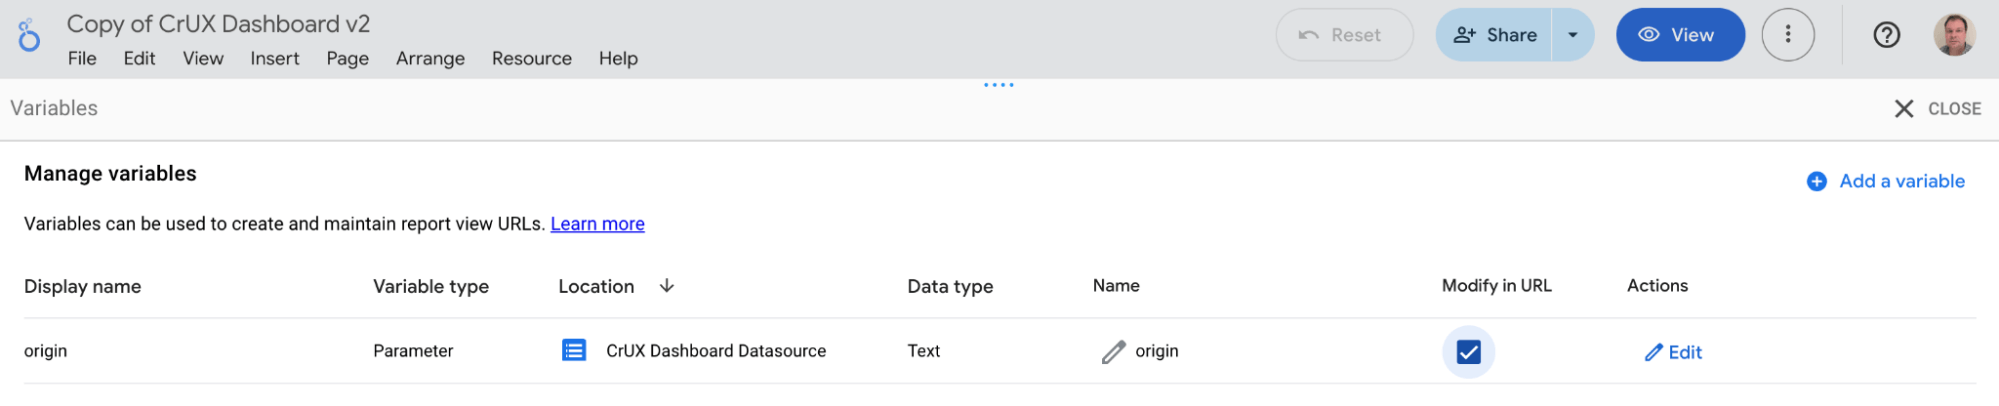
Manage variables screen - Click the CLOSE button in the top right hand corner.
- Double-click the "Copy of CrUX Dashboard v2" title in the top left hand corner to give it a new name.
- Under the Share button share the chart as you see fit. Note that each view of the charts will use your Bigquery project account, which can amount charges so be sure who you want to share this with. Screenshots or PDF extracts of the dashboard may be more appropriate for some users to save on costs.
You should now be able to use your new CrUX Dashboard chart in place of the old one, including with URL parameters.
Remember to update any links, custom search engines, or other shortcuts to point to your new dashboard.
Frequently Asked Questions (FAQ)
Following are some of the common questions we expect about this deprecation notice. Let us know if you have any other questions.
Why not keep the CrUX Connector going as a free way of accessing CrUX BigQuery data?
The infrastructure behind the CrUX Connector is what has been unreliable and requires maintenance and monitoring for when it fails. Even then we've been unable to maintain the quality and uptime of this service. We have invested in alternatives (the CrUX History API, and CrUX Vis) that are more reliable and better suited for users to depend on.
End of year time is a busy time for my industry, can you postpone this until 2026?
The CrUX Dashboard is not a real-time monitoring tool and the BigQuery data source is published 1-2 weeks after month end (and is based on data aggregated over the past 28 days). Especially for business critical periods, we recommend monitoring on a much shorter timespan. CrUX Vis is based on weekly data (again, aggregated over the previous 28 days) so is a better tool for those that want to monitor CrUX data over busy periods.
You should consider this announcement notice to move to alternative sources well before your busy period (whether that be CrUX Vis, or to continue to use the CrUX Dashboard but with your own credentials).
Will the CrUX BigQuery dataset be deprecated?
We plan on continuing to update and support the CrUX BigQuery dataset going forward. We see it as a valuable, longer term, public dataset. There may be slight differences in the datasets and what data is available in each (for example the LCP subparts are not yet available in BigQuery, and some of the older metrics are not available in our APIs), but broadly we aim to support all metrics in both our APIs and tooling.