


Web frameworks like Angular, React, Vue, and Svelte make it easier to write and maintain complex web applications at scale.
However, these frameworks introduce a layer of abstraction on top of the browser's application model. In fact, the code written by developers using these abstractions usually ends up being transpiled into unreadable, minified, and bundled code. As a consequence, fully leveraging the power of the DevTools to debug and profile these apps can be challenging for developers.
For example, when profiling an Angular application with the Performance panel in DevTools, this is what you see:
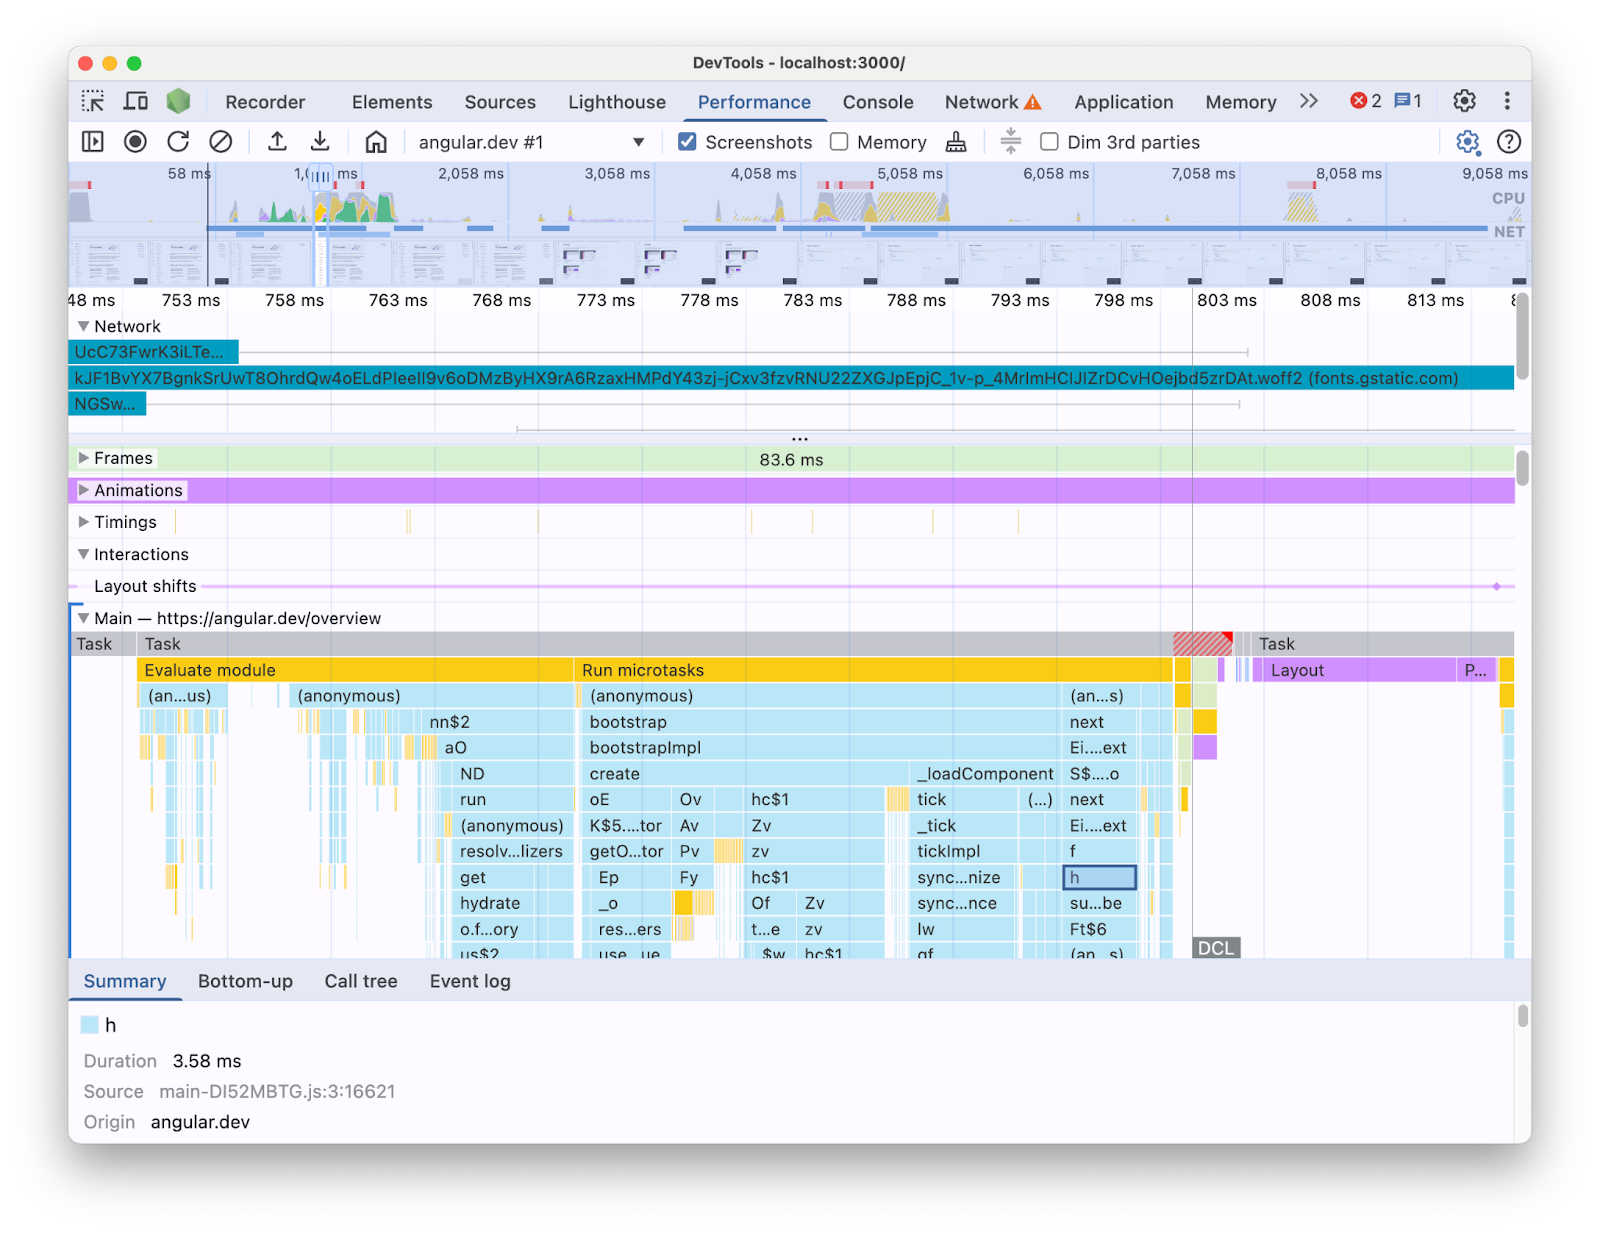
With the information presented this way, it can be difficult to figure out what performance bottlenecks exist in your codebase. After all, it is missing the context of the framework constructs and a good portion of the information shown is in terms of minified code. It is also hard to distinguish between the activity directly related with the code you wrote, framework internals, and other 3rd party code that might be running on the same page.
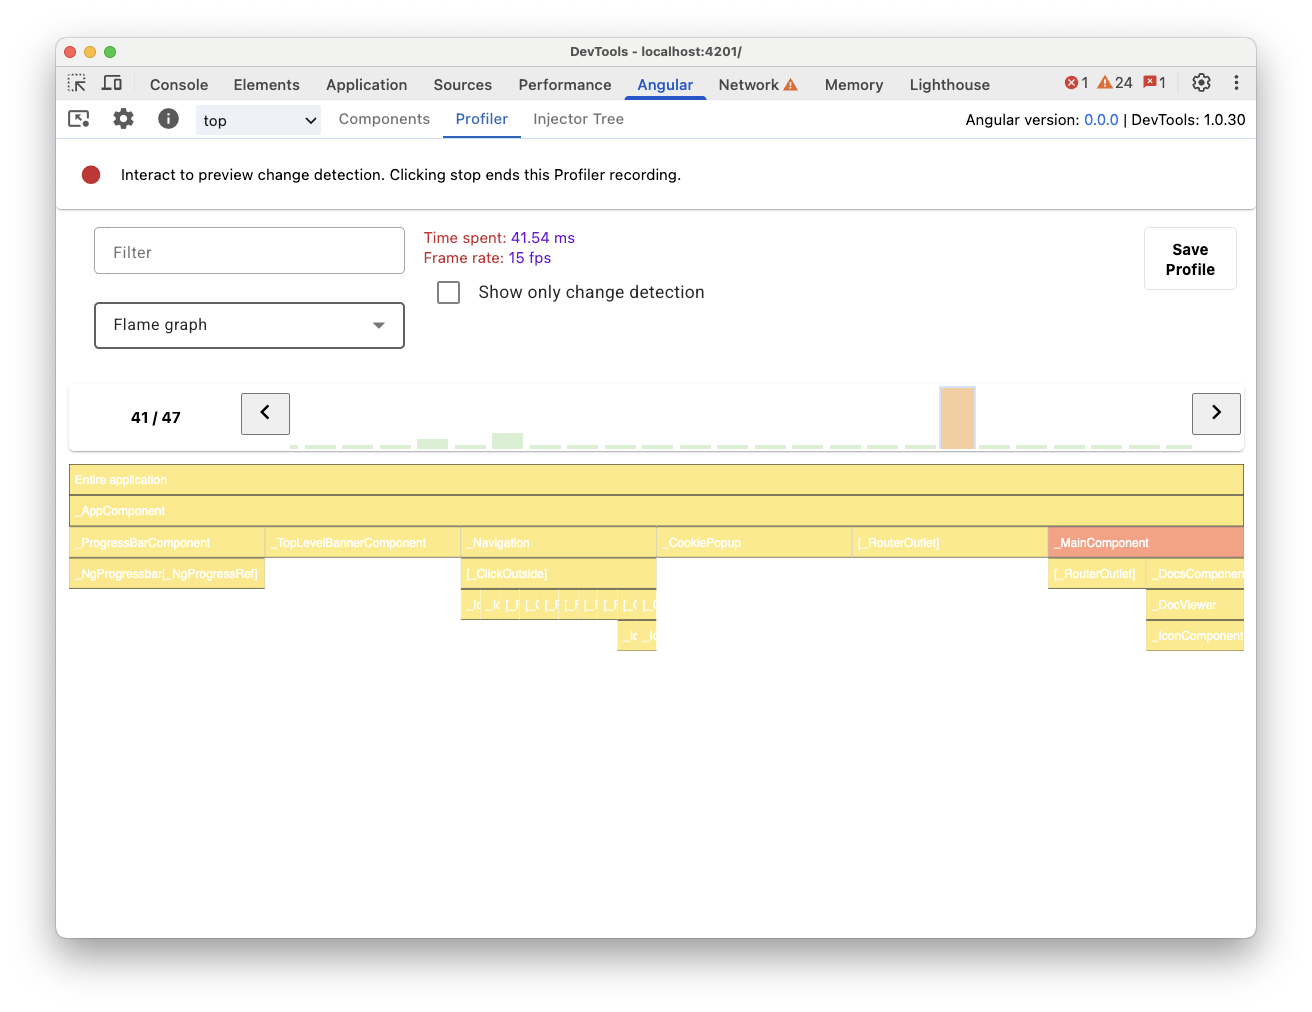
A common motivation for framework and abstraction authors is to implement their own DevTools extensions which present profiling data in terms of the framework concepts. These tools are very useful when debugging and profiling applications built with a specific framework. However, more often than not you will find yourself in need to correlate the framework data in your framework's own profiler with the browser runtime information in DevTools Performance panel. Having these two sources of data presented separately in independent tools makes it difficult to spot and fix bottlenecks, especially as the application gets more complex. Here is an example of a profile visualization in Angular DevTools Profiler:
In an ideal world, developers would have a view where the two sources of data are shown together in the same context mapped to the same timeline.
For this reason, we collaborated with the Angular team, to bring Angular runtime data right into the Performance panel using the Performance panel Extensibility API. In this post, we'll look into what the API can do and how it was used in the Angular framework to achieve this. The implementation can serve as an example for other frameworks and abstractions looking to improve their developer experience by instrumenting their own tools and helping developers using Chrome DevTools.
What is the Performance panel extensibility API?
The API lets you add your own timing entries to the Performance panel trace, within the same timeline as the rest of the browser data. There are two mechanisms that let you do this:
- The User Timing API
- The
console.timeStampAPI
The User Timing API
You can use performance.mark and performance.measure to add the entries like so:
// Mark used to represent the start of some activity you want to measure.
// In this case, the rendering of a component.
const renderStart = performance.now();

// ... later in your code

performance.measure("Component rendering", {
  start: renderStart,
  detail: {
    devtools: {
      dataType: "track-entry",
      track: "Components",
      color: "secondary",
      properties: [
        ["Render reason", "Props changed"],
        ["Priority", "low"]
      ],
    }
  }
});
This will result in the Components track added to your timeline with the measurement:
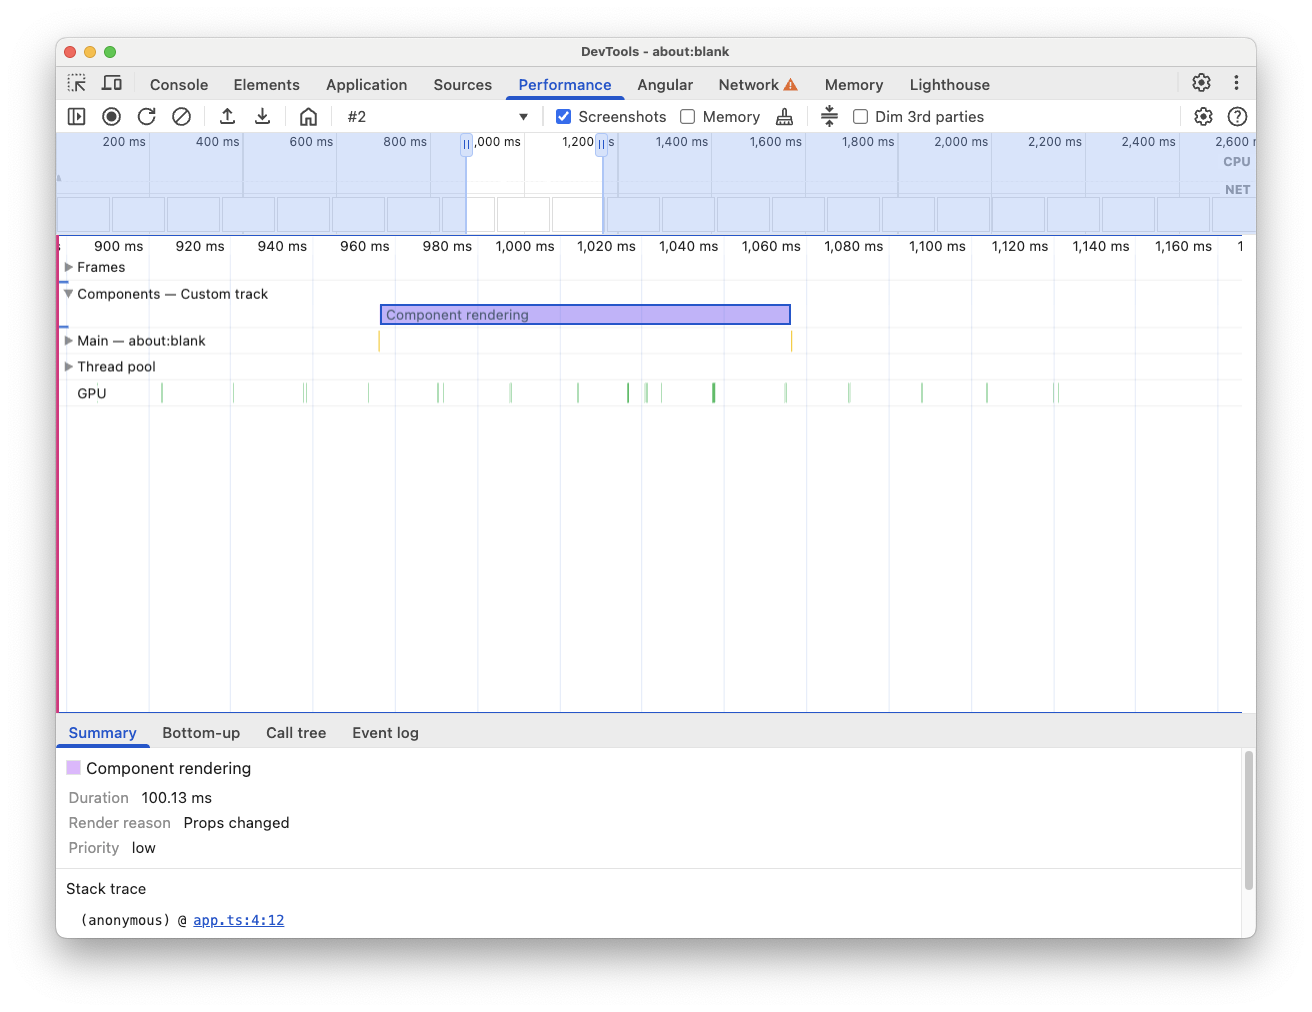
This API lets you add the entries to the Performance timeline buffer, while also displaying them in the DevTools Performance panel UI.
Learn more about this API and the devtools object in the docs.
The console.timeStamp API
This API is a lightweight alternative to the User Timing API. Using the same example as before, you could have:
// Mark used to represent the start of some activity you want to measure.
// In this case, the rendering of a component.
const renderStart = performance.now();

// ... later in your code

console.timeStamp(
"Component rendering",
/* start time */ renderStart,
/* end time (current time) */ undefined,
/* track name */ "Components",
 /* track group name */ undefined,
 /* color */ "secondary"
);
This API provides a high-performance method for instrumenting applications: unlike the User Timing API alternative, it doesn't create buffered data. This API exclusively adds data to the **Performance** panel in DevTools, this means that when the DevTools is not recording a trace, the calls to the API no-ops (they don't do anything), making it significantly faster and appropriate for performance sensitive hot paths. The choice of using positional arguments instead of an object containing all the customization parameters also serves the purpose of keeping the API as lightweight as possible.
Learn more about using the console.timeStamp to extend the Performance panel and the parameters you can pass in the docs.
How Angular has integrated the DevTools extensibility API
We'll have a look at how the Angular team used the extensibility API to integrate with Chrome DevTools.
Avoid overhead with console.timestamp
Angular's instrumentation with the Performance panel extensibility API is available as of version 20. The sought-after level of granularity for performance data in DevTools requires a speedy API, so the pull request (60217) that added the instrumentation opted to use the console.timeStamp API. This prevents the application runtime performance from being affected by the potential overhead of the profiling API..
Instrumented data
To provide a good picture of what Angular code is running as well as why it is running in the first place, multiple parts of the start up and rendering pipelines are instrumented, including:
- Application and component bootstrapping.
- Components creation and updates.
- Event listeners and lifecycle hooks execution.
- Many others (for example, dynamic component creation and defer block rendering).
Color coding
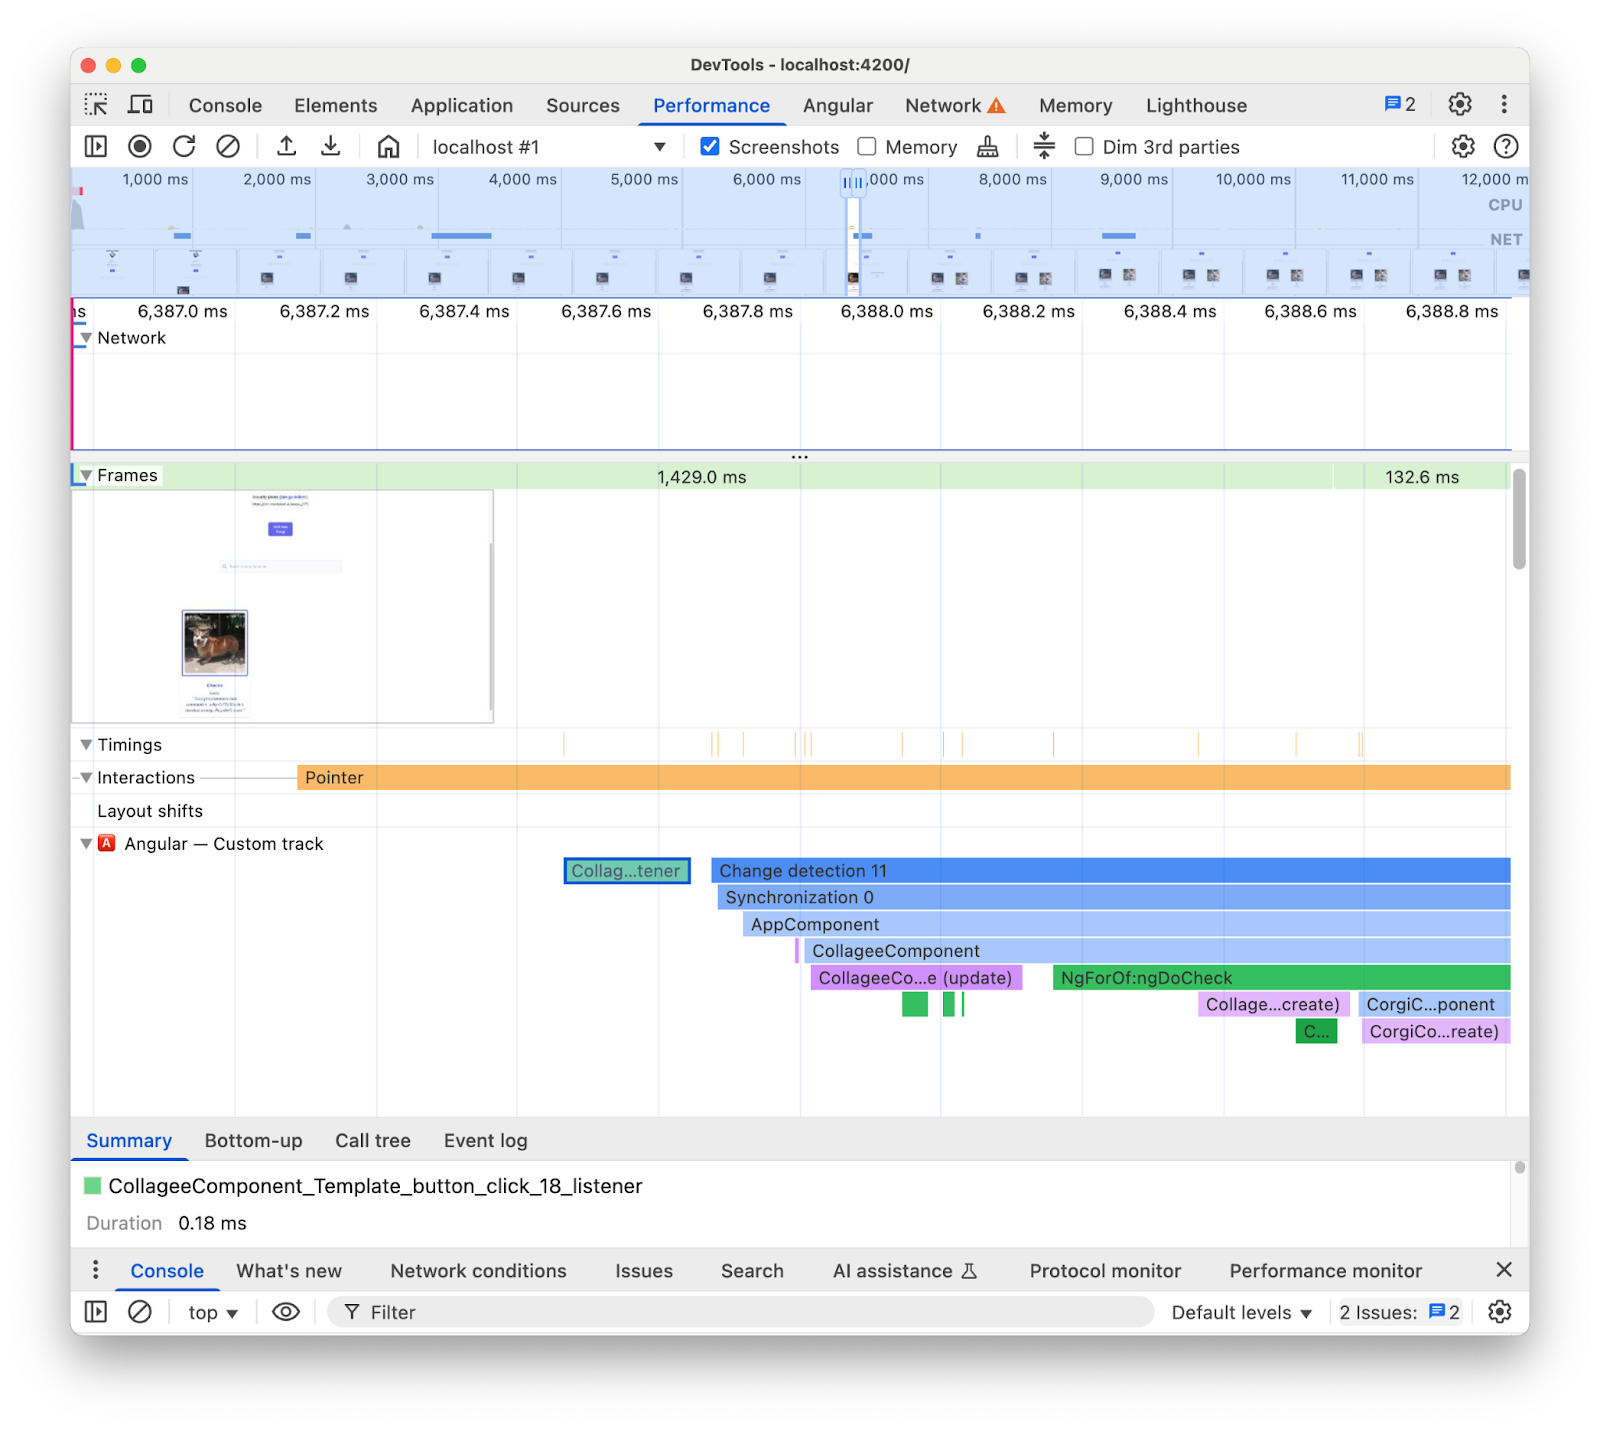
Color coding is used to signal the developer about the category a certain measurement entry falls into. For example, the colors used for the entries marking the execution of TypeScript code authored by the developer are distinct from the colors used for code produced by the Angular compiler.
In the following screenshot, you can see how this results in entry points (like change detection and component processing) in blue, generated code in purple and TypeScript code (like event listeners and hooks) rendered in green.
Note that the color argument passed to the API is not a CSS color value but a semantic token which is mapped to a color that matches DevTools UI. The possible values being primary, secondary and tertiary, with their respective -dark and -light variants as well as an error color.
Tracks
At the moment of writing, all of the Angular runtime data is added to the same track (labelled "🅰️ Angular"). However, it is possible to add multiple tracks to the trace and even to group your tracks. For example, given the following calls to the console.timeStamp API:
console.timeStamp("Component 1", componentStart1, componentEnd1, "Components", "Client", "primary");
console.timeStamp("Component 2", componentStart2, componentEnd2, "Components", "Client", "primary");
console.timeStamp("Hook 1", hookStart, hookEnd, "Hooks", "Client", "primary");
console.timeStamp("Fetch data base", fetchStart, fetchEnd, "Server", "primary");
You would see the data organized in tracks in the following way:
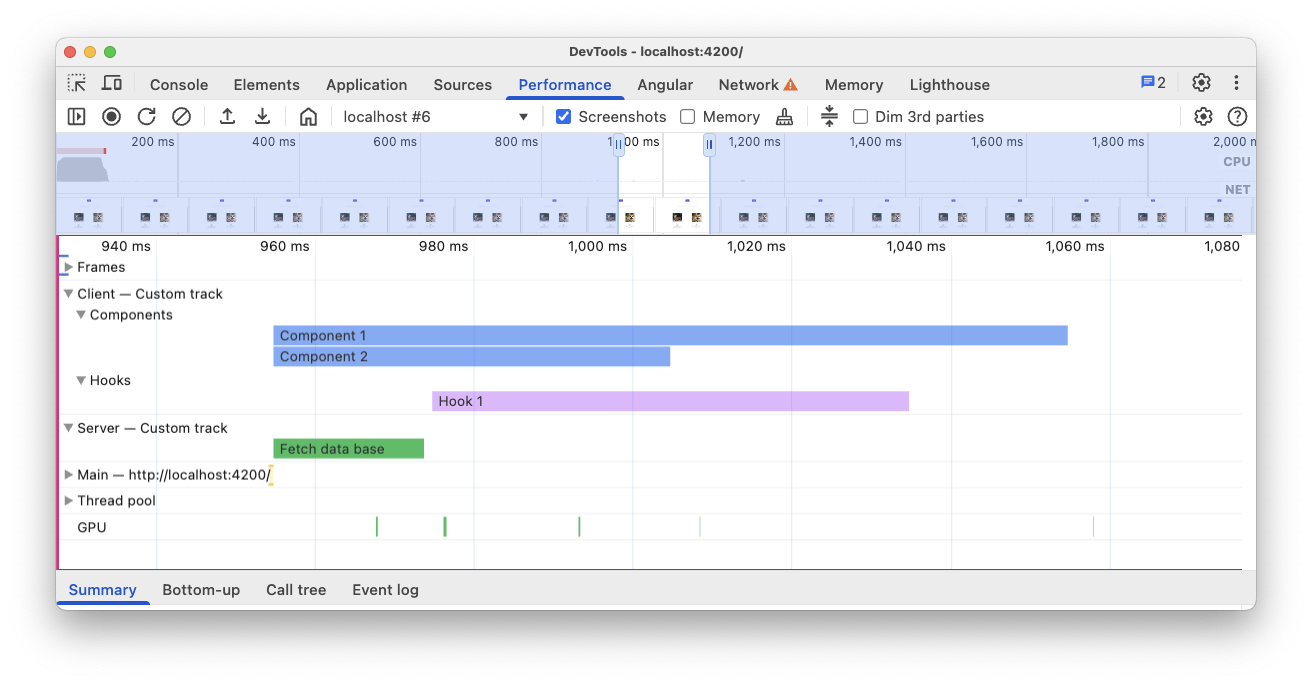
Using separate tracks can be useful for example when you have asynchronous activity, multiple jobs running in parallel or just activity groups distinct enough that they are worth separating in different areas of the UI.
Why this matters for Angular developers
The goal with this direct integration is to provide a more intuitive and comprehensive performance analysis experience. By surfacing Angular's internal performance data directly within the **Performance** panel, developers will get:
- Enhanced Visibility: Making Angular-specific performance events like component rendering, change detection cycles, and more, visible within the broader browser timeline.
- Improved Understanding: With context-rich information about Angular's internal processes, helping you pinpoint performance bottlenecks more effectively.
Enabling the integration
The usage of the extensibility API is officially available in development builds as of Angular version 20. To enable it you have to run the global util `ng.enableProfiling()` in your app or in the DevTools console. See more information about the integration in the [Angular Docs](https://angular.dev/best-practices/profiling-with-chrome-devtools)
Other Considerations
Some important considerations to be taken into account.
Source maps and minified code:
Source maps are a widely adopted tool aiming to bridge the gap between bundled / minified code and it's authored counterpart, so...
Aren't source maps supposed to resolve the issue of minified code in bundled apps?
While source maps are indeed helpful, they don't completely eliminate the challenges when profiling complex minified web apps. Source maps allow DevTools to map the minified code back to your original source code, making debugging easier. However, relying solely on source maps for performance analysis can still present some limitations. For example, choosing the way in which framework internals and authored code is visually separated is complicated with source maps alone. The extensibility API on the other hand provides the flexibility to achieve this distinction and present it in the way the developer considers most convenient.
Chrome DevTools Extensions:
Chrome extensions using the DevTools API are a widely used tool to extend devtools.
Are dedicated profilers (for example Chrome DevTools extensions) unnecessary or discouraged now that this API is available?
No, this API isn't intended to replace or discourage the development of dedicated profilers like Chrome DevTools extensions. These can still offer specialized features, visualizations, and workflows tailored to specific needs. The Performance panel extensibility API aims to create a seamless integration of custom data with the browser visualizations in the Performance panel.
The path forward
The prospect of the extensibility API.
Work with more frameworks and abstractions
We are excited about other frameworks and abstractions adopting the API to improve the profiling experience of their developers. React for example has implemented an experimental adoption of the API for their framework. This instrumentation surfaces client and server component rendering as well as React scheduling APIs data. Find out more about it and how to enable it on the React's page.
Production builds
One of the aims with this API is to work with frameworks and abstraction providers in general to adopt and enable the instrumentation in production builds. This could have a big impact on the performance of the apps developed with these abstractions, as developers would be able to profile the application as their users experience it. We believe that the console.timeStamp API allows to achieve this, given its speed and low overhead. However, at the moment frameworks are still experimenting with the API and probing what kinds of instrumentations are more scalable and useful for developers.