Hallo! It's Kayce again, tech writer for DevTools. For this DevTools Digest I thought I'd switch it up a little and do a roundup of some perf tooling improvements in DevTools over the last few Chrome releases.
All features are already in Chrome Stable unless noted otherwise.
CPU throttling for a mobile-first world
Available in Chrome 54, which is currently Canary.
Software is eating the world, and mobile is eating software. DevTools is steadily evolving to better meet the needs of a mobile-first development world. The latest development in DevTools' mobile-first tooling is CPU Throttling. Use this feature to gain better awareness of how your site performs on resource-constrained devices.
Select one of the options from the CPU Throttling dropdown menu on the Timeline panel to handicap the computing power of your development machine.

Some notes about CPU throttling:
- Throttling immediately takes effect and continues until you disable it, just like network throttling.
- This feature is for general awareness of how your site would probably perform on a resource-constrained device. It's impossible for DevTools to truly emulate the performance characteristics of a mobile system on chip.
- Throttling is relative to your development machine. In other words, 5x throttling on a top-of-the-line desktop will yield different results than 5x throttling on a five-year-old budget laptop.
With that said, combine CPU Throttling with Network Throttling and Device Mode, and you start to get a much better picture about how your site will look and perform on mobile devices, right from the convenience of your development machine browser.
Network view in timeline recordings
Enable the Network checkbox next time you take a Timeline recording to analyze how your page downloaded its resources. Click on a resource to view more information about it in the Summary pane.
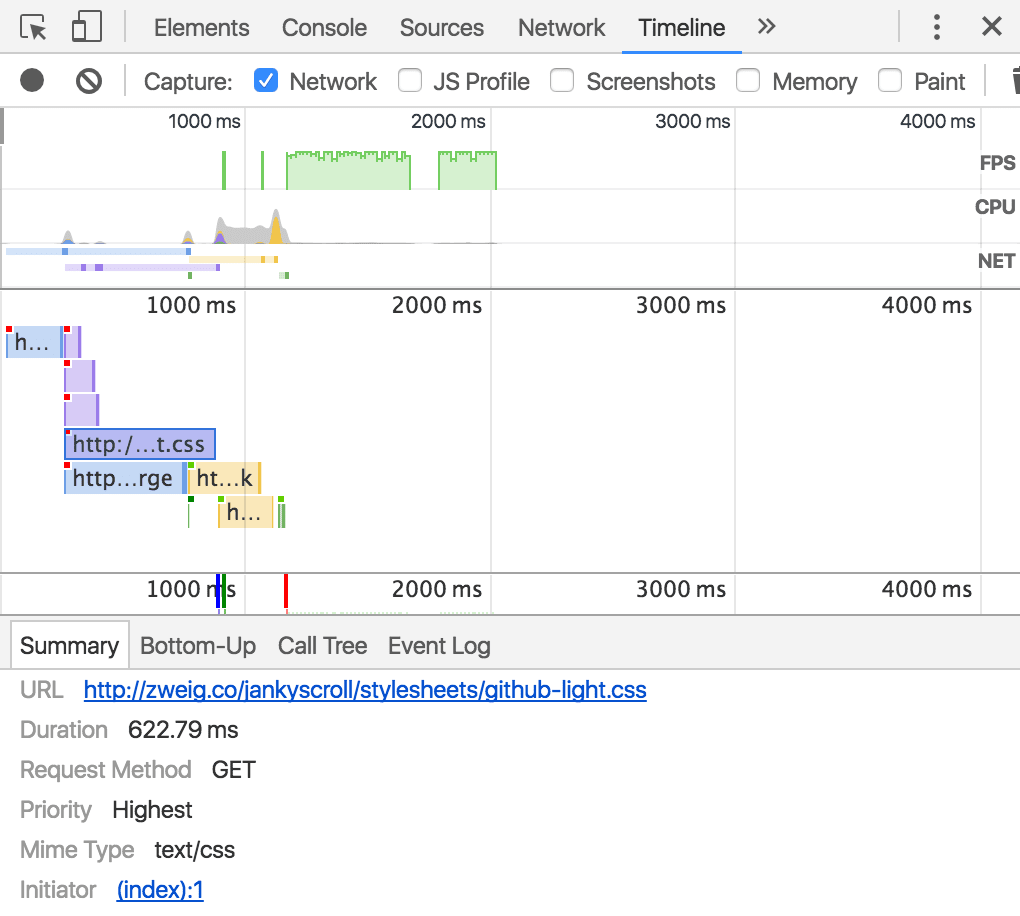
The Initiator field in the summary is particularly useful. This field tells you where the resource is being requested.
Passive event listeners
Passive event listeners are an emerging standard to improve scroll performance. Check out this article by yours truly to learn more:
Improving scroll performance with passive event listeners
DevTools has shipped a couple features to help you find listeners that could benefit from a little {passive: true} love.
First off, the Console emits a warning when a synchronous listener is blocking page scroll for unreasonable amounts of time.

You can test this out for yourself in the demo below:
Scroll jank due to touch/wheel handlers demo
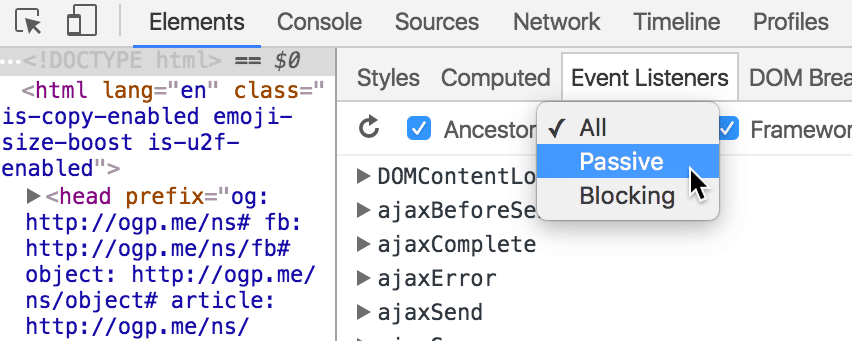
Next, you can use the little dropdown menu on the Event Listeners pane to filter for passive or blocking listeners.
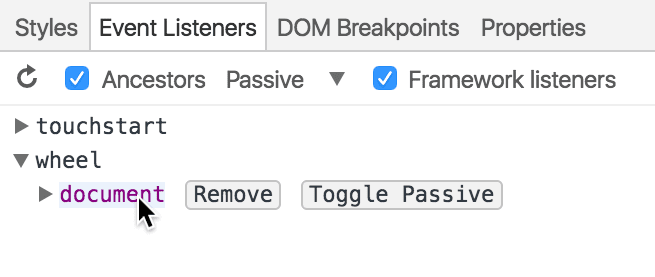
Last, you can toggle the passive or blocking state of a listener by hovering over it and pressing Toggle Passive. This feature is currently limited to touchstart, touchmove, mousewheel, and wheel event listeners.
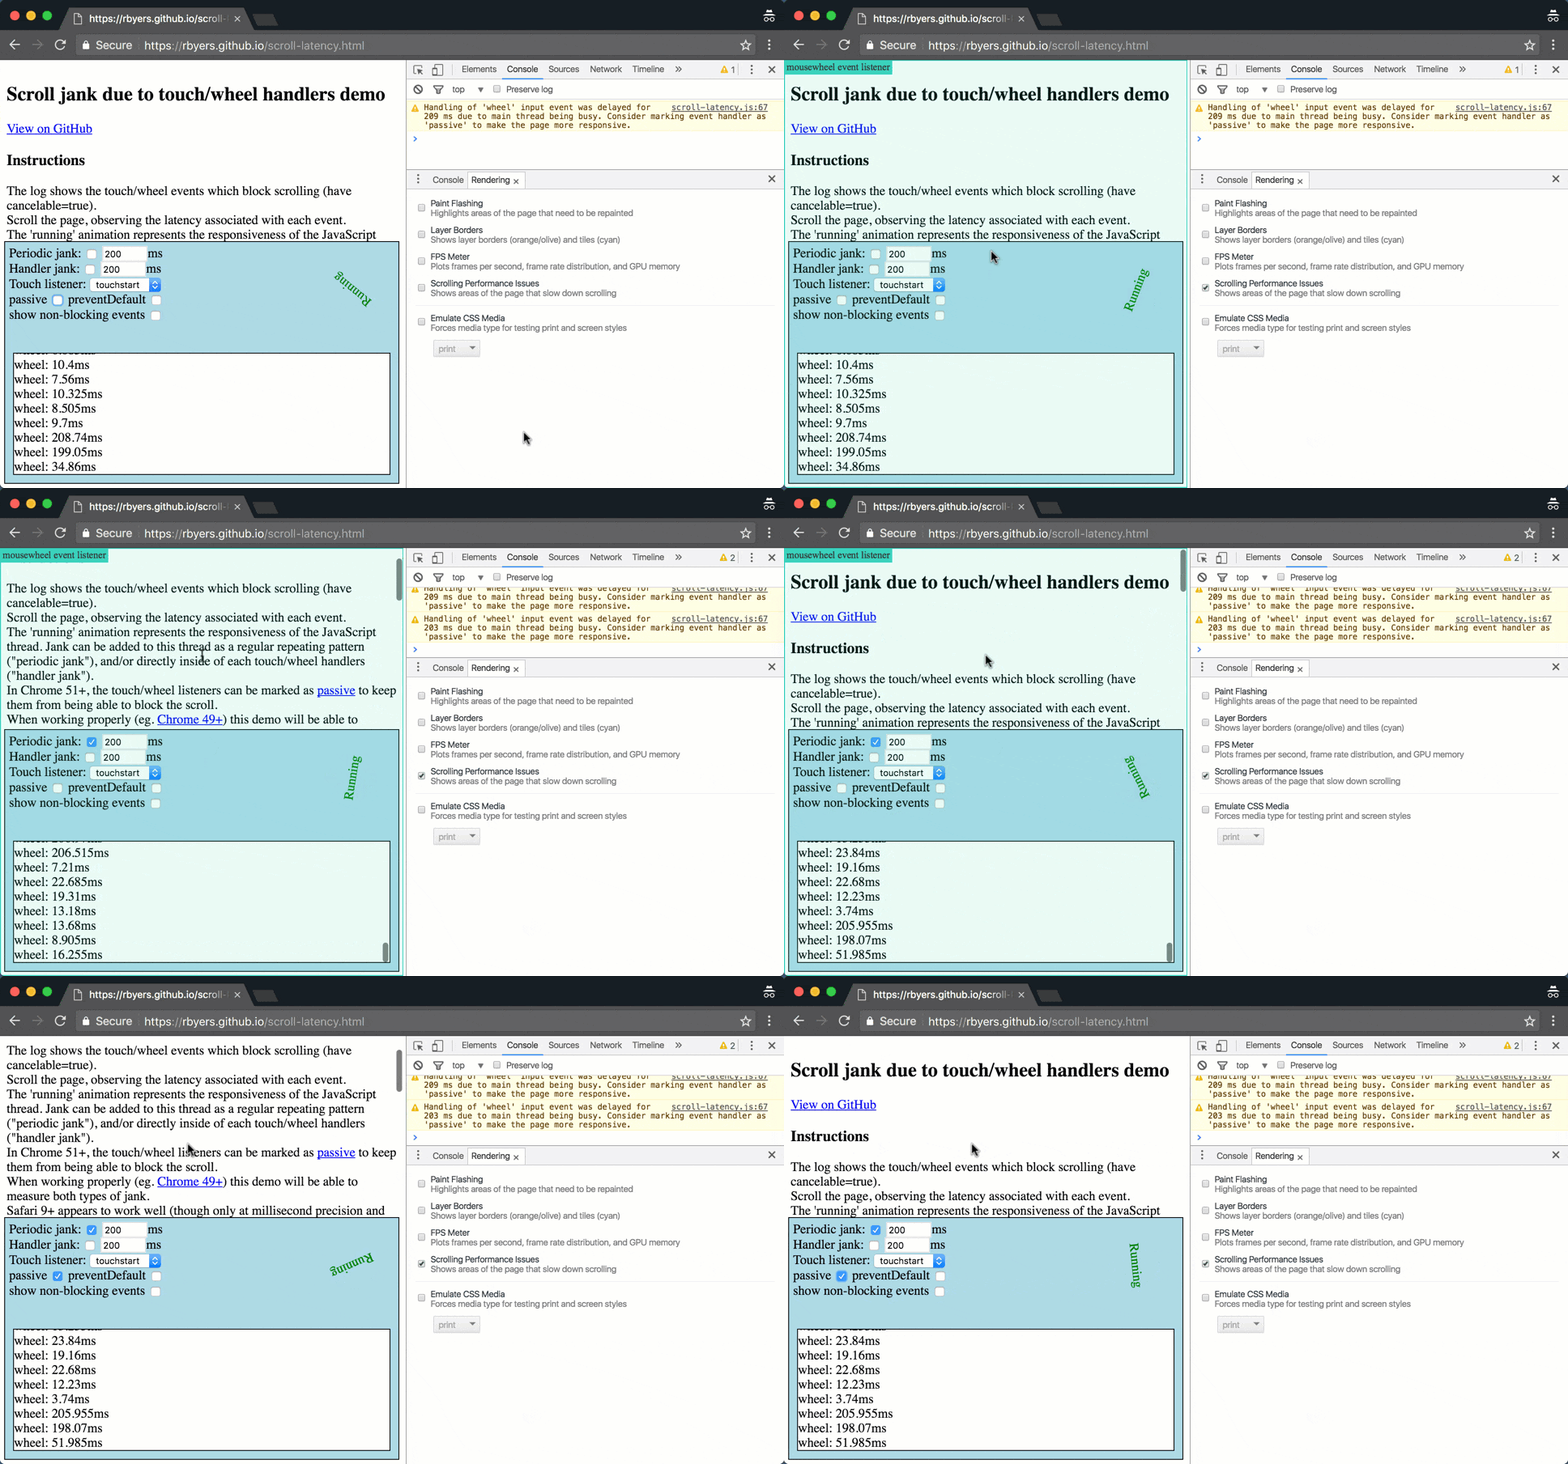
I'll wrap this section up with a little tip. Enable the Scrolling Performance Issues checkbox on the Rendering drawer to get a visual representation of potential scrolling issues. When a section of a page is highlighted, it means that there is a listener bound to that section of the page that might negatively affect scroll performance.
Group by activity
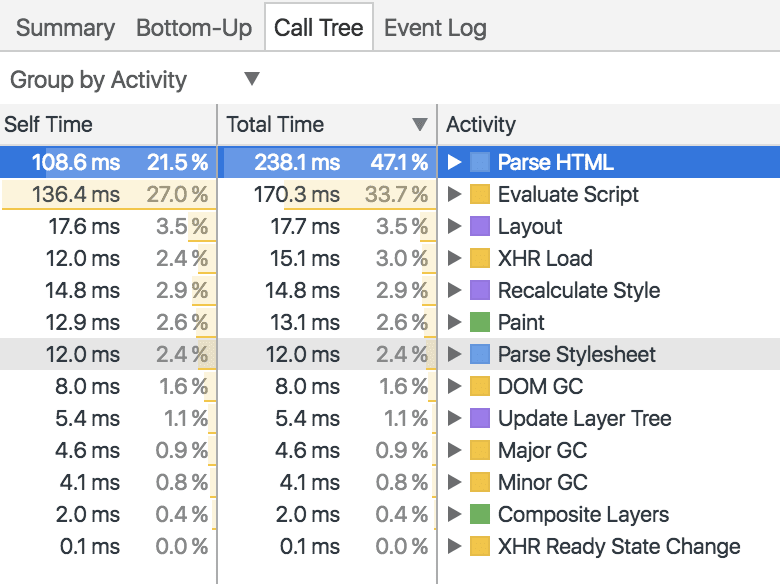
Back in mid-June the Call Tree pane on the Timeline panel got a new sorting category: Group by Activity. This grouping lets you view how much time your page spent parsing HTML, evaluating scripts, painting, and so on.
Timeline stats in the sources panel
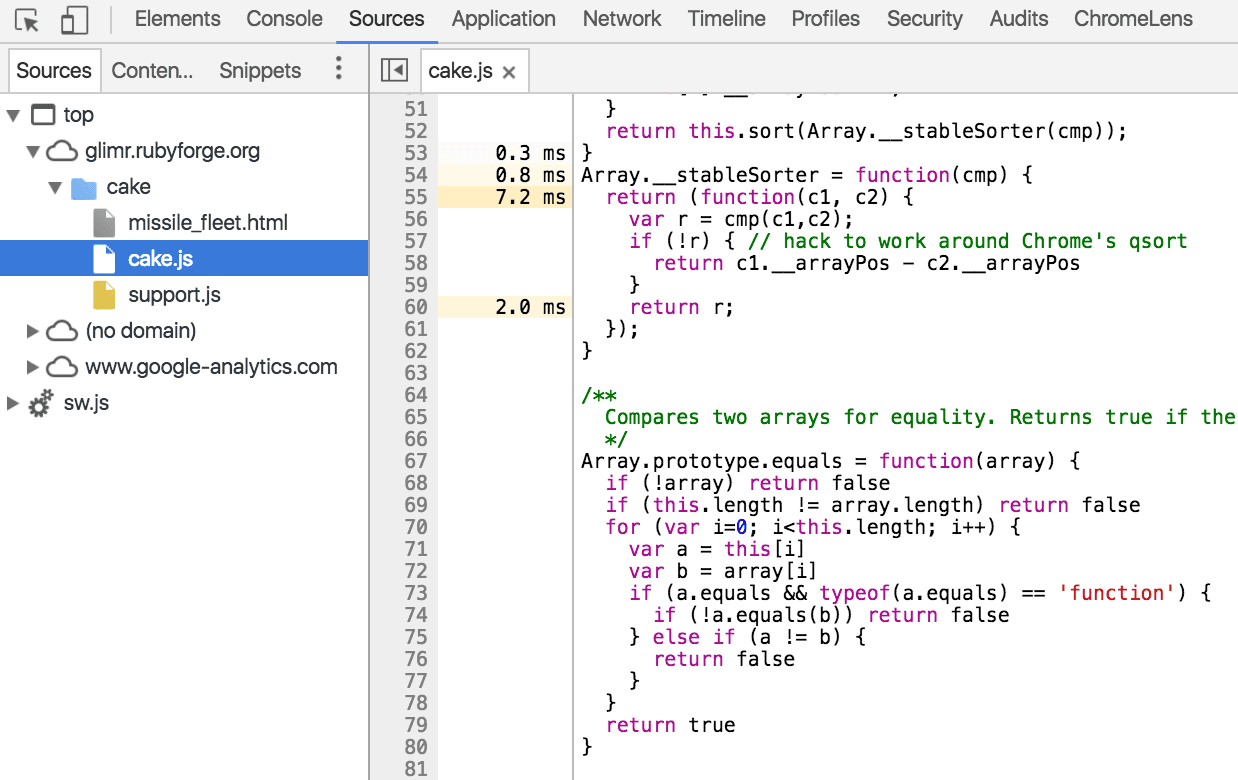
Create a Timeline recording with the JS Profile option enabled, and you can see a function-by-function breakdown of execution times in the Sources panel.
Share your perspective
As always, we'd love to hear your feedback or ideas on anything DevTools related.
- Ping us at ChromeDevTools on Twitter for brief questions or feedback, or to share new ideas.
- For longer discussions, the mailing list or Stack Overflow are your best bets.
- For anything docs related, open an issue on our docs repo.
Until next month!

