

Published: August 25, 2026
Chrome 152 brings significant enhancements to network debugging with request resending and binary payload inspection, custom element adorners and enhanced CSS nesting in Elements, Core Web Vitals for soft navigations in Performance Live Metrics, structured table exporting in the Console, and improvements for the DevTools MCP server.
DevTools for agents
The newest v1.7.0 release of the Chrome DevTools MCP server builds out the previously introduced memory debugging capabilities for coding agents like Antigravity, Claude, Codex and others:
- Heap snapshot object details (
get_heapsnapshot_object_details): Inspect detailed JavaScript object properties, class names, and GC root retaining paths directly from heap snapshots. - Native V8 context filtering: Filter heap snapshot objects by native execution context and inspect native contexts in snapshot summaries.
- Daemon stability and lifecycle improvements: Added bounded per-navigation network request retention, session ID validation, CLI-to-daemon version mismatch warnings, and graceful worker teardown on context disposal.
To learn more and get started, visit the DevTools for agents repository on GitHub.
Network: Edit and resend requests, preloading insights, and binary payload decoding
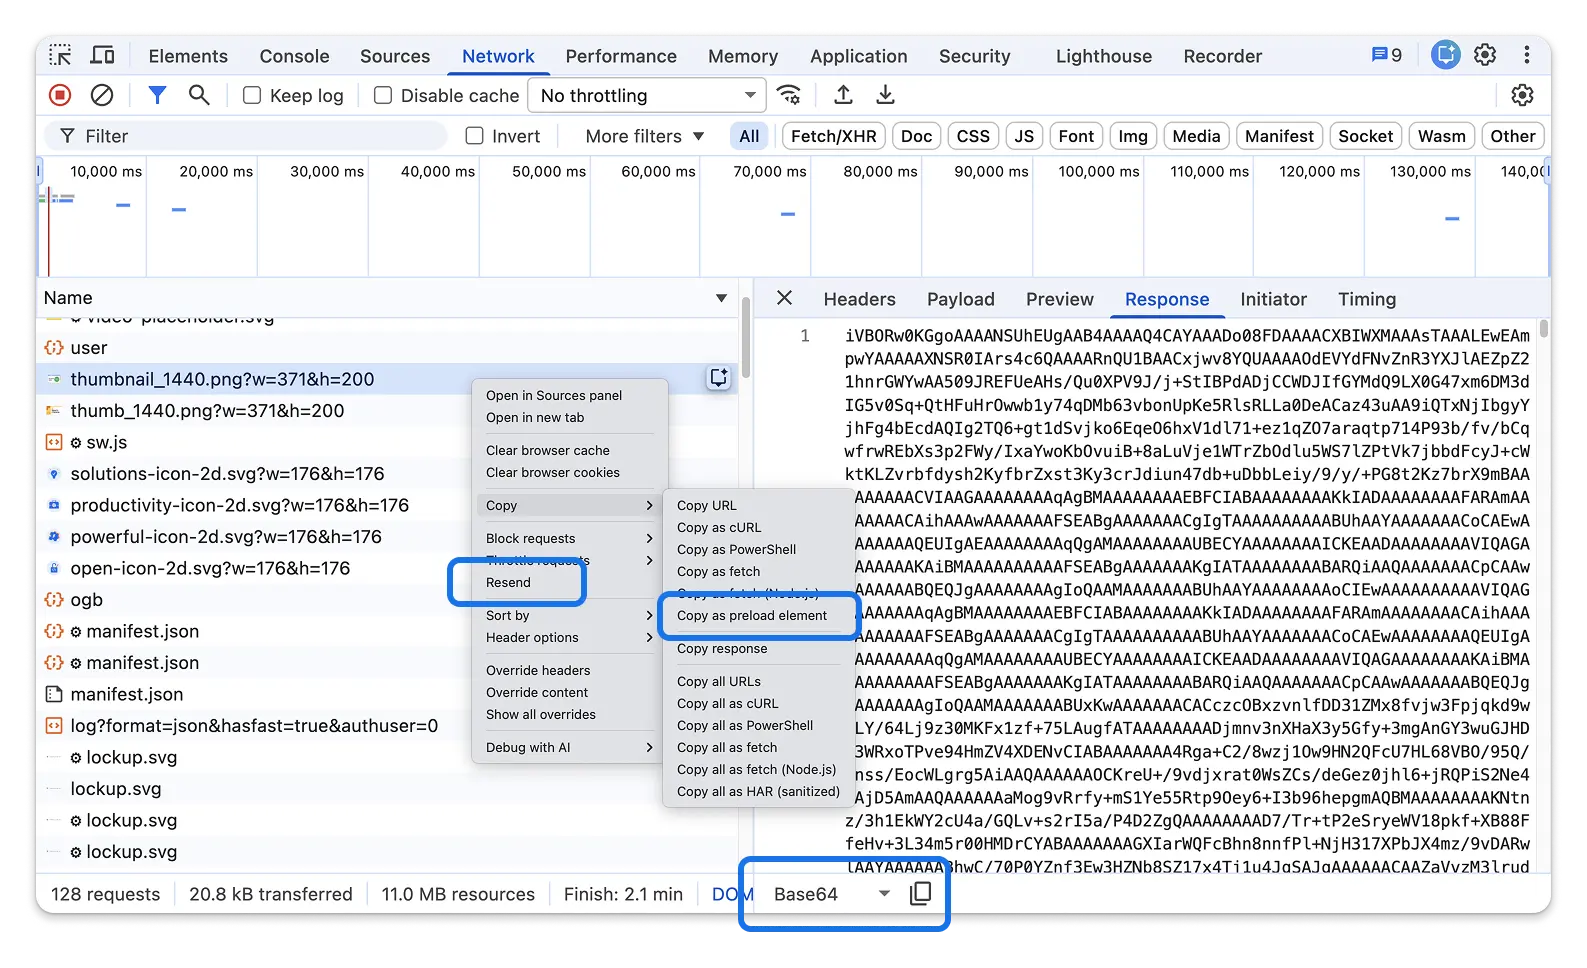
- Resend fetch and XHR requests: The former "Replay XHR" context menu item
is now Resend. It now supports all fetchable network requests,
converting standard requests to
fetch()calls while preserving full replay fidelity alongside XHR. Requests also track and display their execution context and console originator. - Preloaded column and "Copy as preload element": A new dedicated
Preloaded column displays whether a network request was initiated using
speculative preloading. You can also right-click any request and select
Copy as preload element to generate a
<link rel="preload">tag ready to drop into your HTML. Early Hints are now categorized under the Initiator column. - Binary viewer for request payloads: The Payload tab now includes decoding method options (Base64, Hex, and UTF-8) for binary and compressed request payloads, mirroring the Response tab.
- Pinned Request Number column: The Request
#column is now pinned to the first position in the Network data grid for easier request referencing. - Same-site host filtering: Searching for domains, hostnames, or ports
(e.g.
localhostorexample.com) in the Network filter bar now accurately filters same-site requests. - Default query parameter decoding: Query and form parameters in the Payload tab are now decoded automatically for all requests.
Chromium issues: 40726969, 41299075, 40138847, 40222701, 525848667, 507077182, 498482622, 520437951, 40267477
Elements: Custom element adorners, nested CSS parent selector interactions, and $0 pseudo-element selection
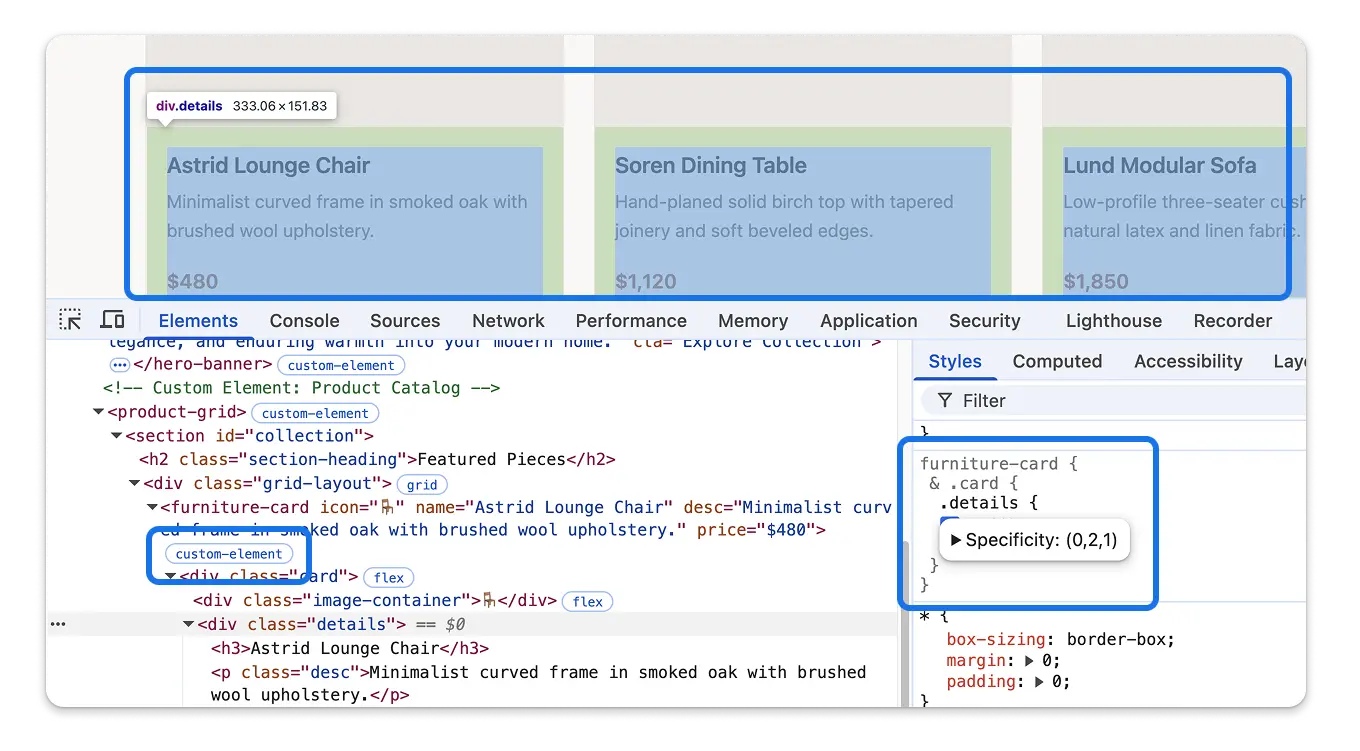
Inspecting and authoring web components and modern CSS is faster and more intuitive in the Elements panel:
- Custom element adorner badge: Custom HTML elements (identified by
hyphenated tags or
is="..."attributes for customized built-in elements) now display acustom-elementadorner badge in the DOM tree outline. - Nested CSS parent selector interactions & specificity: Hovering over
parent selectors in nested CSS rules and inherited nested rules now
highlights matching elements on the page and responds to Styles tab
filtering. Added specificity tooltip popovers for
@nested-declarationsrules. - Pseudo-element selection via
$0: Selecting pseudo-elements like::beforeor::afterin the Elements DOM tree now binds them directly to the$0console variable for immediate JavaScript inspection. - Autocompletion for
text-wrapand<image>types: The Styles pane now suggests all keyword values fortext-wrap(wrap,nowrap,balance,pretty,stable) and autocompletes CSS properties accepting<image>data types. - Box Model scrollbar awareness: The Box Model metrics diagram now accurately computes and renders content box dimensions when elements have visible scrollbars.
Chromium issues: 367440148, 535517817, 535522242, 535523039, 537724428, 399305533, 334984154, 383355294, 326260752, 389342065
Performance: Soft navigation metrics in Live Metrics and custom screenshot presets
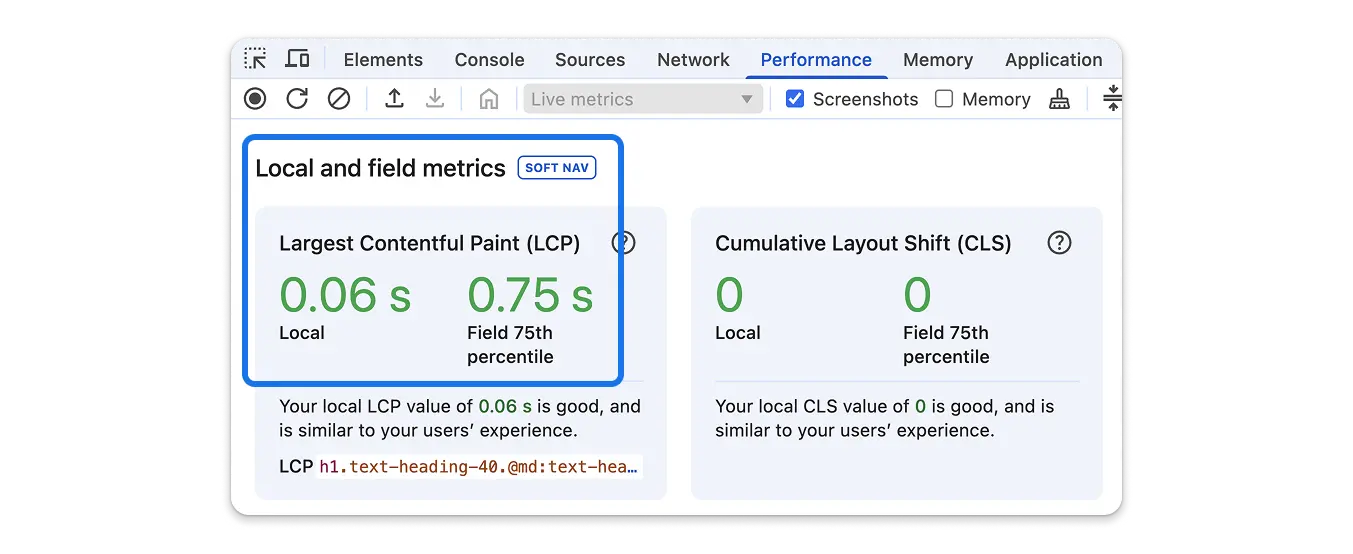
- Live Metrics support for soft navigations: The Live Metrics view now
captures and reports Core Web Vitals (such as LCP and INP) for client-side
soft navigations in single-page applications by default, powered by an
upgrade to
web-vitalsv6.0.0. - Custom screenshot capture presets: Exposed configurable screenshot frame size and count cap presets for CDP tracing in the Performance panel to customize visual recording fidelity within memory budgets.
console.profileEnd()trace revealer: Callingconsole.profileEnd()in your code or console now automatically opens and reveals the recorded trace in the Performance panel.- Extensibility API custom tracks summary: Performance trace summaries now process and present custom track groups registered using the extensibility API.
Chromium issues: 514721939, 490140054, 536954453, 535506117
Console: Export tables as Markdown or CSV and side-effect protection
- Copy console tables as Markdown or CSV: Tables logged using
console.table()can now be copied directly to your clipboard as formatted Markdown tables or CSV data from the context menu. - Side-effect evaluation protection: The debugger's hover evaluation now
guards against expressions containing
new, tagged template literals, dynamicimport(), anddeleteoperators, preventing accidental state mutations while paused.
Chromium issues: 40924951, 40133606
Other highlights
A collection of notable improvements across other DevTools subsystems:
- Sources: Quick Open now prioritizes local workspace files with a large scoring boost, making workspace files bubble to the top above network resources. (Chromium issue: 40260136)
- Memory: The Heap Snapshot Summary view now displays total object counts alongside aggregated shallow sizes for selected types, and includes native execution context filters. (Chromium issue: 497855658)
- Application: The Ads panel relocated the Highlight ads toggle directly into the panel, added clickable Ad iframe Element IDs to reveal frames in the hierarchy, and introduced a per-frame metrics breakdown table. (Chromium issue: 514957134)
- Application: Redesigned the Clear site data section in the Storage pane into a unified, consolidated group (Chromium issue: 375867286), and resolved duplicate Cache Storage entries after Back/Forward Cache restorations (Chromium issue: 484693244).
- Extensions: Async methods across
chrome.devtools.panelsnow natively return JavaScript Promises when called without a callback. (Chromium issue: 496604551) - Settings: Split default network throttling presets and custom throttling configurations into separate sections. (Chromium issue: 342409451)
- Lighthouse: Updated bundled Lighthouse module to version 13.4.1. (Chromium issue: 40543651)
- Issues: DevTools raises a warning when an image using
loading="lazy"lacks explicitwidthorheightdimensions. - Device mode: Simplified the zoom level menu with a unified Fit to window option and disabled the Show device frame toggle when frame graphics are unavailable.
Accessibility improvements
Chrome 152 includes the following accessibility enhancements:
- Elements & Accessibility: Added context menu options to switch seamlessly between the Elements DOM tree and the Accessibility Tree View, plus "Scroll into view" for accessibility nodes. (Chromium issues: 417929842)
- Accessibility: Added support for copying accessibility tree nodes and subtrees as plain text using the context menu. (Chromium issue: 417929842)
- Elements: Fixed low-contrast search highlight colors in the Elements panel when running in dark mode. (Chromium issue: 491718898)
- Navigation: Undocking DevTools into a separate window or re-docking back into the tab no longer forces focus onto the main menu button.
- Settings: Added descriptive accessible context to "Show More" and "Show Less" buttons in AI settings.