

Published: November 13, 2026
Welcome to the December 2026 edition of New in DevTools! Everything that rolled out to Chrome Stable during November in Chrome 157 and Chrome 158 is now available in your browser. Highlights from this cycle include logpoints, virtual WebAuthn authenticators, live configuration reloading, and offline heap snapshot analysis in the Chrome DevTools MCP server, multi-category and agentic-browsing Lighthouse audits in AI assistance, :buffering and :stalled state forcing and a position-try-fallbacks swatch in the Elements panel, original variable and function names in the Scope view, stack traces, and expression evaluation powered by ECMA-426 source map scopes in Sources, and Sub apps inspection in the Application panel.
DevTools for agents
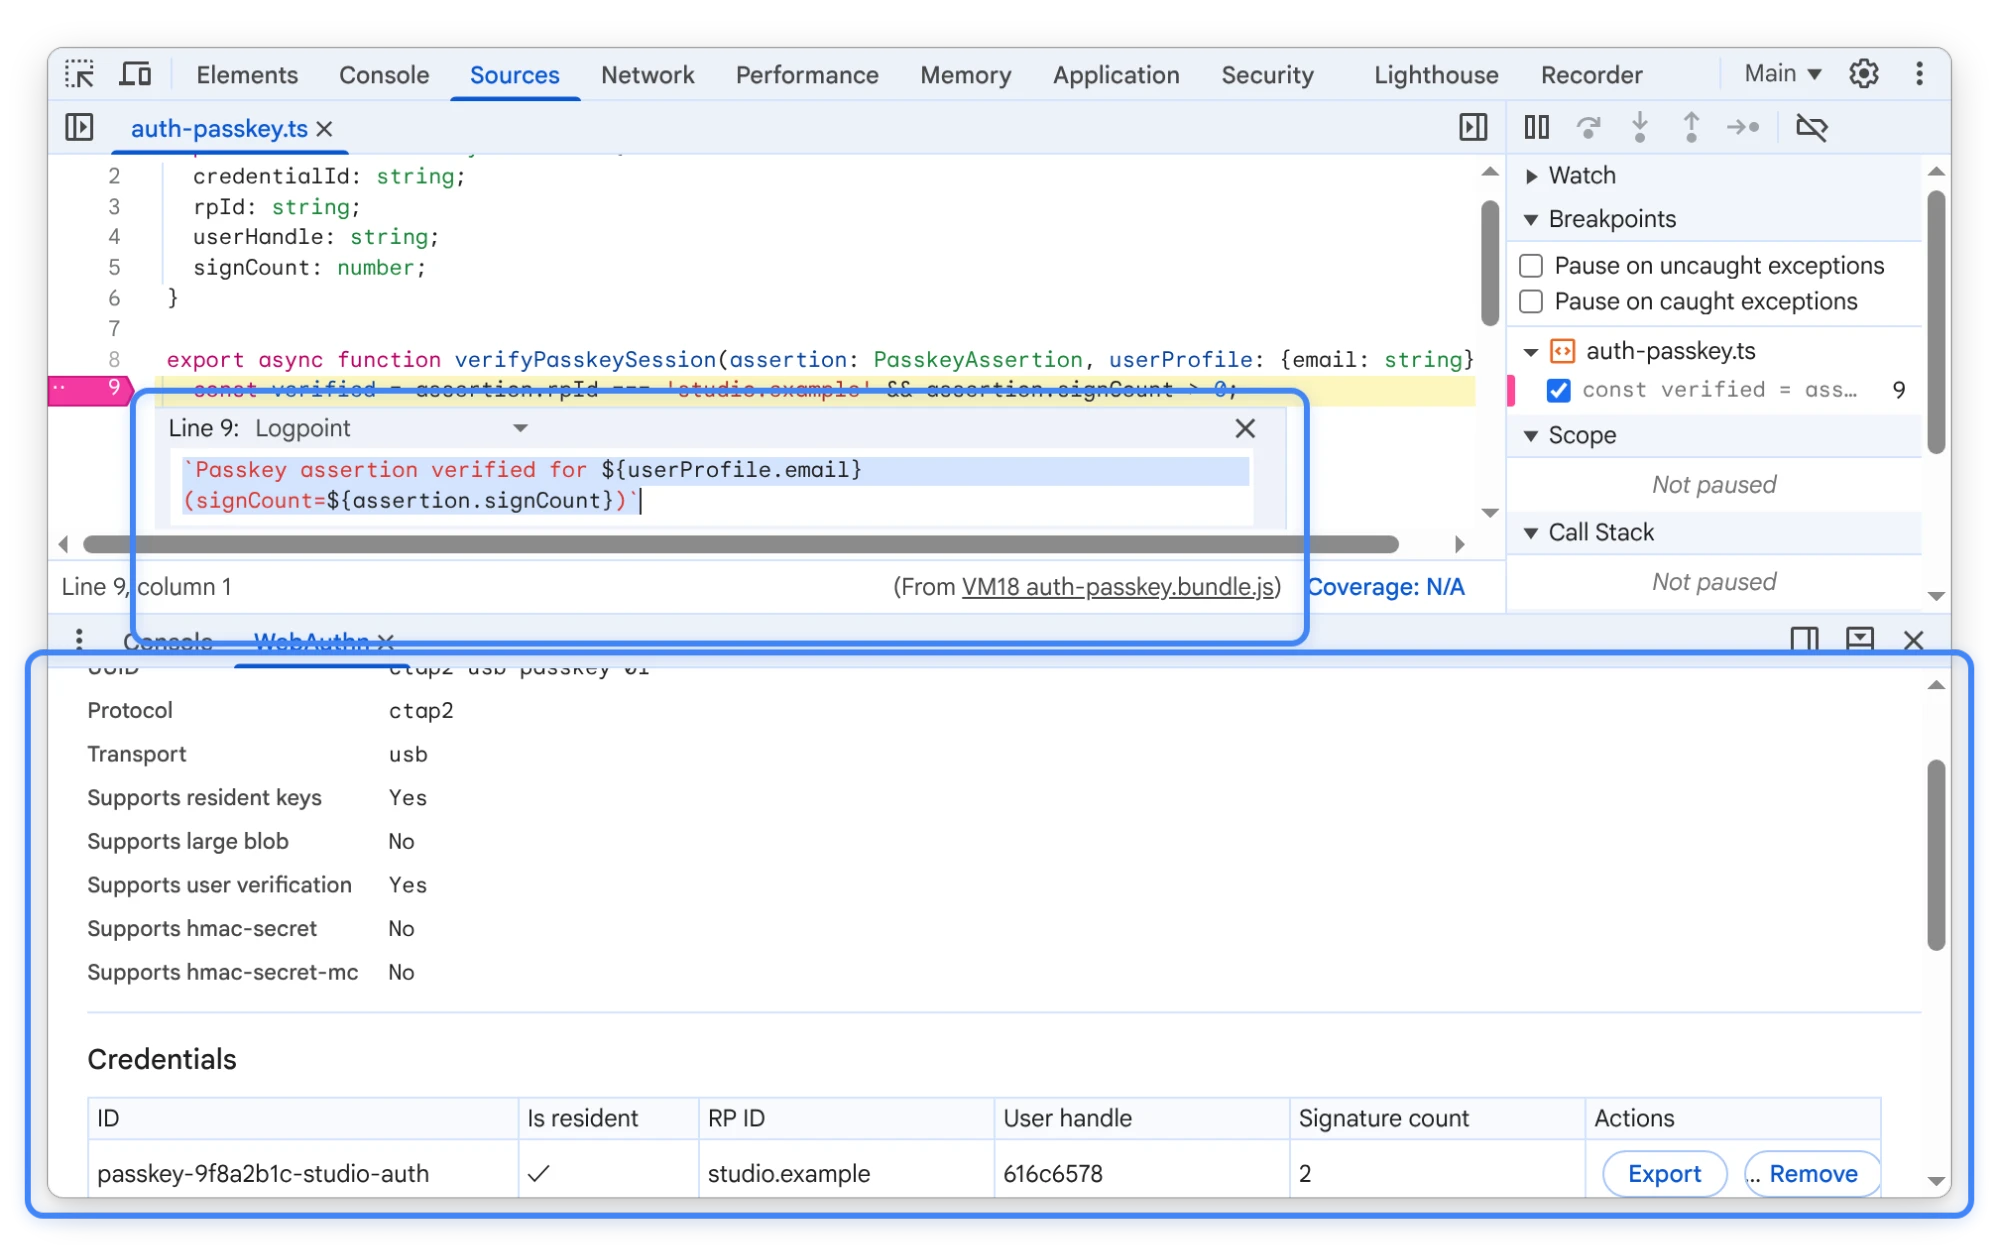
Releases v1.11.0 through v1.13.0 of the Chrome DevTools MCP server introduce logpoint debugging, virtual WebAuthn authenticators, live configuration reloading, offline heap snapshot analysis, and parallel tool execution:
- Logpoints (
set_logpoints) and virtual WebAuthn authenticators (configure_webauthn): Inject logpoints (set_logpoints) at served script URLs or source-mapped file paths to log expressions using original variable names directly tolist_console_messageswithout pausing execution, and configure virtualctap2oru2fauthenticators (configure_webauthn) to test passkey and security key flows. - Live configuration reloading and automatic discovery: Pass
--watchConfigto watch and hot-reload configuration file changes—includingblockedUrlPatternandallowedUrlPatternrules—without restarting the server, or let the server automatically discover configuration files in standard workspace locations. - Offline and paginated heap snapshot analysis: Analyze
.heapsnapshotfiles without an active browser connection, inspect memory retained by V8 execution contexts withanalyze_heapsnapshot_contexts, and paginate heap snapshot queries andcompare_heapsnapshotsdiffs by default with class objects sorted by self size. - Parallel tool execution and browser-powered screencasts: Run independent tool calls and page-scoped tools across different pages in parallel, and record browser-powered screencasts at device pixel resolution by default without requiring external dependencies.
- Inline Lighthouse failures, uncached traces, and local script evaluation: Receive failing audits and affected DOM nodes inline from
lighthouse_audit, passignoreCachetoperformance_start_trace, evaluate scripts directly from local files, match only visible text inwait_for, and debug WebMCP tools exposed in third-party developer tools.
Learn more in the chrome-devtools-mcp repository.
Chromium issues: 497855658
AI innovations
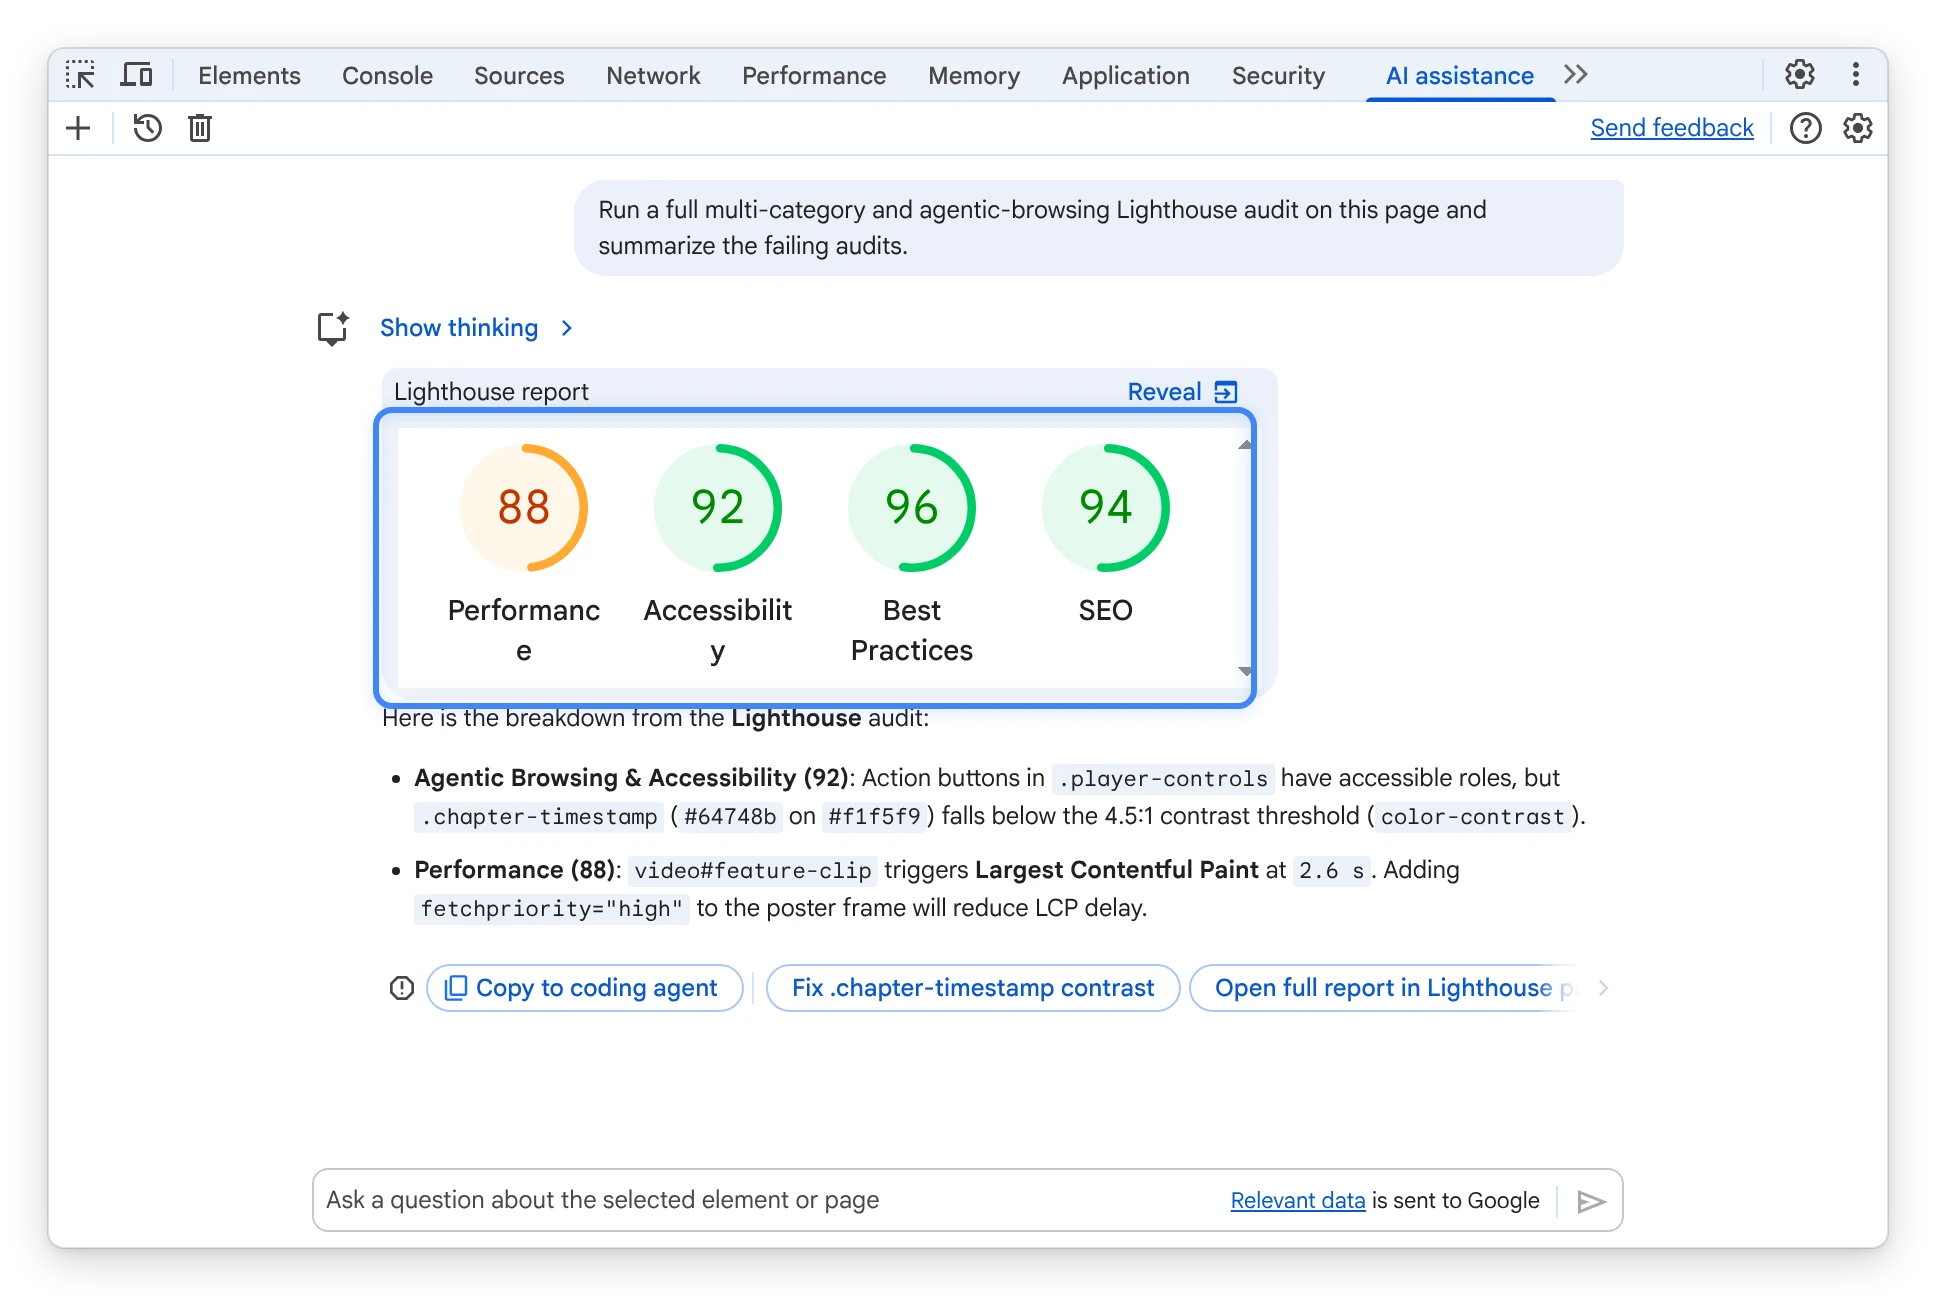
You can now ask AI assistance to run full multi-category (all) Lighthouse reports across performance, accessibility, best practices, and SEO, as well as agentic-browsing audits on request. AI assistance also receives a structured summary of failing audit titles and scores directly in the report context so it can interpret and explain Lighthouse findings more accurately, and single-category reports now render score gauges inline.
Chromium issues: 530875864
Elements: Force :buffering and :stalled, position-try-fallbacks swatch, and CSS cascade fixes
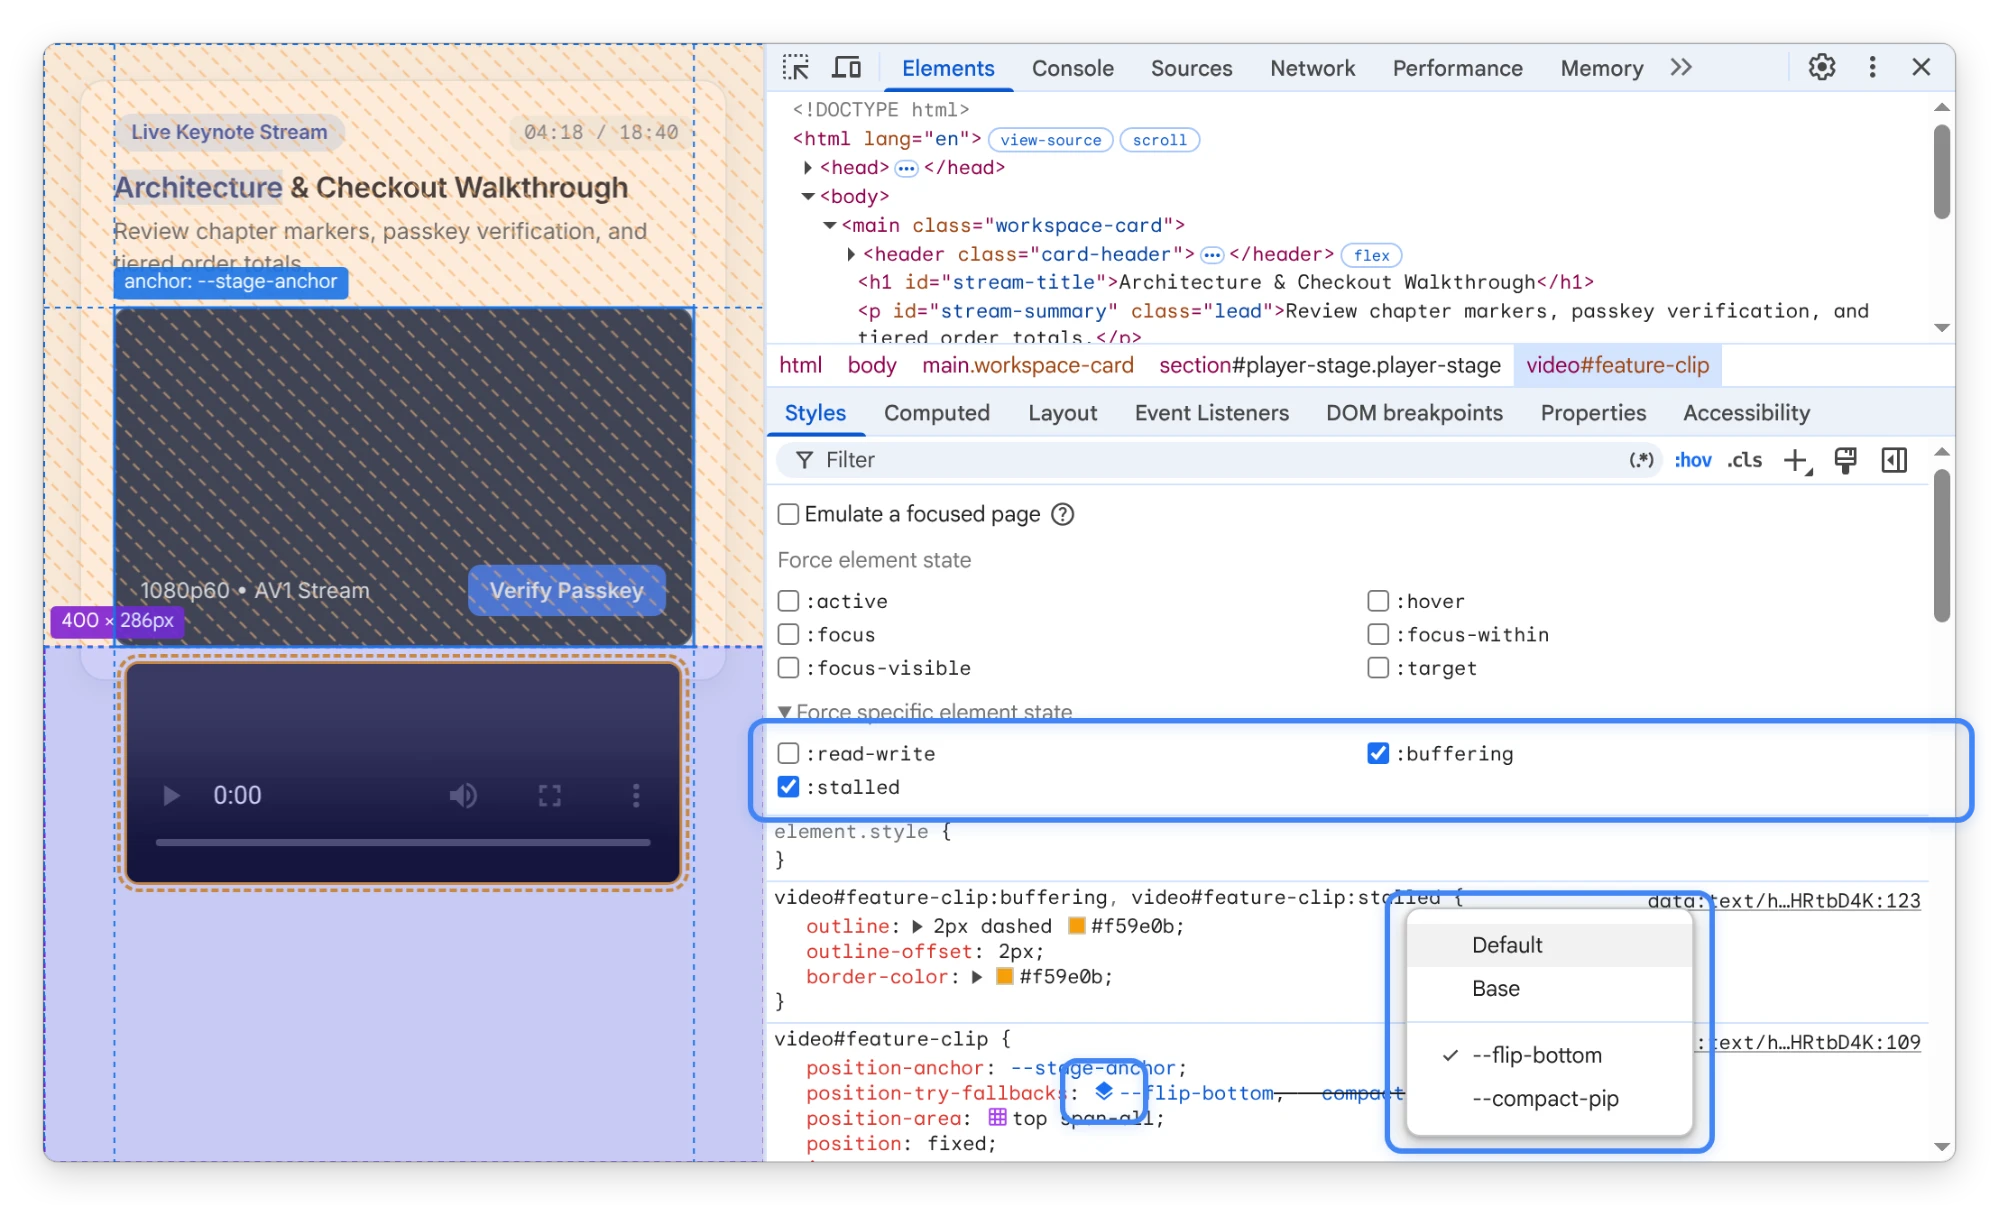
The Elements panel adds new forceable media pseudo-classes, interactive CSS anchor positioning controls, and cascade accuracy improvements:
- Force
:bufferingand:stalledmedia states: You can now force:bufferingand:stalledpseudo-classes on<video>and<audio>elements from the :hov (Toggle Element State) pane to test loading and playback fallback styles without throttling network conditions. position-try-fallbacksswatch,position-areaalignment, and IMCB overlay: Declarations forposition-try-fallbacksnow include an interactive swatch that opens a context menu to force individual fallback options on the anchored element. In addition, theposition-areavisual editor now configuresjustify-selfandalign-selfalignment values, and hovering over positioning properties or DOM nodes highlights the inset-modified containing block (IMCB) in the viewport overlay.- Universal custom highlight selector (
::highlight(*)): The Styles tab now recognizes and displays rules matching the universal custom highlight pseudo-element selector::highlight(*). - Accurate
@layerand origin priority for!importantdeclarations: The Styles tab now respects CSS cascade layer (@layer) and origin order when determining which!importantdeclaration takes precedence.
Chromium issues: 40246121, 407678278, 553335561, 413061413, 573299994, 40225557
Sources: Original scopes view, stack traces, and expression evaluation with ECMA-426 source map scopes
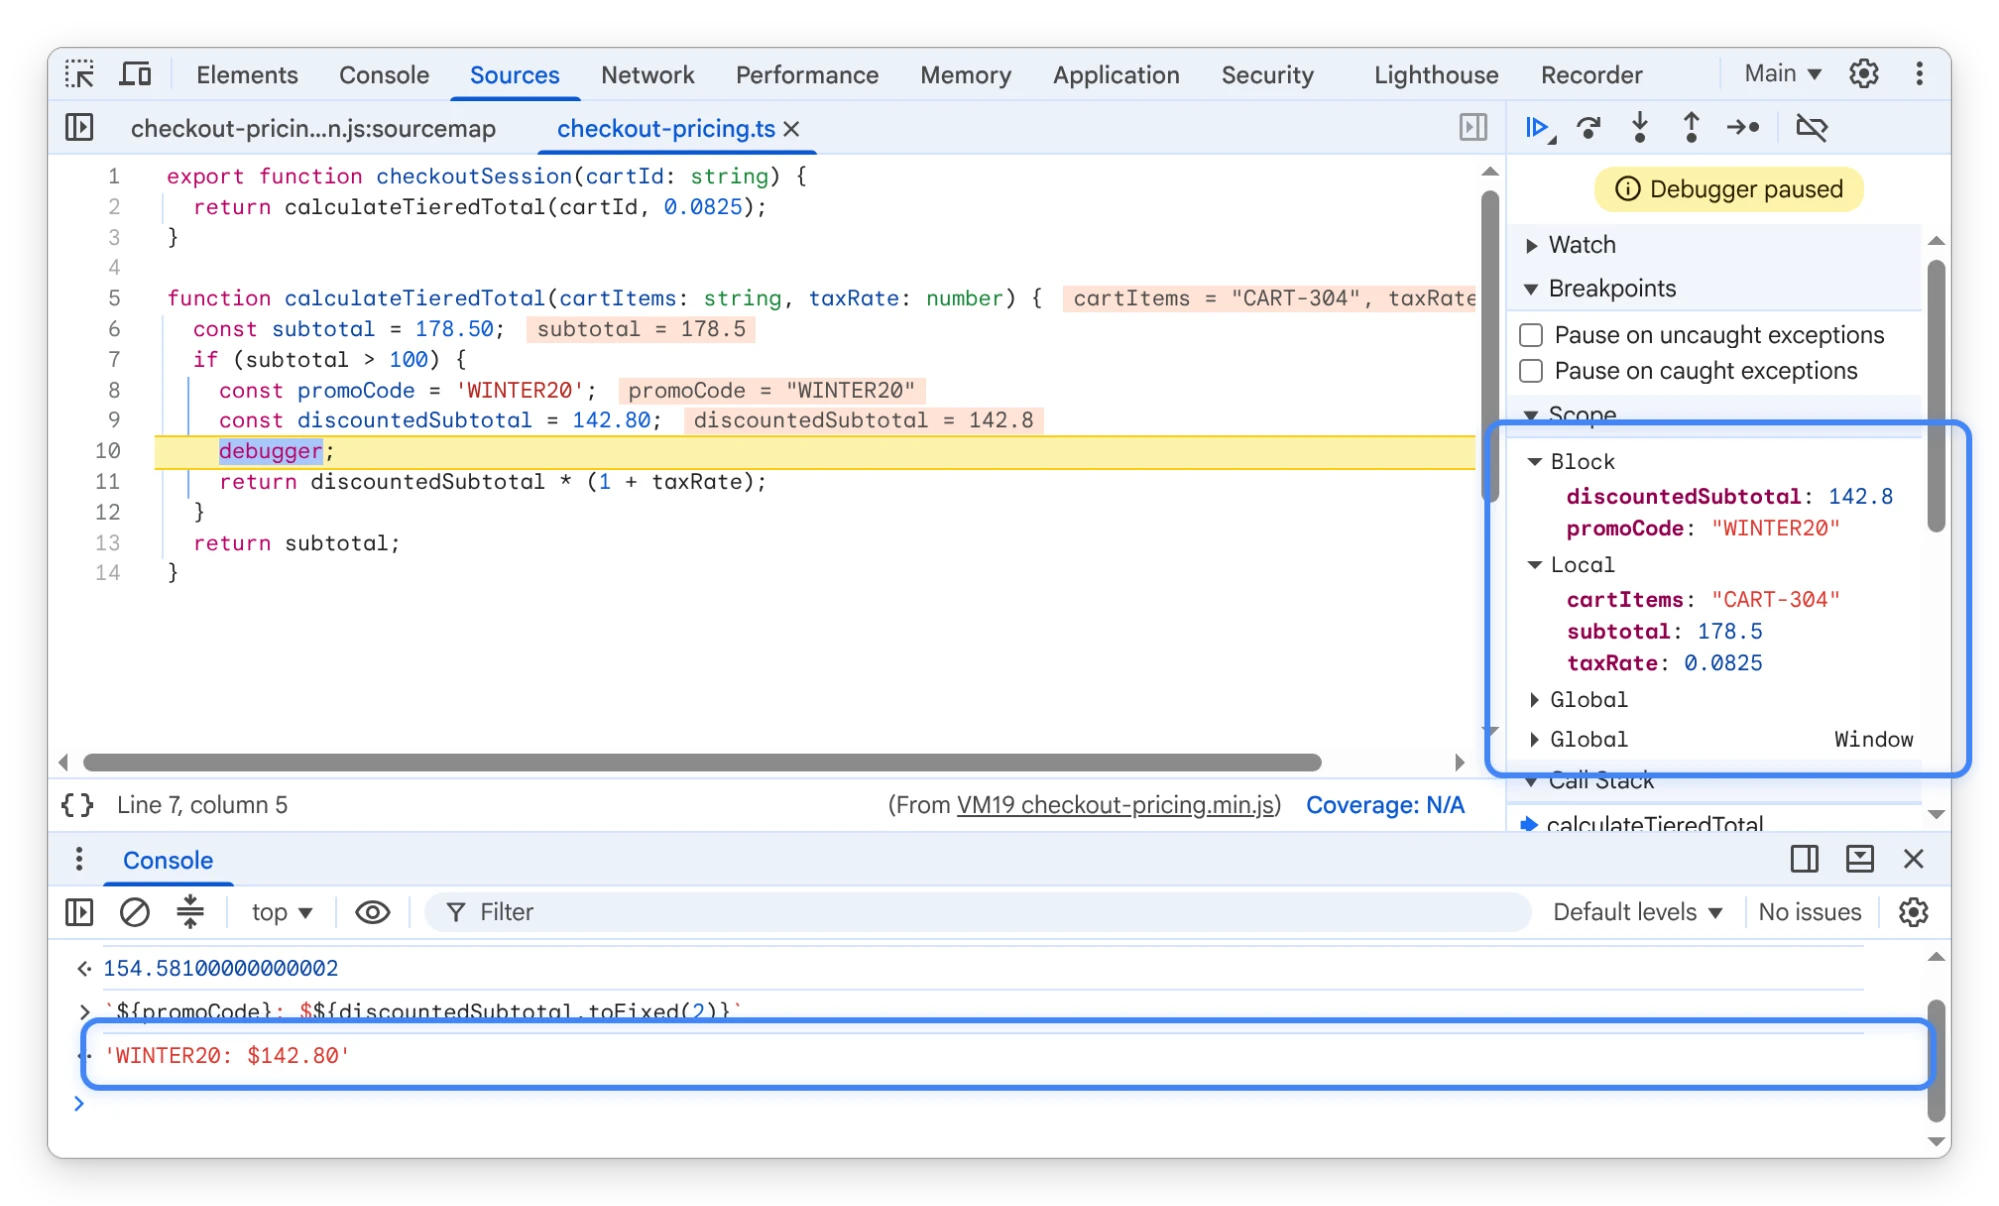
DevTools now supports the ECMA-426 source map scopes proposal, bringing original variable and function names from your authored files into the Scope view, stack traces, and expression evaluation:
- Original scope tree in the Scope view: When paused in the debugger, the Scope pane reconstructs the original lexical scope tree of your authored source file and displays original variable names and values—without dimming—instead of minified bundle identifiers.
- Translated stack traces and logical stepping across DevTools: Stack traces throughout DevTools resolve original function names, merge outlined helper frames back into their logical callers, and filter out compiler-generated helper frames. In addition, Step, Step over, and Step out use source map scopes to step logically over and out of inlined and outlined functions.
- Expression evaluation and autocomplete with original variable names: You can evaluate expressions in the Console, Watch Expressions, and conditional breakpoints or logpoints using original authored variable names, supported by source map scope completions in the code and breakpoint editors.
Chromium issues: 40277685
Application: Sub apps inspection, custom spellcheck dictionaries, and storage updates
The Application and Issues panels add dedicated views for multi-app web installations, custom spellcheck dictionaries, and site storage:
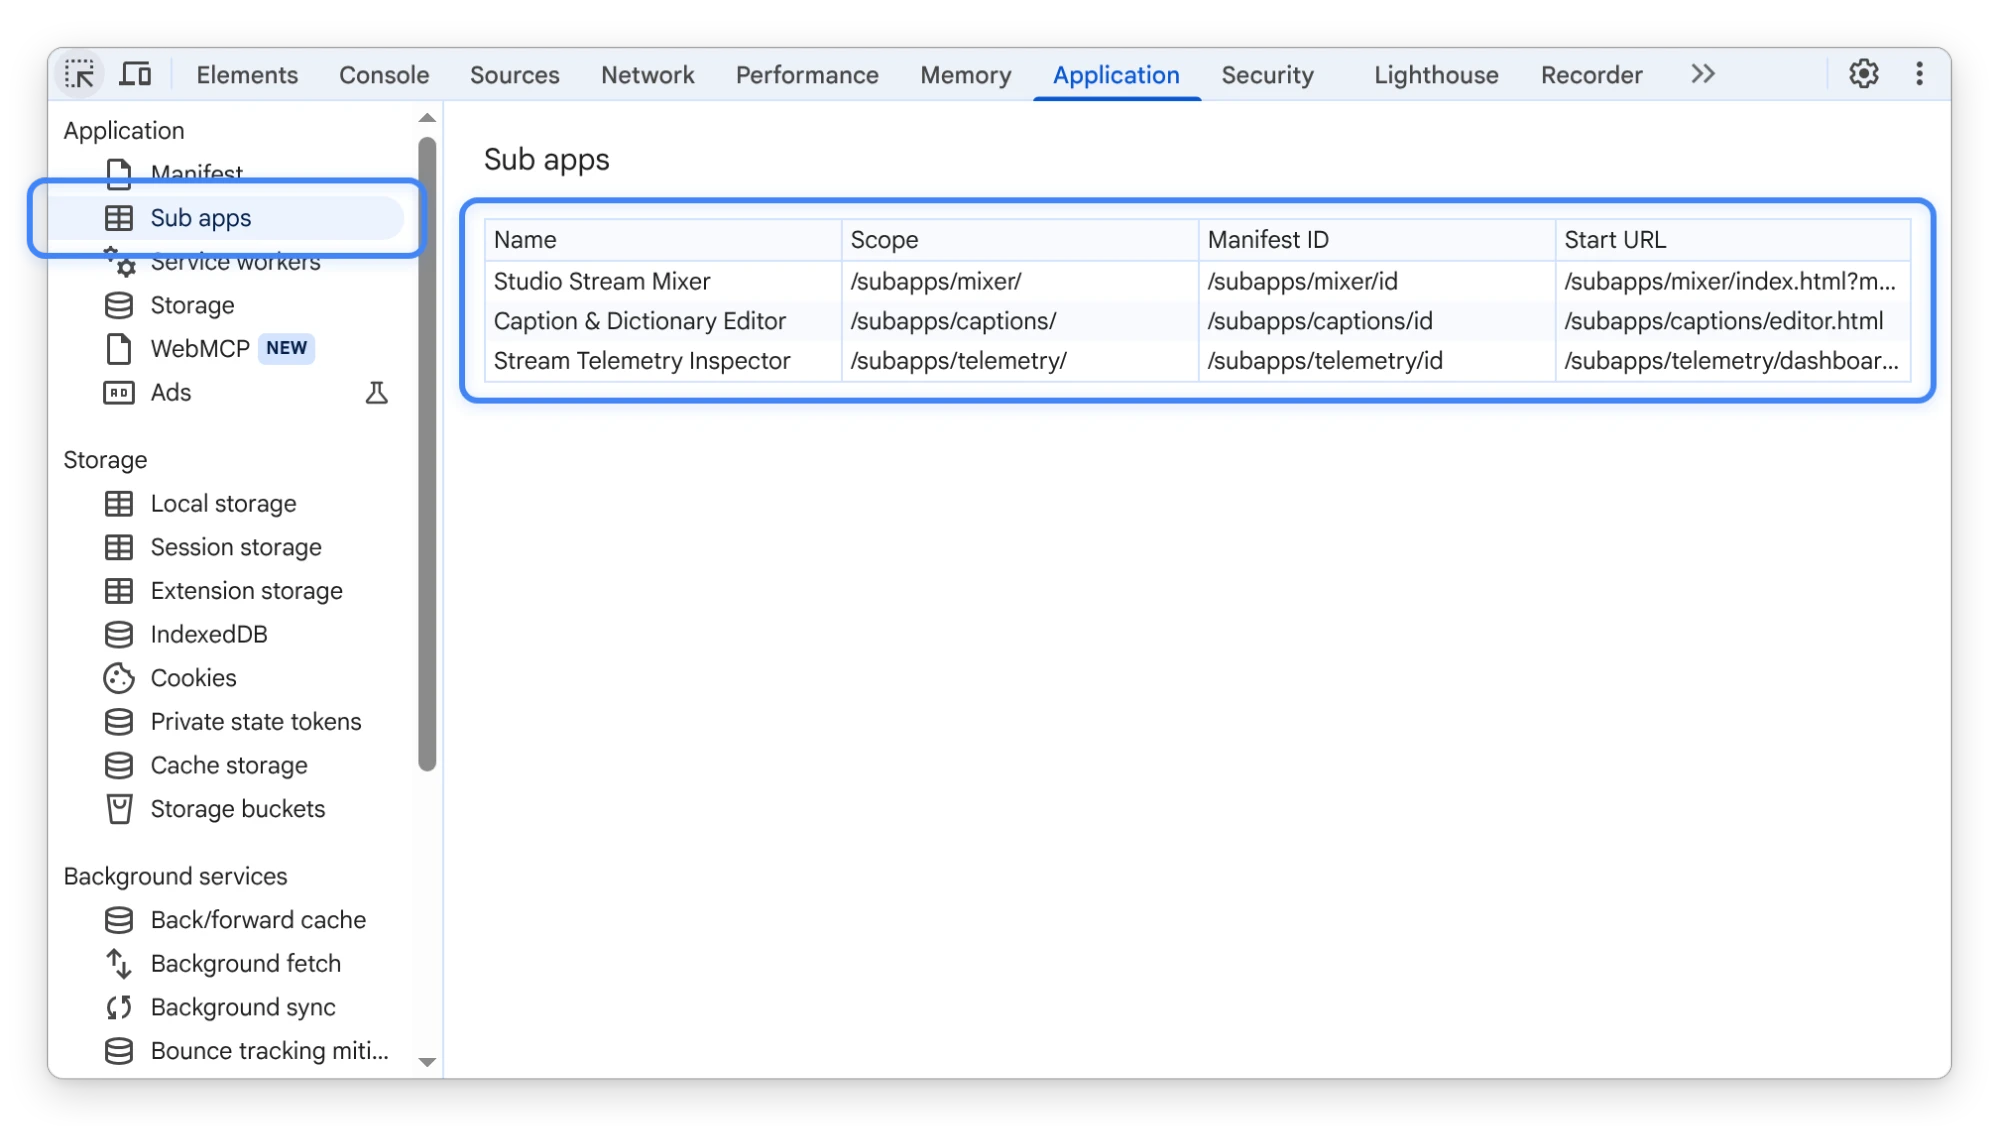
- Sub apps inspection and Isolated Web App identity: A new Sub apps node under the Application section displays Sub apps and Sibling sub apps in structured data grids, while Manifest > Identity surfaces the Bundle ID (for Isolated Web Apps) and Parent app name.
- Spellcheck custom dictionary inspection: Selecting a frame in the Frames tree now displays a Spell check custom dictionary section whenever custom spellcheck entries are registered for that document.
- File System site data clearing, reliable storage keys, and geolocation issues: Clicking Clear site data in the Storage view now clears File System storage alongside other storage buckets, Local Storage and Session Storage re-fetch storage keys reliably once a frame finishes loading, the Issues panel flags
geolocationpermission requests made without a user gesture, and the Ads panel clarifies primary display ad versus ad-related DOM highlighting.
Chromium issues: 428005649, 40227285, 570961818, 569300366, 514957134
Performance and Memory: Faster trace parsing, Lantern HTTP/3 simulation, and generator context analysis
The Performance and Memory panels reduce trace parsing overhead, improve Lantern network simulation accuracy, and refine heap snapshot retention analysis:
- Faster trace parsing and reduced memory usage: A series of trace engine optimizations improves trace parsing speed by roughly 26% on large traces while reducing peak memory usage, alongside flame chart canvas redraw optimizations and deduplicated script sizes in Treemap.
- Lantern HTTP/2, HTTP/3, and ES module simulation: The Lantern simulation engine now resets HTTP/2 overflow bytes across sequential requests, treats HTTP/3 connections as multiplexed in
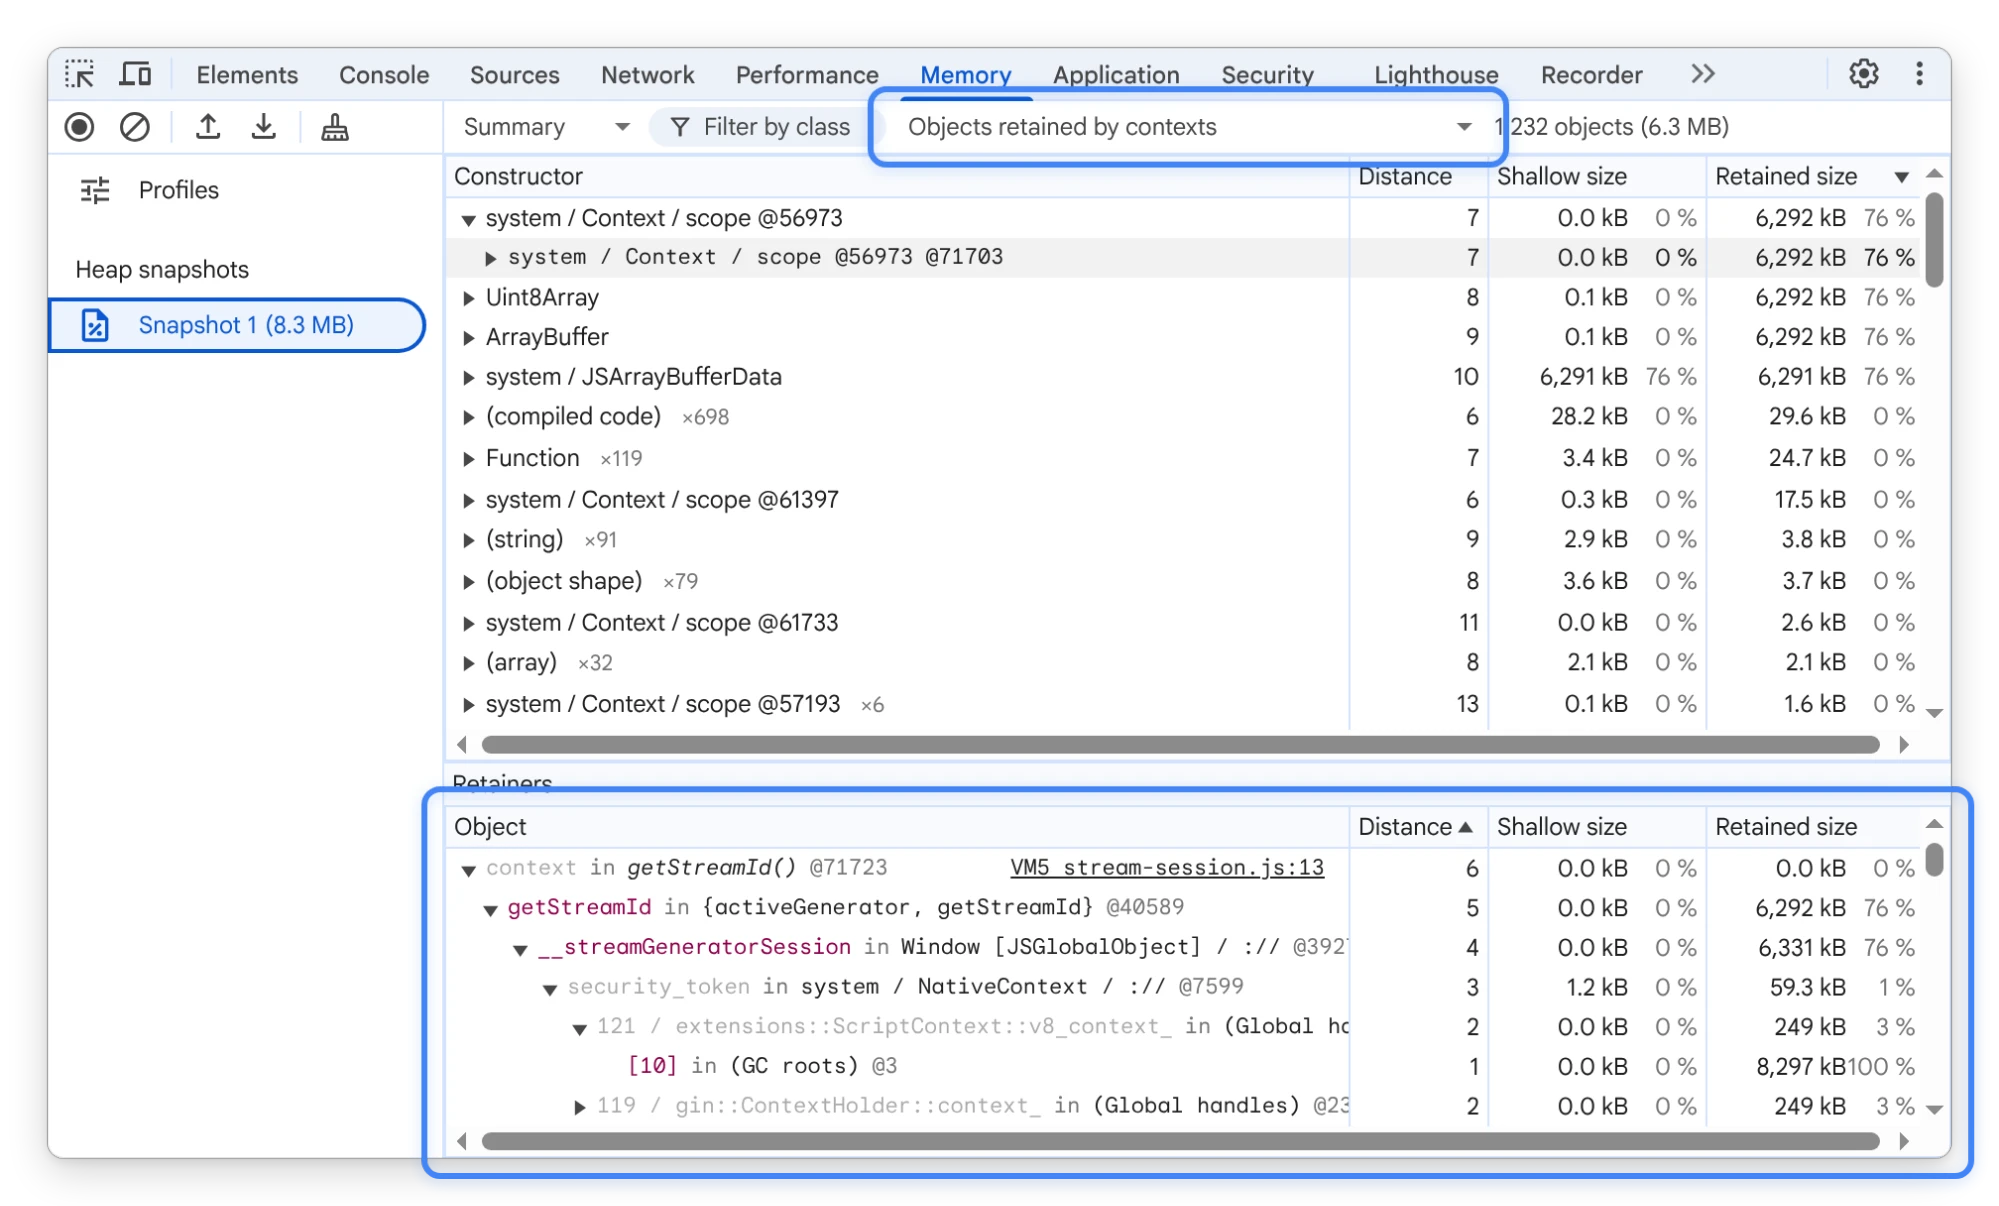
ConnectionPool, and accounts for ES module compilation and evaluation trace events. - Heap snapshot context analysis for generators, async functions, and ES modules: Dead context field analysis in the Memory panel now recognizes suspended generators and async functions as live closures, ignores top-level functions of finished ES modules, attributes
ScopeInfosto their parent scripts for uncompiled functions, and scopes live heap timeline statistics strictly to the active recording view.
Chromium issues: 553831653, 570004155, 568836981, 497855658
Other highlights
These additional improvements landed across DevTools in Chrome 157 and Chrome 158:
- Network: The Messages tab for WebSocket connections now calculates accurate UTF-8 byte lengths for non-ASCII text frames, network search checks cached response bodies locally before querying the backend, Copy value on request payload parameters matches the displayed value, and Show more appears only when payload text is truncated.
- Console: Selecting and copying text from a console message now copies only the visible text—excluding collapsed stack traces—while preserving expandable object previews, and long error-like strings no longer render as
[object Object]. - Device Mode and Screenshots: Capturing a device screenshot now copies the image directly to your clipboard with a confirmation notification in addition to downloading the file, Fit to window zoom selects the maximum fitting percentage, and explicit device scale adjustments persist across page reloads.
Chromium issues: 573812521, 555055603, 567556613, 566160225, 553616262, 566267314, 40065190, 515328619
Accessibility improvements
Chrome 157 and Chrome 158 include the following accessibility improvements across DevTools:
- Accessibility live announcements: Clicking an
ariaNotifyannouncement in the Accessibility live announcements table now navigates directly to its JavaScript call site in the Sources panel. You can also right-click an announcement row to reveal its associated node in the Elements panel or Accessibility tree, and resize the live announcements pane with a draggable splitter. - Keyboard focus indicators: Improved keyboard focus outline contrast across Quick Open results, data grid headers, and toolbar drop-down menus.
- Screen reader semantics in Settings, Application, and Recorder: Added
comboboxautocomplete semantics to text prompts for VoiceOver, provided an accessible name for the Settings dialog, exposed expandable button semantics on Service Workers update timing rows, and improved step selection focus and code view landmarks in the Recorder panel.
Chromium issues: 527462118, 568010579, 570465256, 565632631, 557063498, 556764892