


Published: April 27, 2026
LY Corporation, one of Japan's largest internet service providers, manages a vast array of web platforms including search, news, and shopping. Maintaining high performance across these diverse services is critical for user engagement and business success. However, the team faced challenges in scaling performance analysis across multiple services.
This case study explores how LY Corporation used Chrome DevTools for agents to build an automated AI-based performance auditing system. By creating a programmatic bridge to the browser, they were able to automate data collection, connect performance metrics to business impact, and empower every development team to optimize their services effectively.
The challenge: The bottleneck of manual auditing
Previously, a performance audit at LY Corporation was a highly manual task requiring specialized expertise. An engineer had to:
- Manually navigate multiple tools like CrUX or PageSpeed Insights to gather field data.
- Run a local instance of Lighthouse traces to collect lab data.
- Cross-reference performance metrics with separate internal business dashboards.
- Synthesize all this fragmented data into a single, actionable report.
This process was slow and concentrated critical knowledge within a small group of specialists, which limited efficiency. This complexity made it difficult to provide consistent, high-quality performance audits for every service across the company, often leading to delayed insights and missed optimization opportunities.
The solution: Capturing browser performance metrics with Chrome DevTools for agents
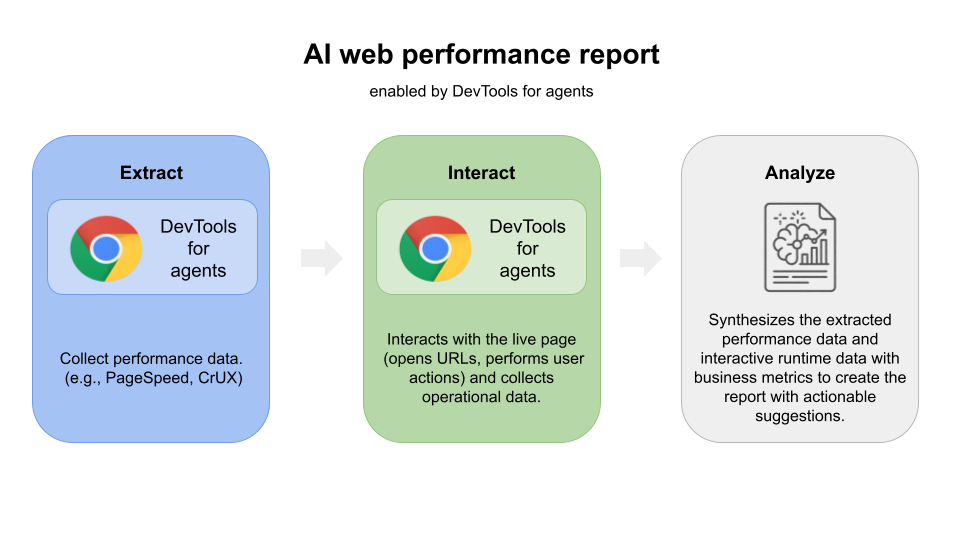
LY Corporation built an internal tool that uses Chrome DevTools for agents as a bridge. This lets their AI agent:
- Extract: Pull real-time network and performance data directly from DevTools such as Largest Contentful Paint (LCP), asset metadata, network request logs or transfer size.
- Interact: Open URLs of targeted services and perform user actions such as click and hold the pointer over to trigger interactive metrics like Interaction to Next Paint (INP) or Cumulative Layout Shift (CLS).
- Analyze: Join this runtime data with historical field data (CrUX) to generate a prioritized issue list.
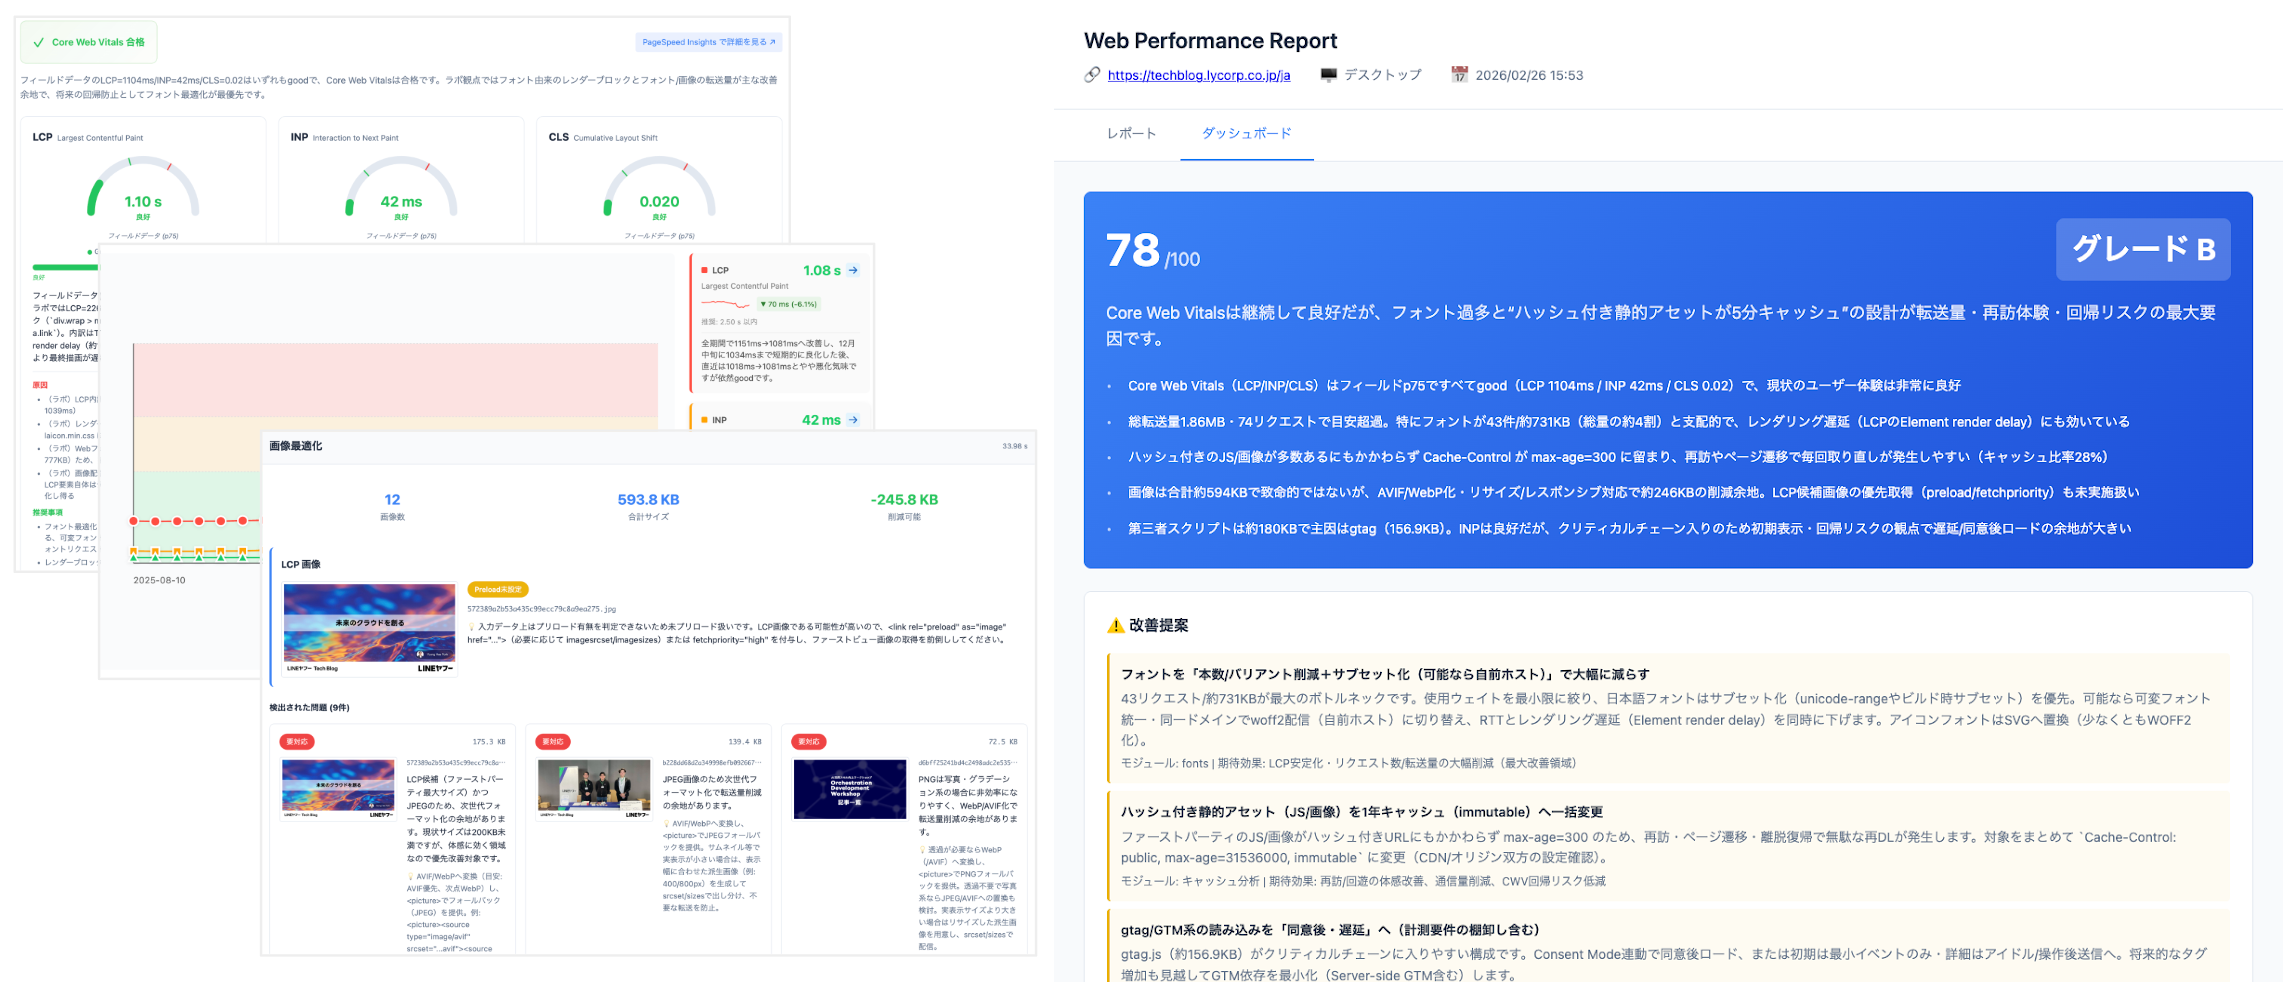
This internal tool lets developers enter a web application URL to generate a full performance audit on a page, turning expert knowledge into an on-demand service. The tool operates as a modular, scenario-based analysis tool. It generates a prioritized improvement list and suggestions to guide developers on where to start.
The impact: From manual checks to automated fix suggestions
By offloading the manual effort of data collection and report formatting to an AI agent using Chrome DevTools for agents, LY Corporation achieved significant results:
- Drastic efficiency gains: This new process reduces manual analysis by 96-98% and reclaims 8.3 hours of developer time per month for the central analysis team.
- Democratization of expertise: Every product team now can generate high-quality performance reports independently, ensuring a consistent standard of analysis that only experts previously offered.
- Actionable business insights: Teams prioritize the most impactful fixes by connecting performance data to business metrics, which facilitates faster approval for projects.
Future plans
LY Corporation continues to enhance the capabilities of its AI performance tools. The team is integrating performance improvements with specific business KPIs to provide detailed insights into user retention and revenue growth.
Conclusion
While Chrome DevTools for agents is not a standalone solution, it provided the essential technical foundation for LY Corporation to build its specialized reporting tool. By using Chrome DevTools for agents, developers can move beyond manual browser checks and build their own custom tools by gathering live data directly from the browser runtime.