Published: December 12, 2025, Last updated: January 16, 2026
Use the Request conditions tab to block specific URLs or apply custom network throttling profiles to individual resources.
Overview
Previously, Chrome DevTools allowed you to throttle network conditions globally for the entire session (affecting all requests) or block specific requests entirely. However, testing how your application handles specific slow resources, such as a third-party API struggling with latency or a large hero image loading on a slow connection, was difficult without slowing down the entire page.
Starting with Chrome 145, DevTools now supports Individual Request Throttling. You can pick individual network requests to apply specific network conditions to, alongside the existing capability to block them. This feature moves the capabilities formerly found in the "Network request blocking" drawer into a new, more comprehensive Request conditions drawer. This feature is more precise and allows debugging faster, by slowing down only requested resources and not the whole site.
Throttle or block a request
To block or throttle a specific resource, right-click any request in the Network panel and select Block request or Throttle request for either the exact URL or the entire domain. This action automatically opens the Request conditions drawer, creates a new rule for the entry, and immediately applies the selected network constraints.
Request conditions drawer
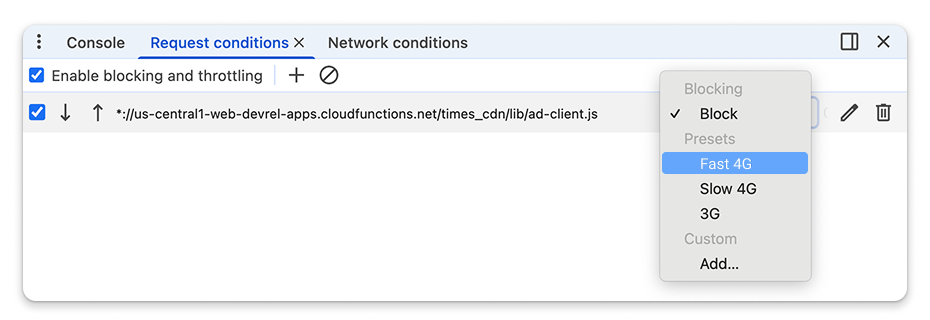
In the new Request conditions drawer, you can control which requests are affected and how much to slow them down.

You can customize throttling settings by selecting standard presets (like Slow 3G) or your own custom profiles, and edit URL patterns using wildcards (*) to apply these conditions to specific dynamic resources or groups of requests.
If a request matches multiple patterns, DevTools applies the first rule found. You can control this precedence by using the arrow buttons in the drawer to move high priority rules to the top of the list.
Understand which requests are throttled or blocked
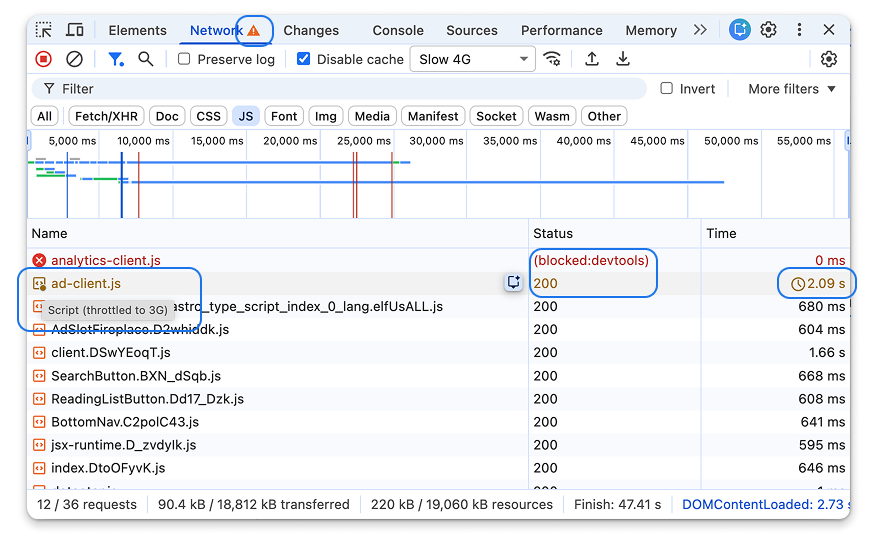
It's essential to distinguish between requests that are naturally slow and those that are being artificially throttled by DevTools. When you reload the page the new throttling rules get applied. You can easily spot the affected requests in the Network panel:
- Blocked requests show in red and the status is
(blocked:devtools)in the Status column. - Throttled requests show in yellow or gold and have a clock icon in the Time column. You can hover over the icon to see exactly which network condition is applied. This is also visible on the Timings sub-panel.

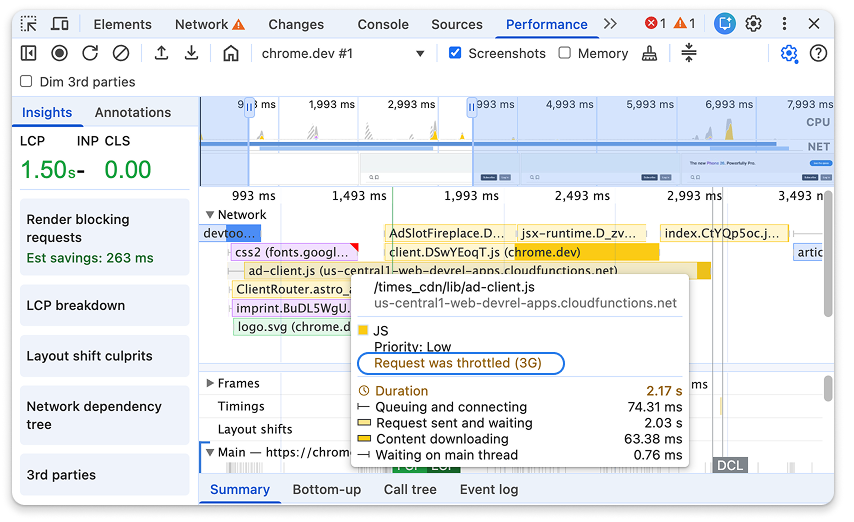
Throttling requests can influence the page's performance. When recording a performance profile, you can hover over the request in the Network track to view a tooltip detailing the applied network conditions.

