
CrUX Vis is a dashboard that visualizes the weekly historical data from the CrUX History API.
Access CrUX Vis
To launch CrUX Vis, visit cruxvis.withgoogle.com, or enter an origin or URL, and press enter or click Go:
The CrUX Vis URL can then be shared and bookmarked for quick reference.
Does it work for all websites?
No. If your origin is not included in the CrUX dataset, there will be no data to display. There are over 15 million origins in the dataset, but the one you want may not have sufficient data to be included.
Some common issues with origins are providing the wrong protocol, for example http:// instead of https://, and omitting the subdomain when needed. Some websites include redirects, so if http://example.com redirects to https://www.example.com, then you should use the latter, which is the canonical version of the origin.
Similarly, URL-level data may not be available even when origin-level data is available.
CrUX Vis overview
CrUX Vis has 5 pages:
- Core Web Vitals
- Loading Performance
- Interactivity
- Visual Stability
- All Metrics
Each page includes a chart showing distributions over time for the past 40 weeks (where daya is available).
The weekly data is updated every Monday and each data point includes the previous 28-days worth of data. This means the data is overlapping.
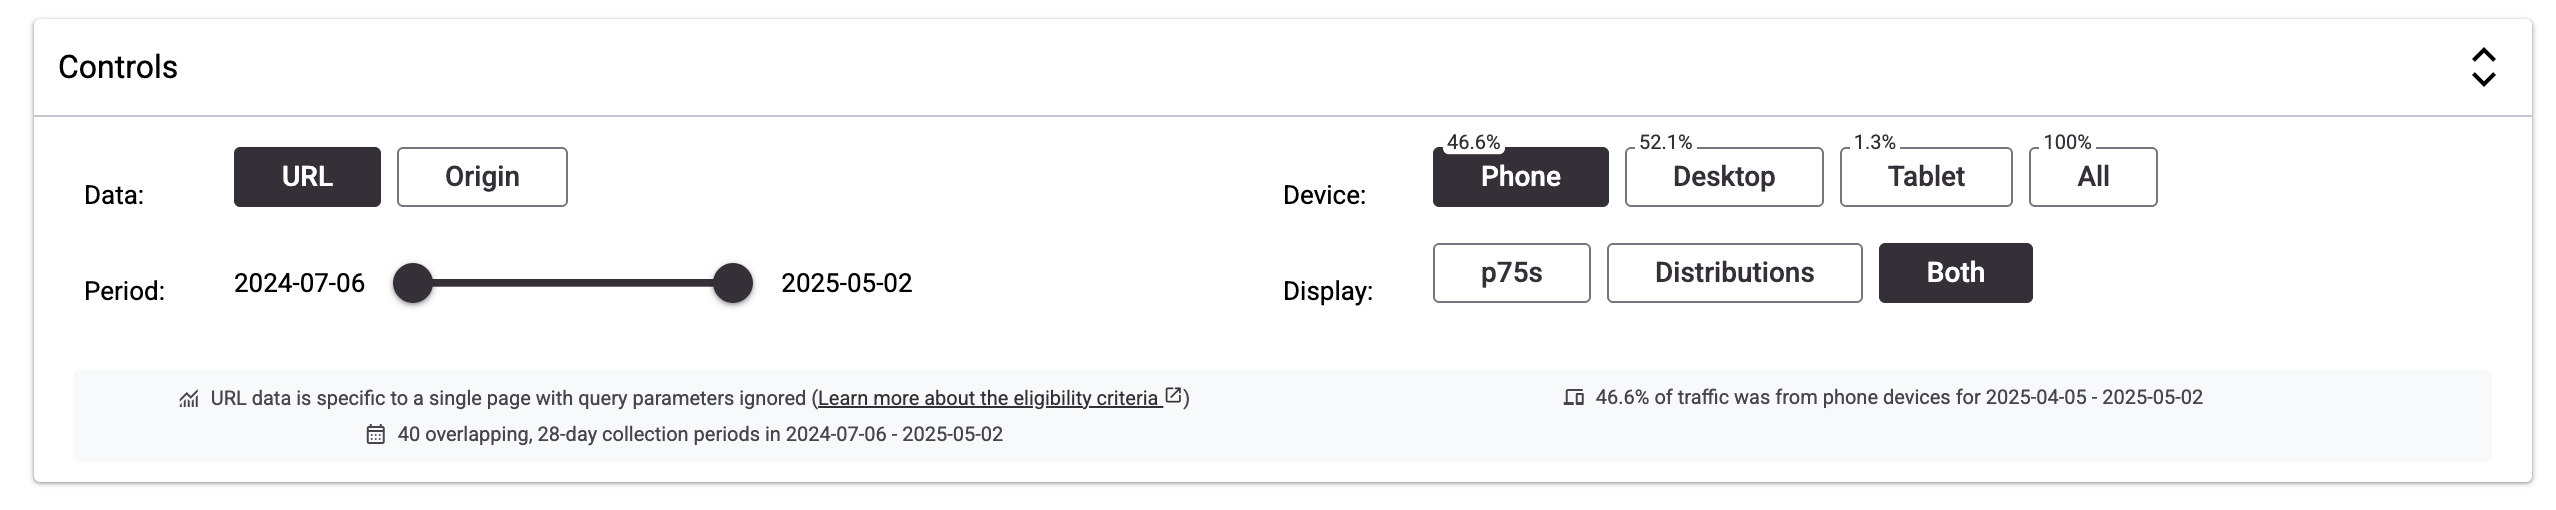
Controls
Each page has a Controls section which lets you switch:
- Date: Origin and URL-level data
- Device: Phone, Desktop, Tablet, or all Data
- Time periods
- Display: 75th percentile, distributions, or both
Core Web Vitals
The first page is an overview of the URL or origin's Core Web Vitals performance. These are the most important UX metrics that Google recommends you focus on.
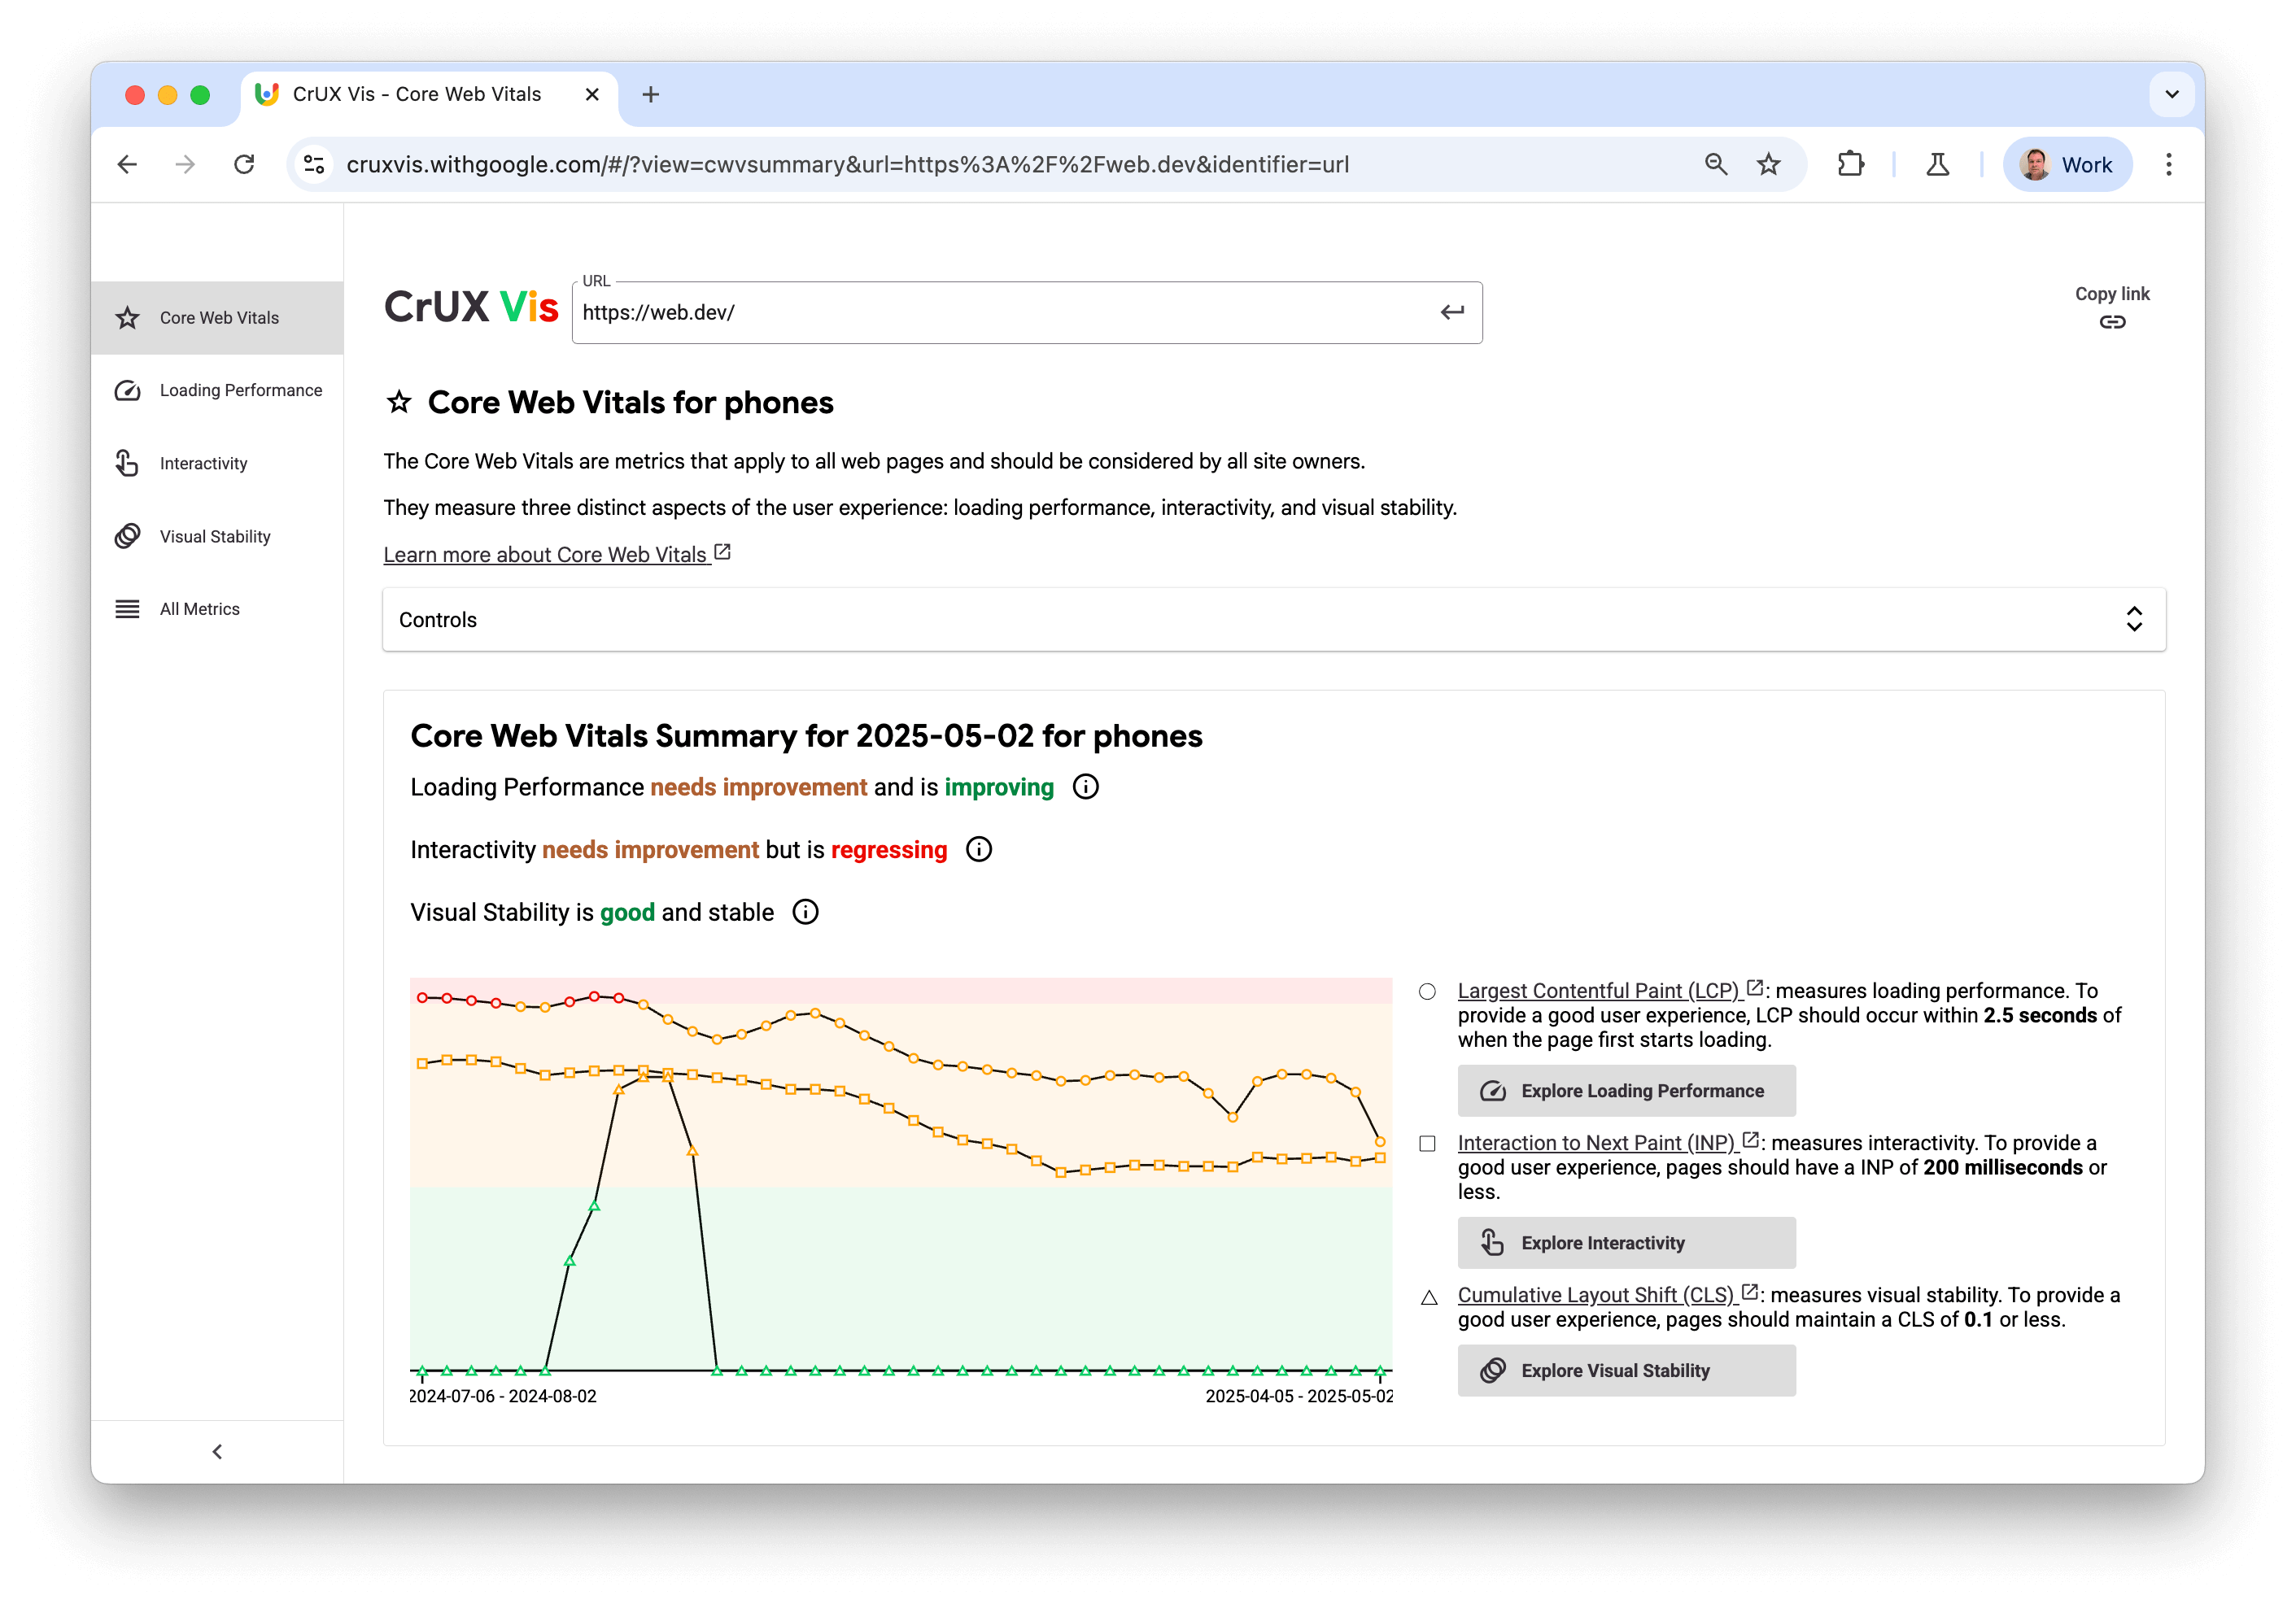
Use the Core Web Vitals page to understand how the URL or origin is experienced by users and which metrics need work, either because they are under recommended limits, or because they are regressing.
The page includes links to the next three sections to explore further.
Loading Performance
The Loading Performance pages includes all loading-related metrics in CrUX History API.
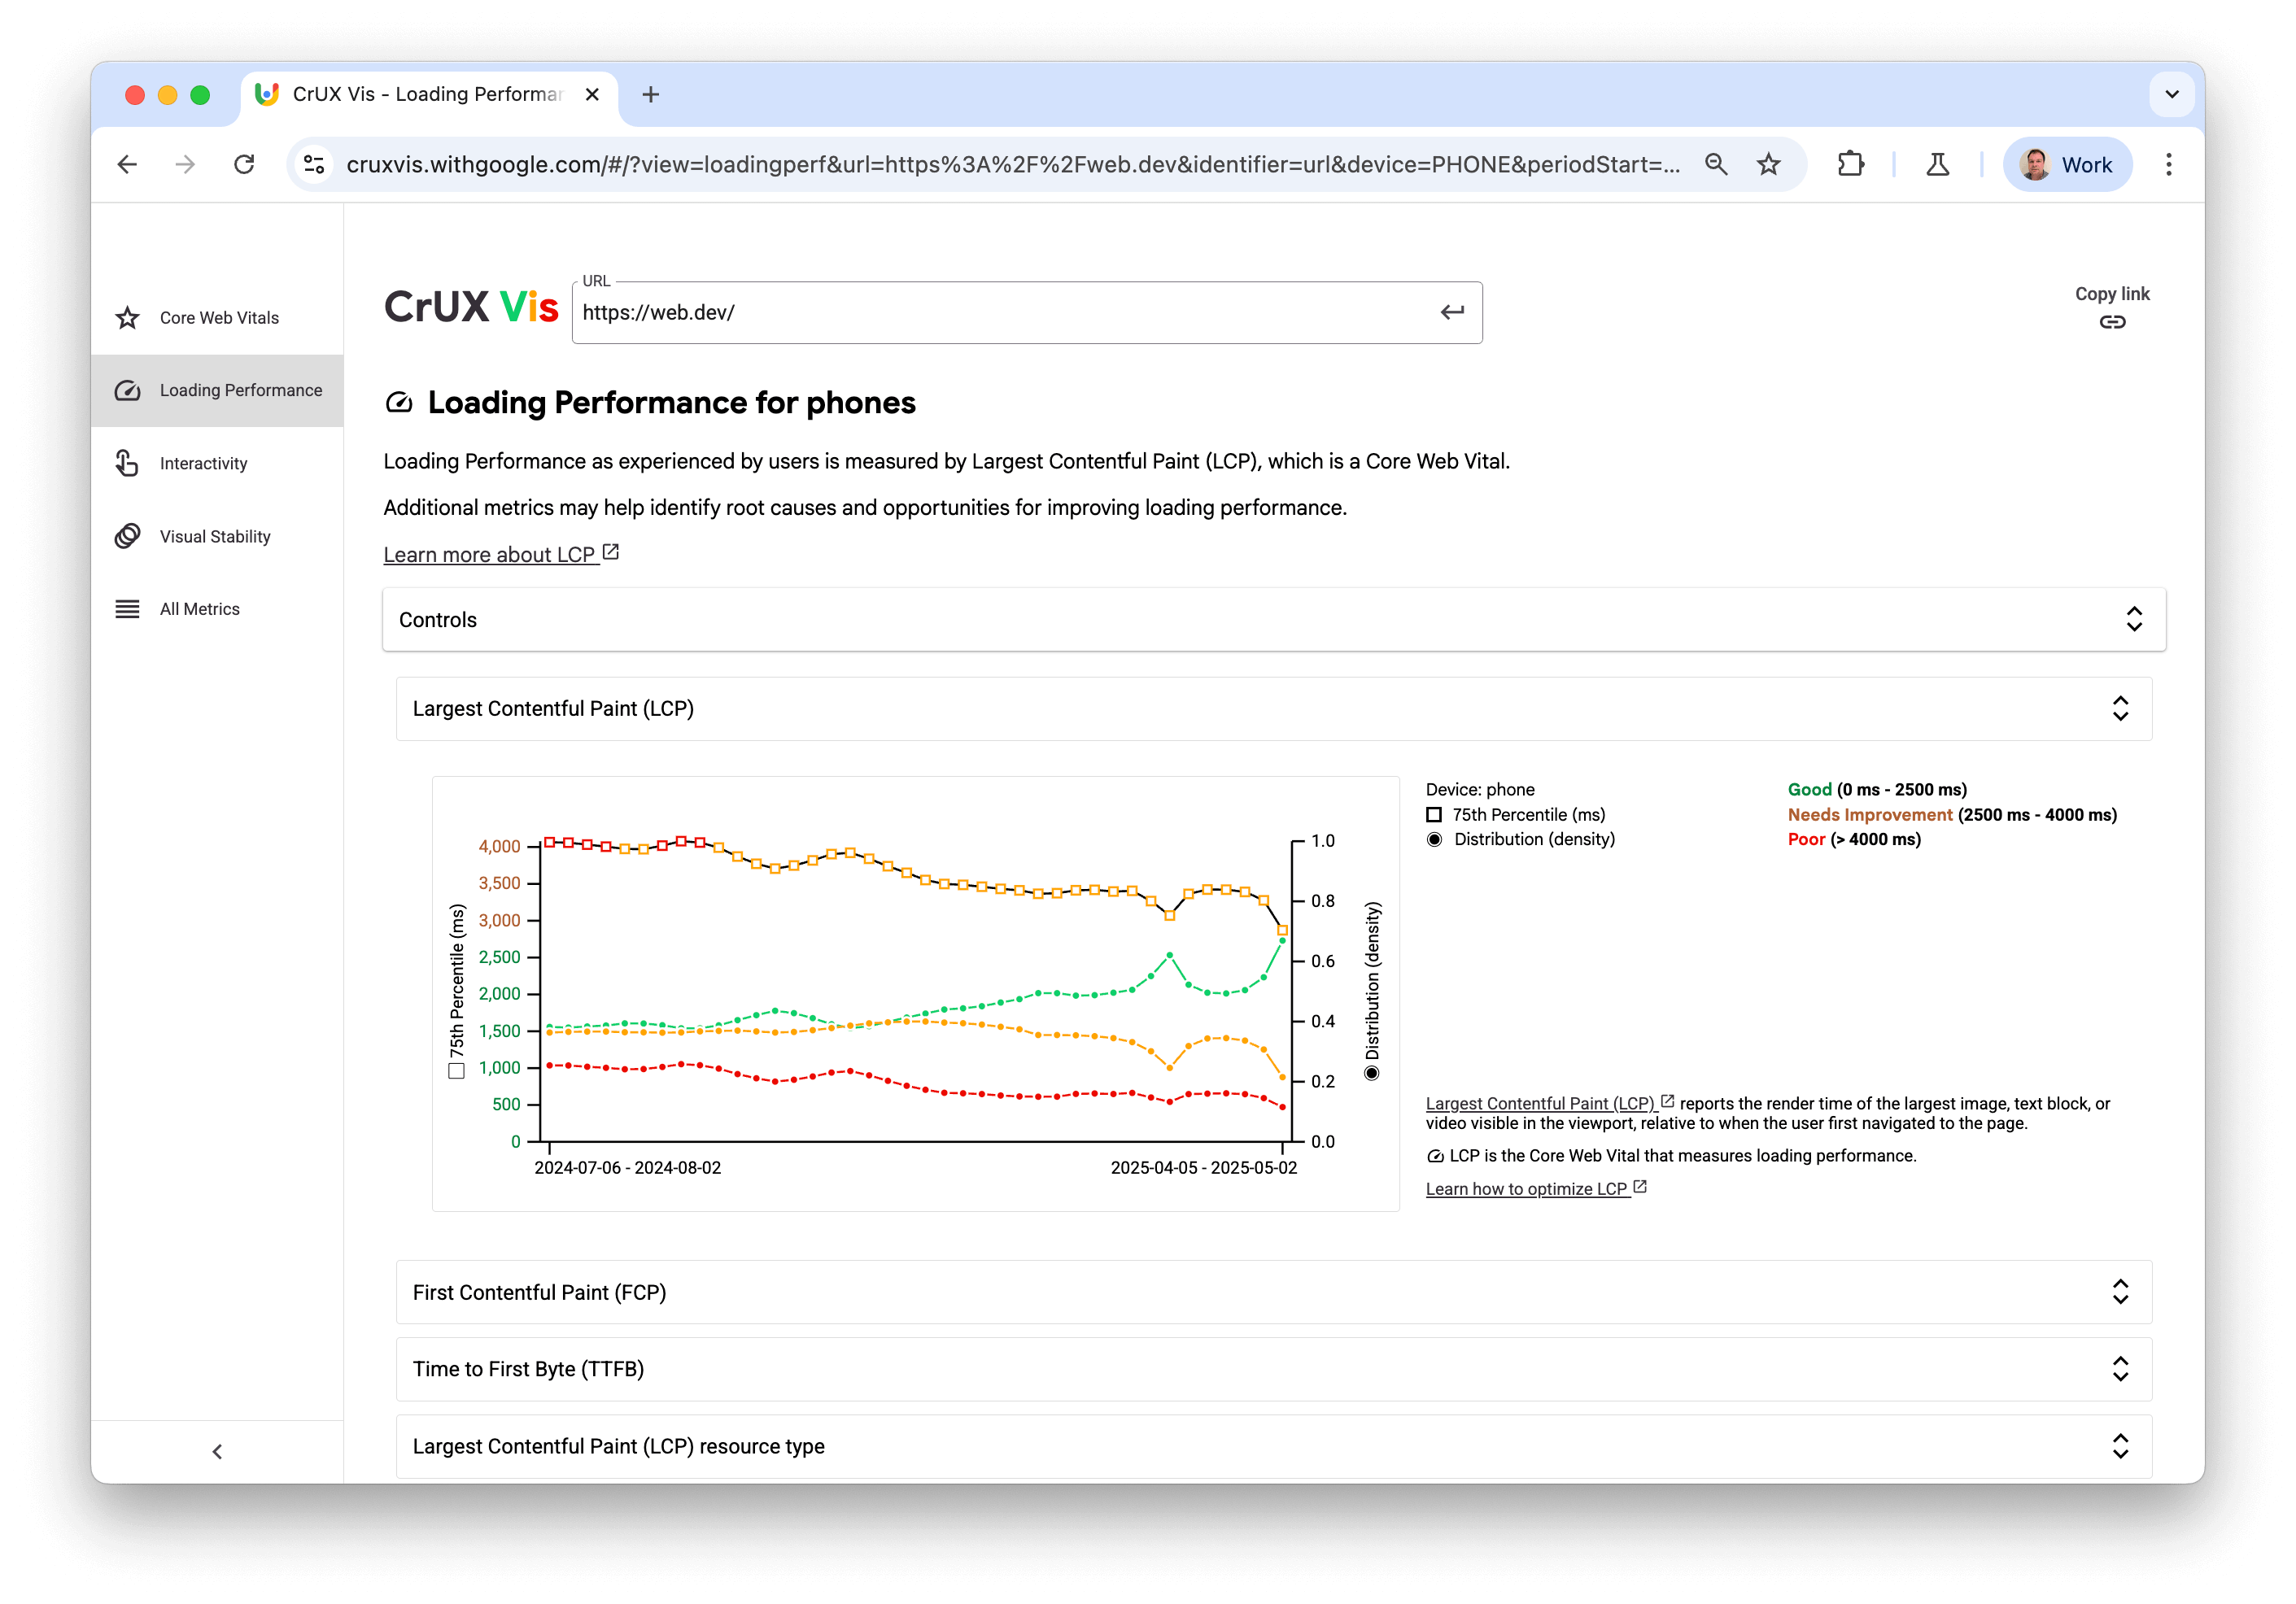
This page includes the following metrics:
- Largest Contentful Paint (LCP)
- First Contentful Paint (FCP)
- Time to First Byte (TTFB)
- Largest Contentful Paint (LCP) resource type
- Largest Contentful Paint (LCP) image subparts
- Round Trip Time (RTT)
- Navigation types
- Form Factors
Interactivity
The Interactivity page includes all interactivity-related metrics in CrUX History API.
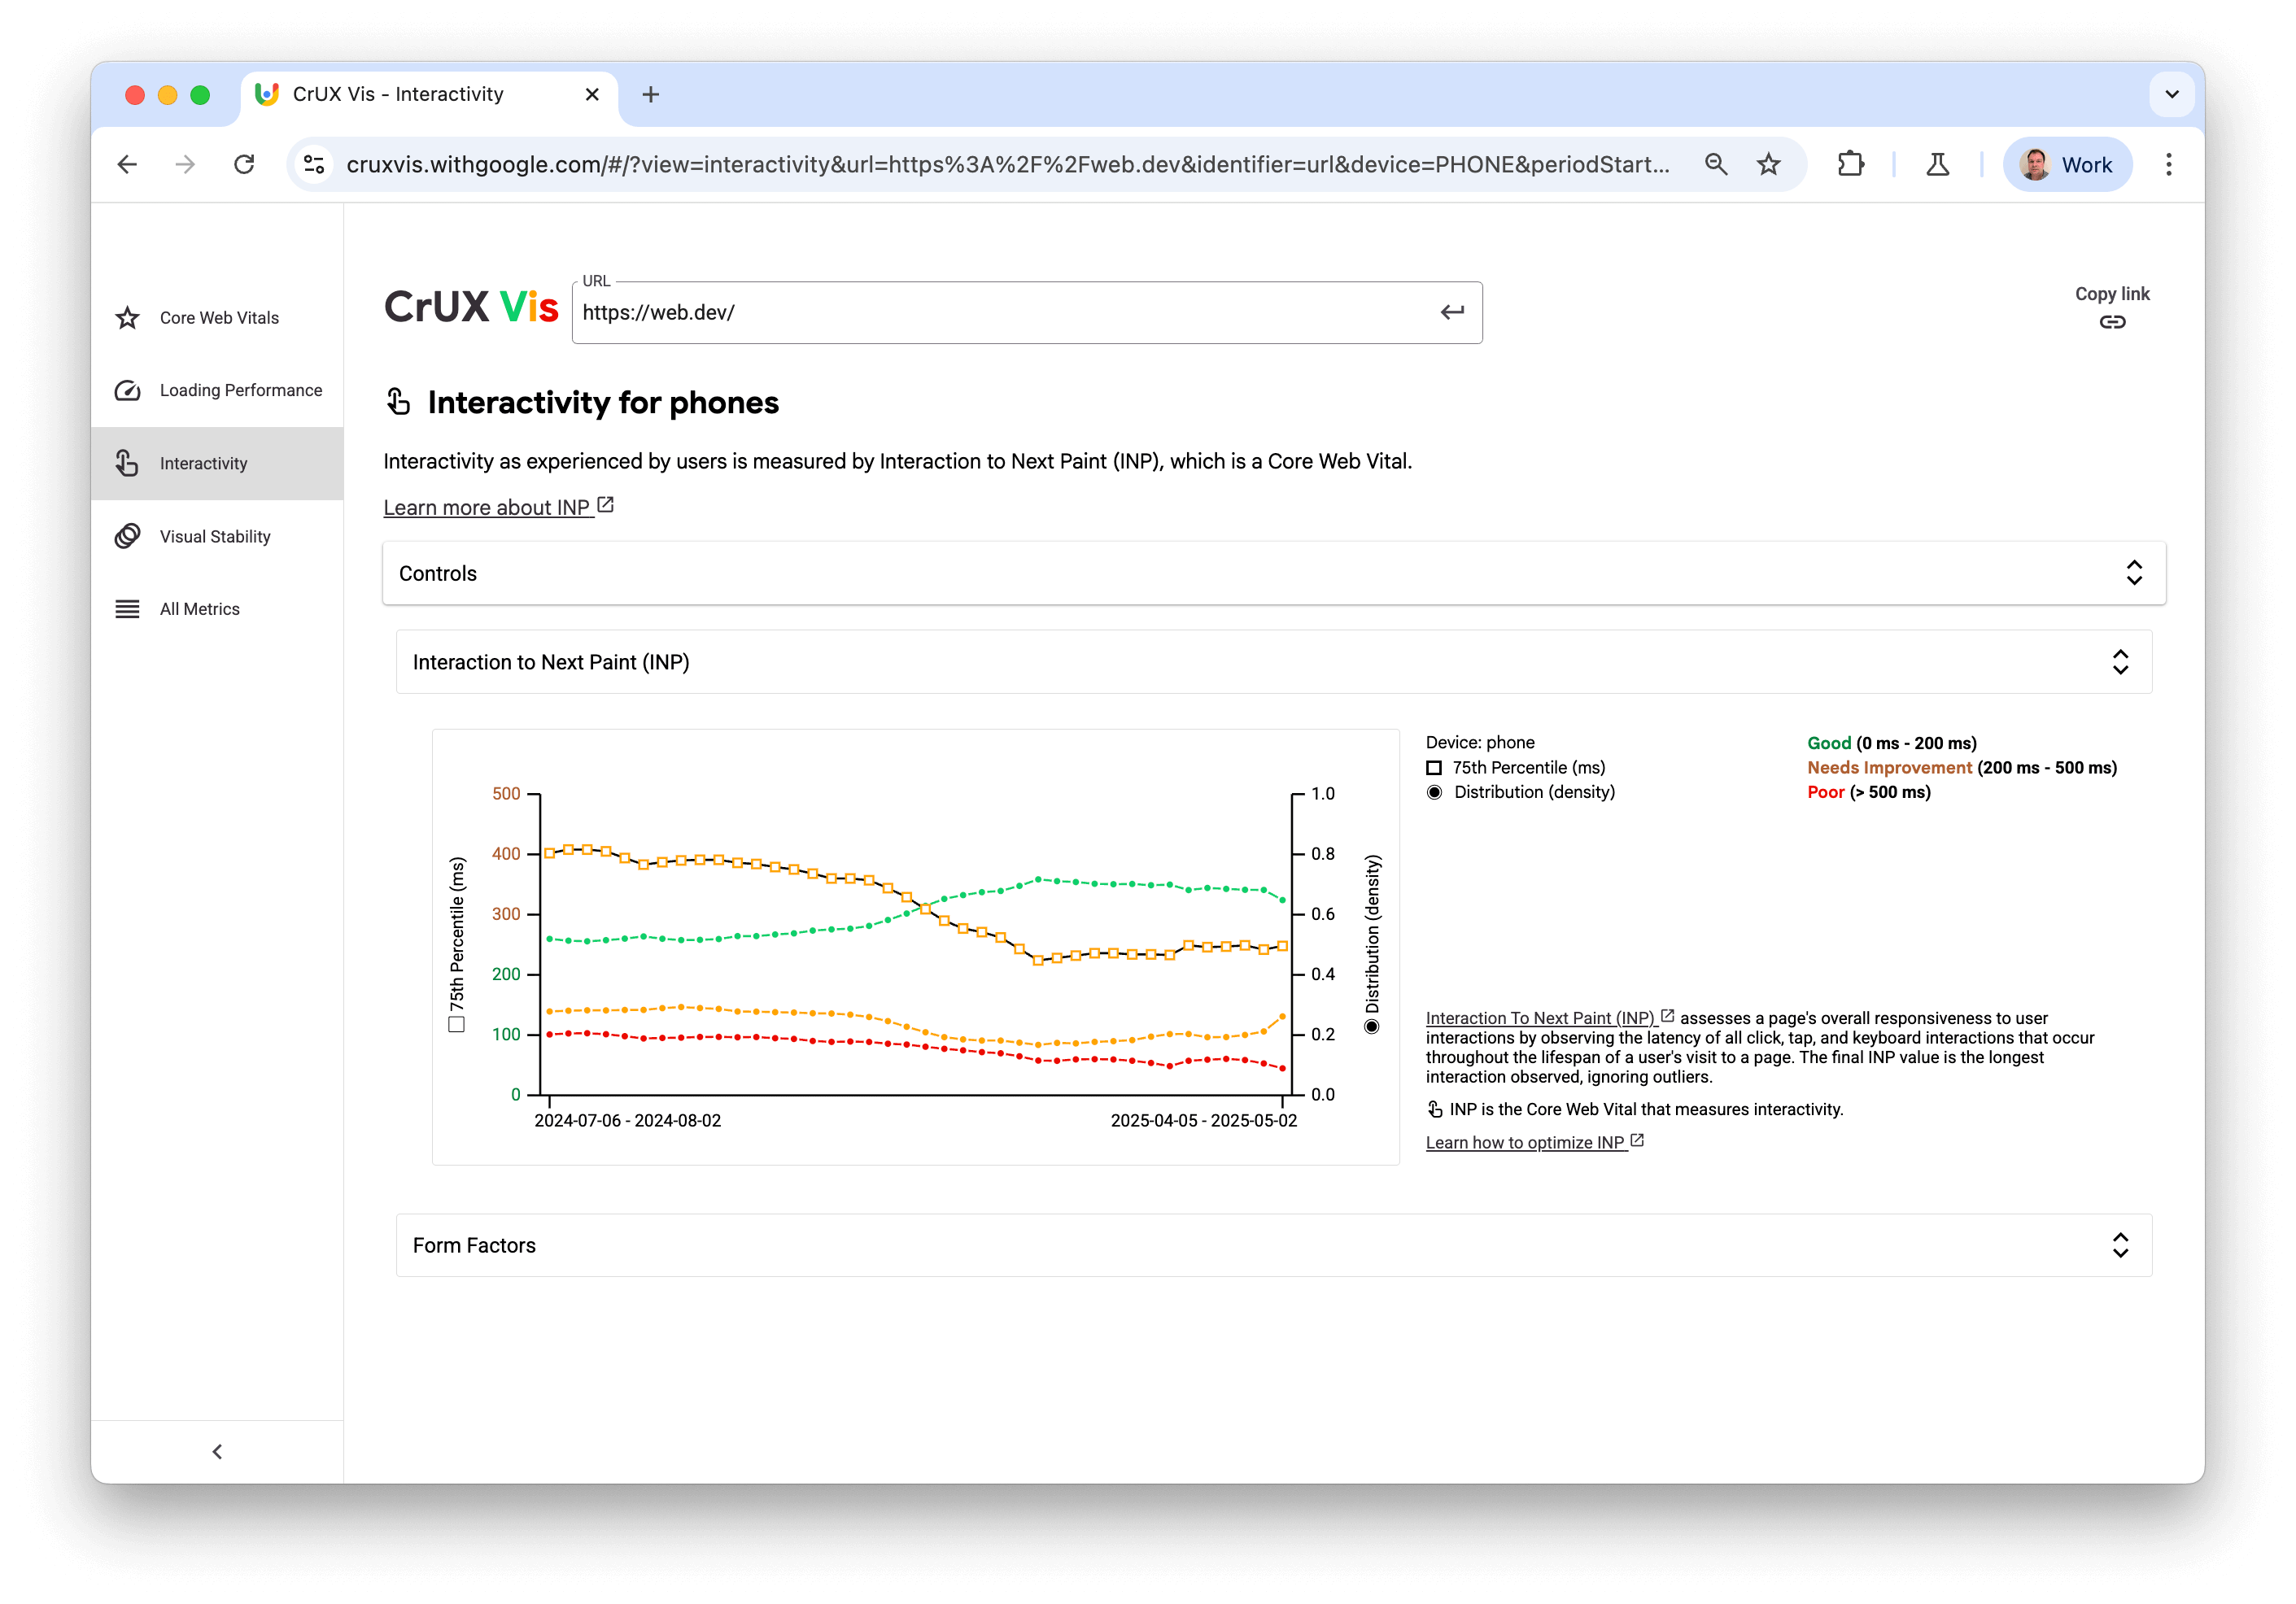
This page includes the following metrics:
Visual Stability
The Visual Stability page includes all visual stability-related metrics in CrUX History API.
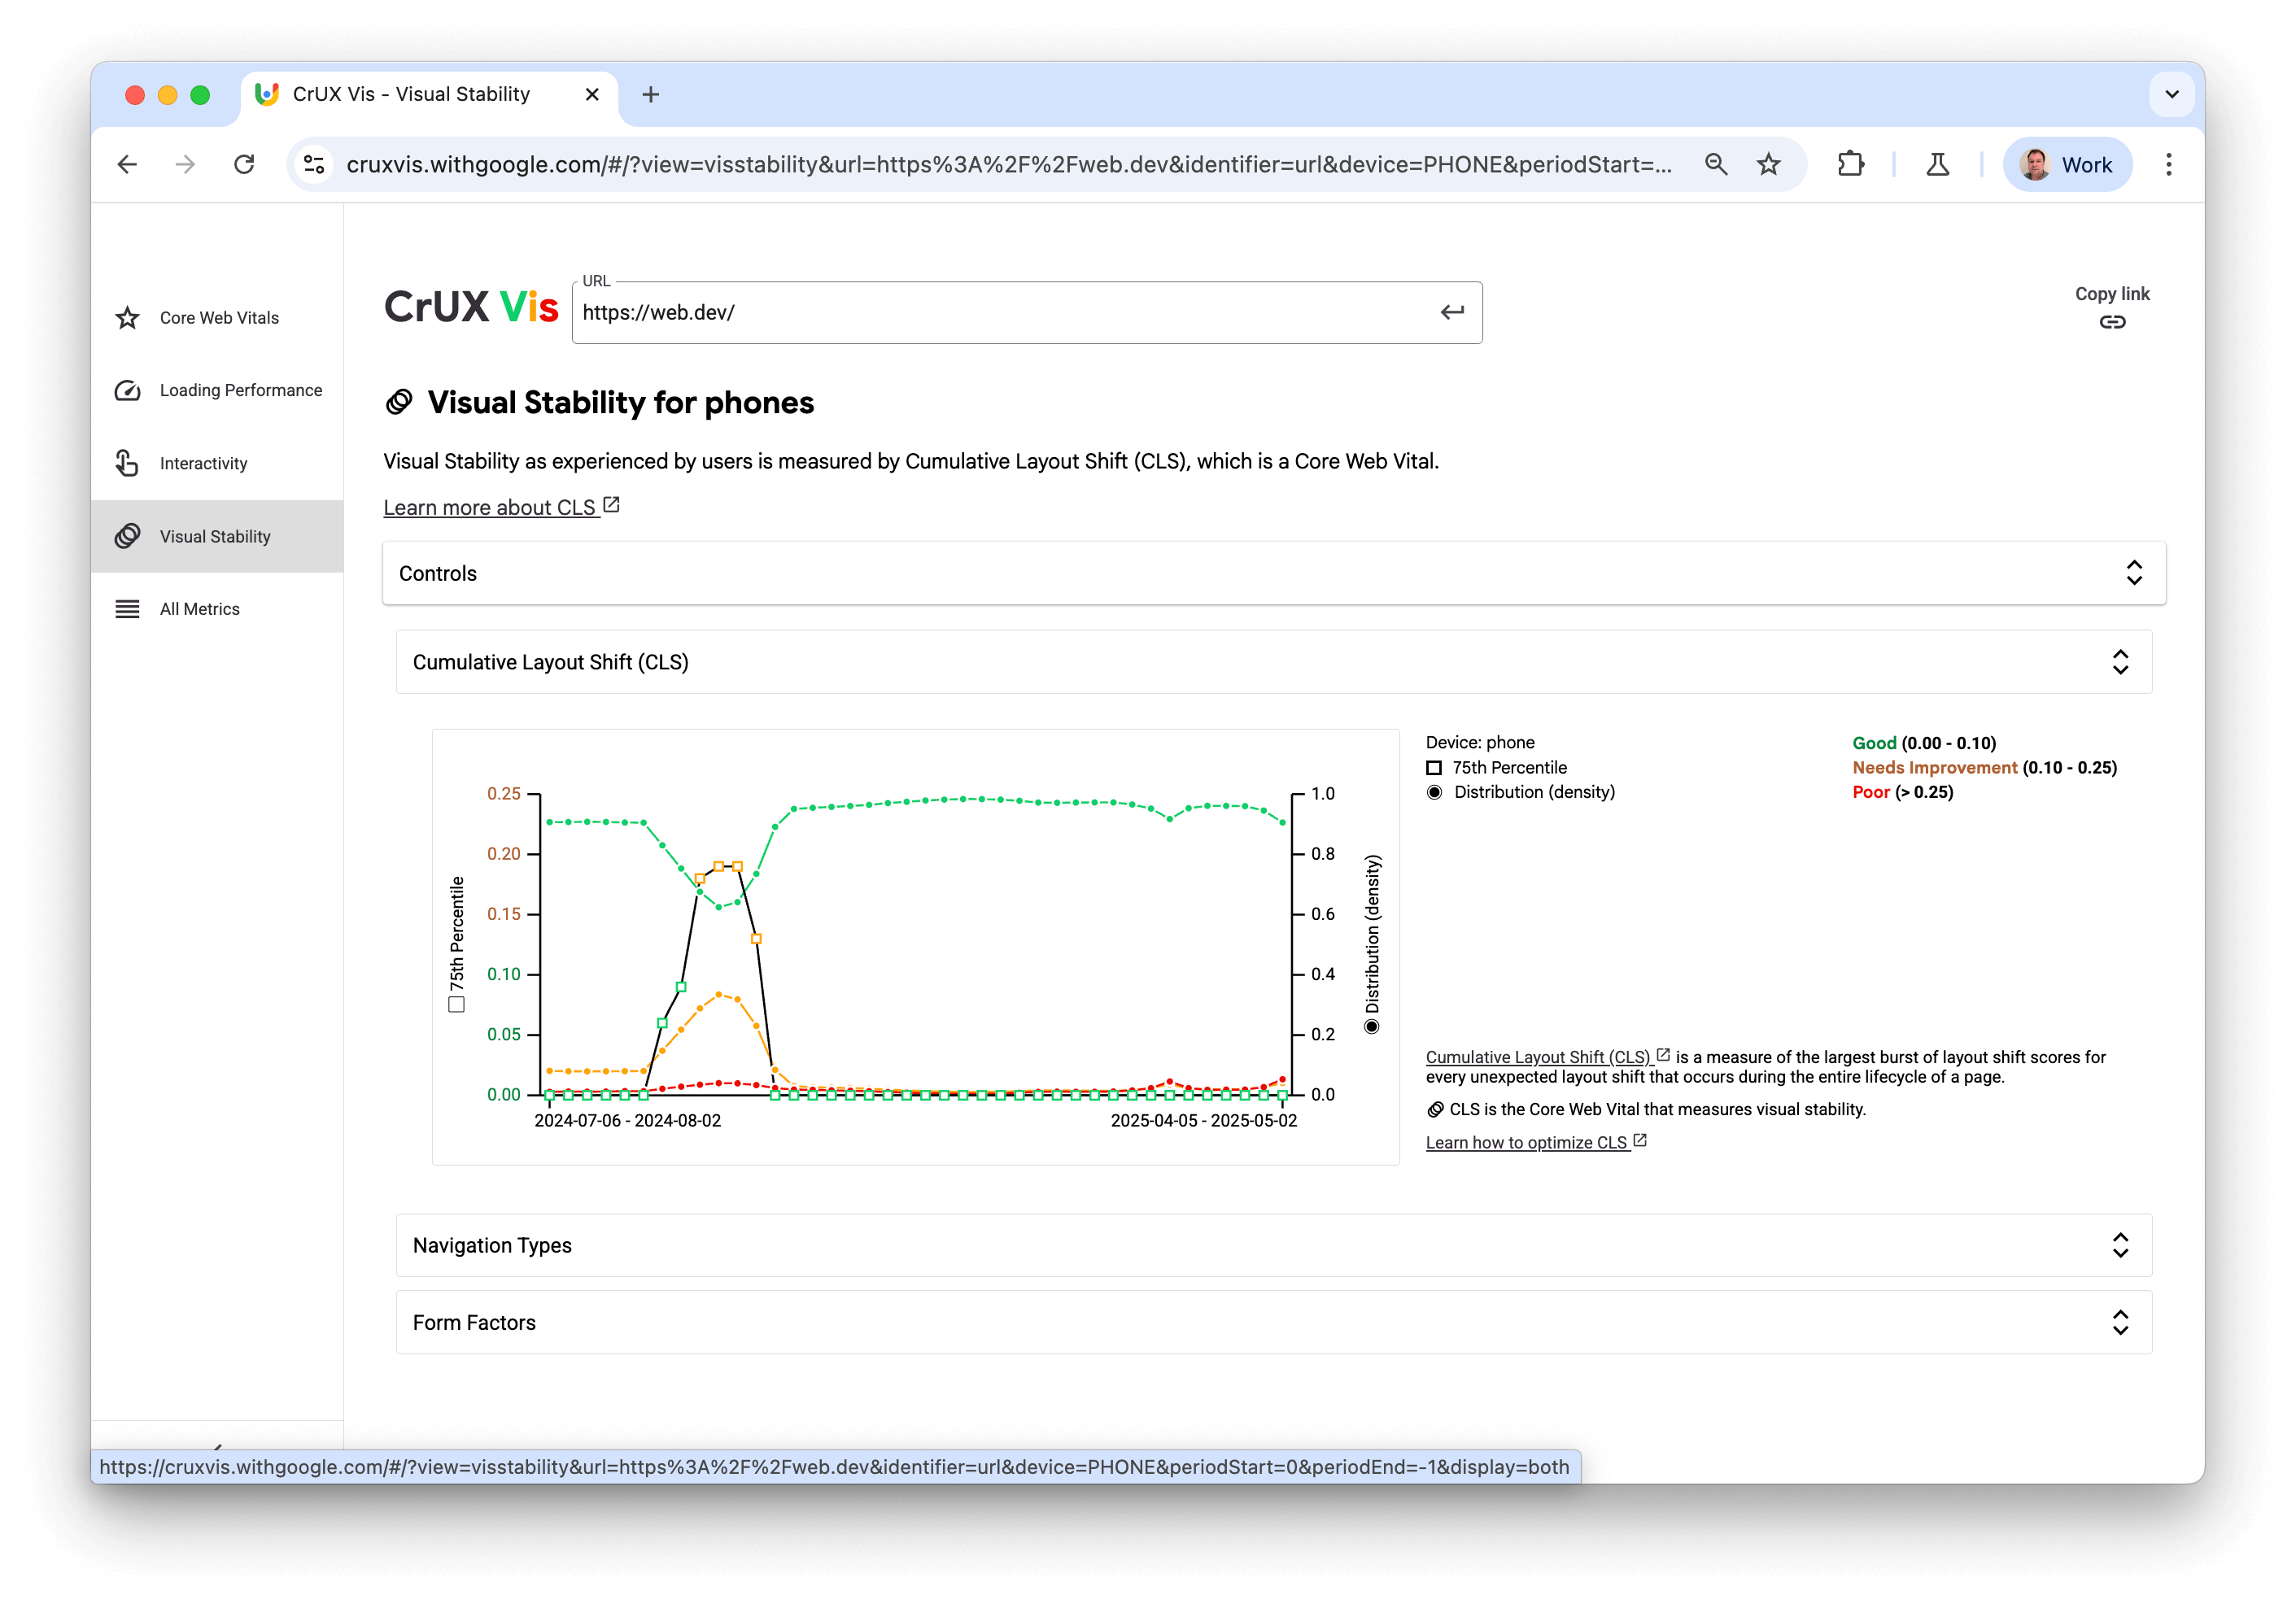
This page includes the following metrics:
All Metrics
The All Metrics page includes all metrics in CrUX History API in one place:
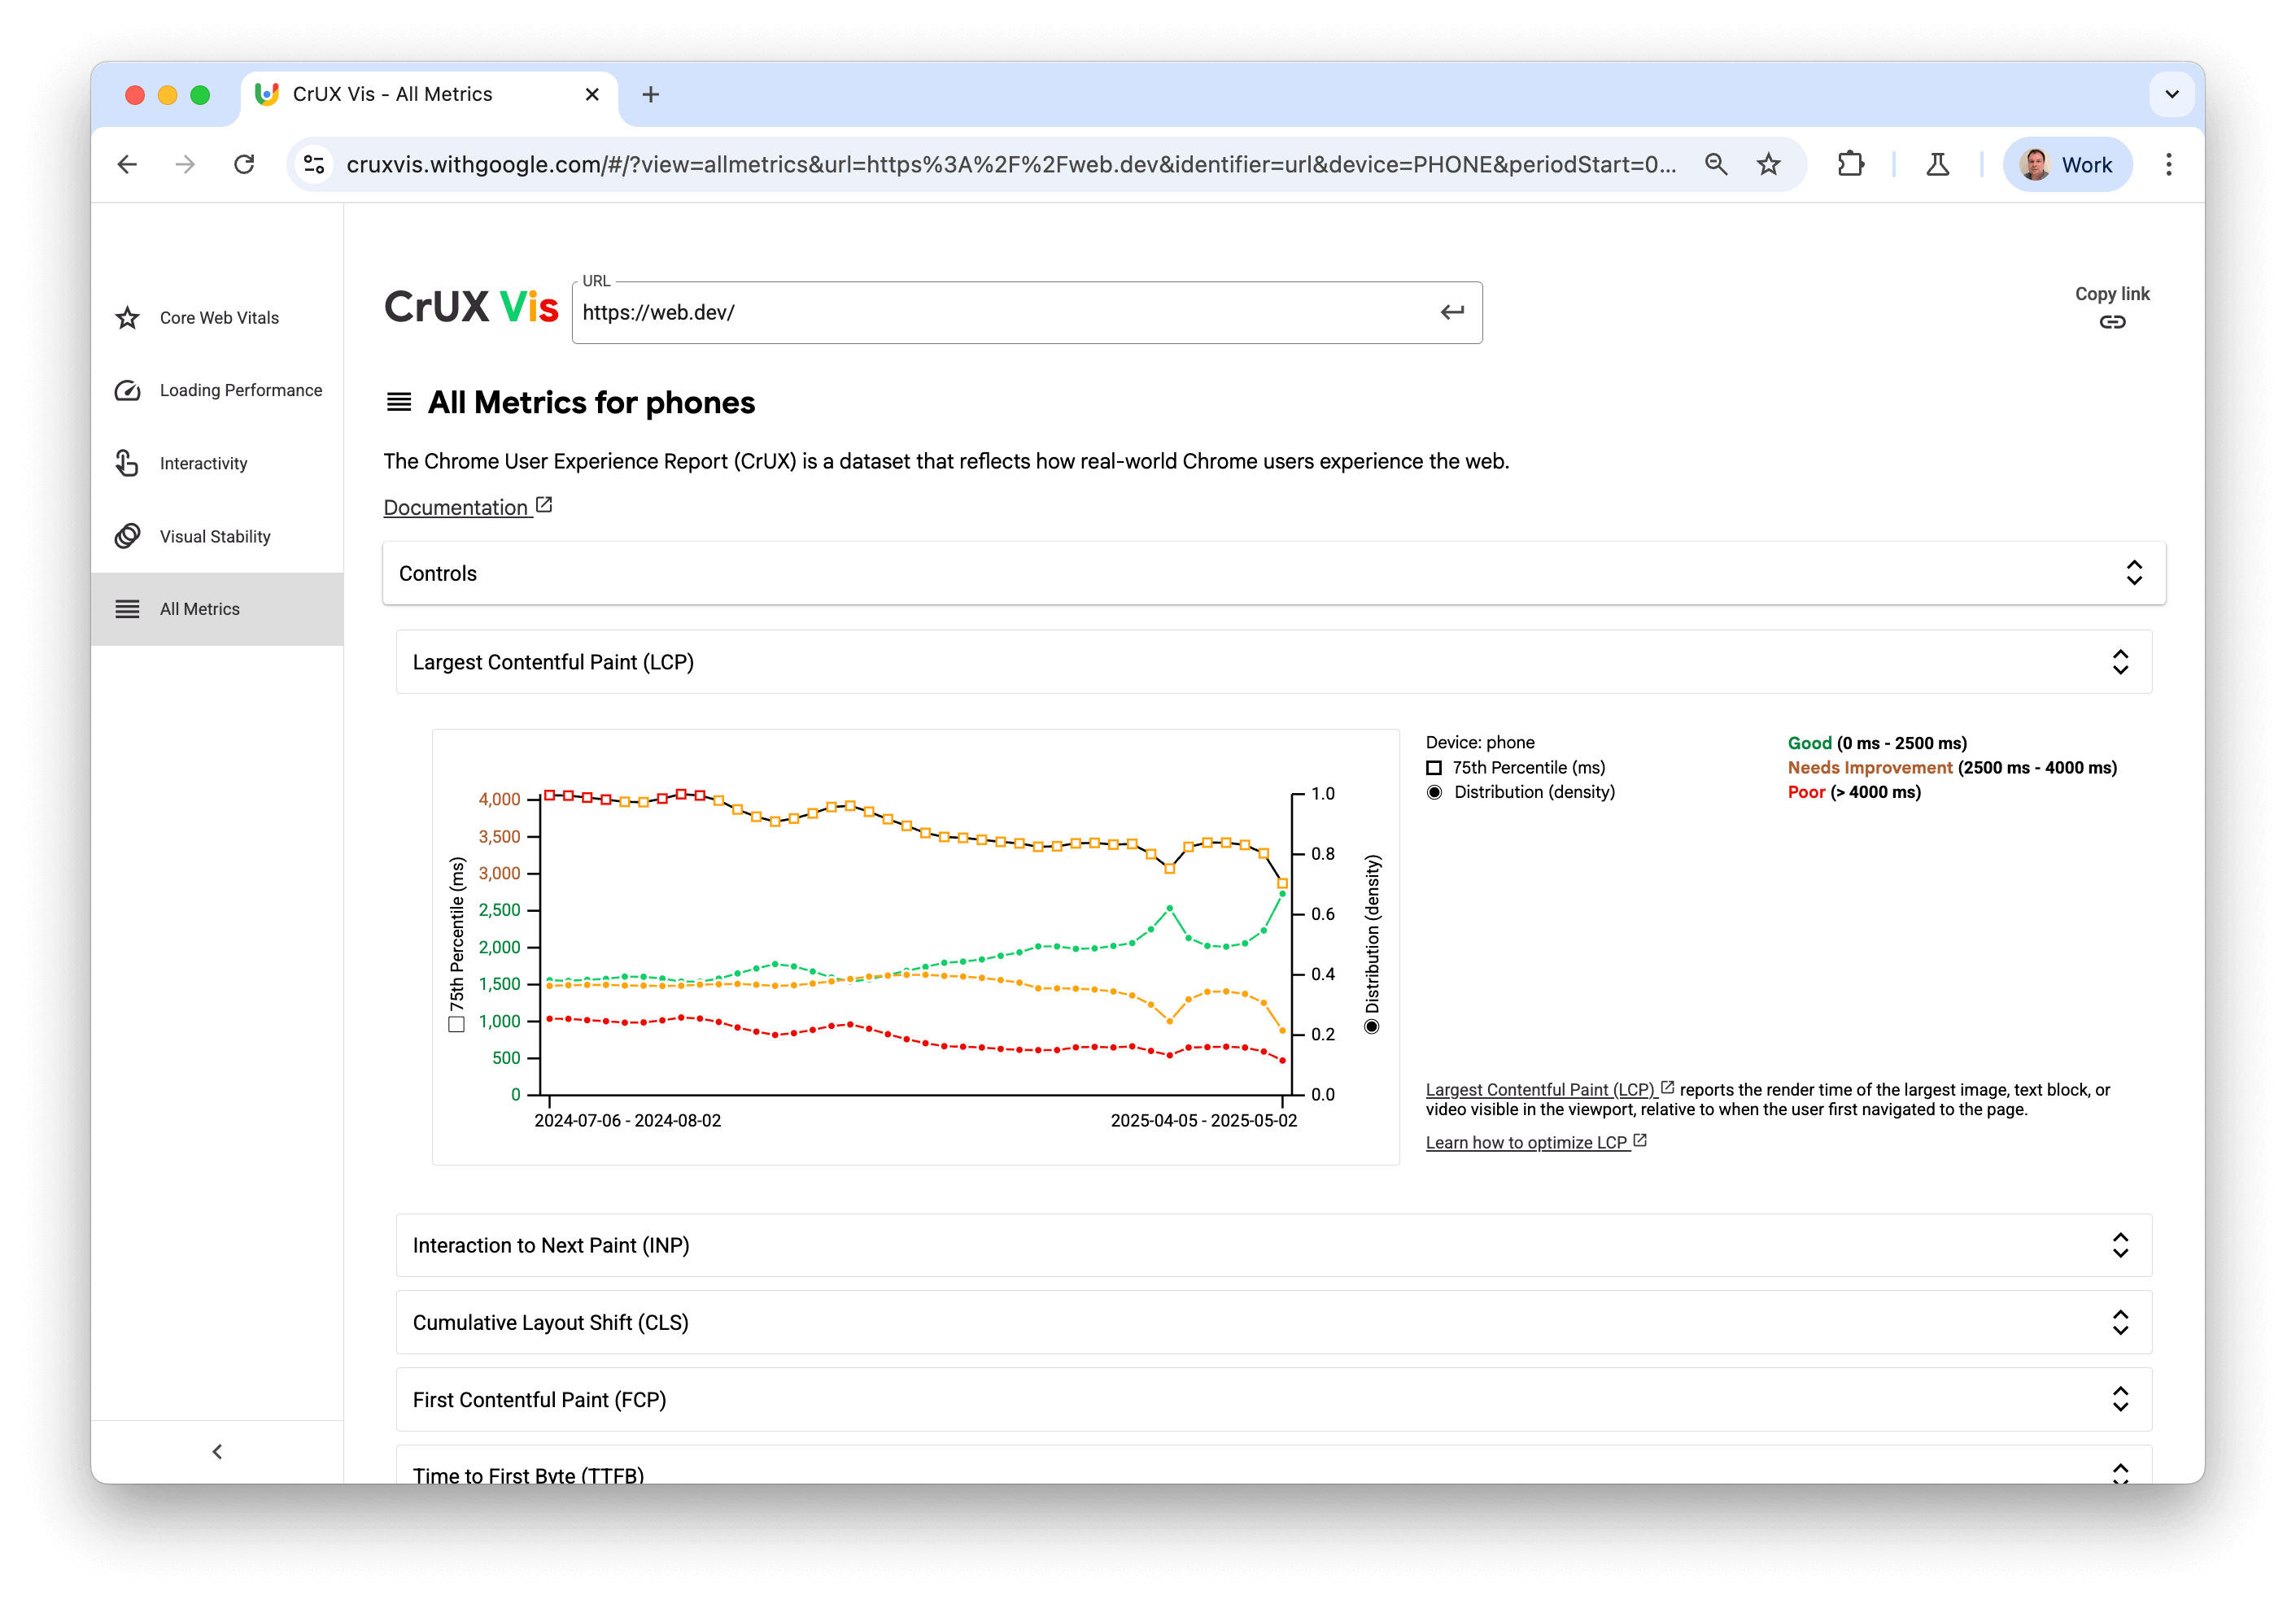
This page includes the following metrics:
- Largest Contentful Paint (LCP)
- Interaction to Next Paint (INP)
- Cumulative Layout Shift (CLS)
- First Contentful Paint (FCP)
- Time to First Byte (TTFB)
- Largest Contentful Paint (LCP) resource type
- Largest Contentful Paint (LCP) image subparts
- Round Trip Time (RTT)
- Navigation types
- Form Factors
FAQ
These are some of the frequently asked questions about the CrUX Vis:
When would I use the CrUX Vis as opposed to other tools?
CrUX Vis is for viewing historical data over time. Other tools such as PageSpeed Insights may only show the latest data.
See also CrUX Tools.
How can I get the data that CrUX Vis displays?
All data in CrUX Vis comes from the CrUX History API which can be queried using a CrUX API key.
How can I customize CrUX Vis?
CrUX Vis does not offer customization options, beyond the controls. Users wishing to build a custom dashboard can use the CrUX History API that powers CrUX Vis to display the data as they want. Many third-party tools exist which provide alternative visualizations of this data.