

Does this sound familiar? You're debugging a performance issue in Chrome DevTools, but the overwhelming amount of information in the Performance panel makes it hard to focus on only the most relevant and actionable parts. Between the length of the timeline, the depth of the flame chart, and the breadth of many different tracks of data, it can be a challenge to navigate. As incredibly powerful as the Performance panel is, its usefulness shouldn't have to come at the cost of usability!
As part of our initiative to improve Chrome's performance tooling, we've recently launched three new features aimed at reducing information density and helping developers customize their workflows:
- Hide irrelevant parts of the timeline
- Hide irrelevant parts of the flame chart
- Hide irrelevant tracks
In this post, we'll take a closer look at each one of these features and show how you can use them to focus on only the most critical information.
Hide irrelevant parts of the timeline
Web performance operates on the scale of milliseconds, so even if your performance recording is only a few seconds long, there are ample opportunities to lose your place.
In Chrome 122, we added the ability to create breadcrumbs. This feature lets you clamp the boundaries of the timeline so that you'll only be able to zoom or pan inside of an area of interest set by you. Constraining the timeline in this way can be especially useful if you're trying to debug responsiveness issues, for example, so you can focus your attention on a single interaction or problematic long task.
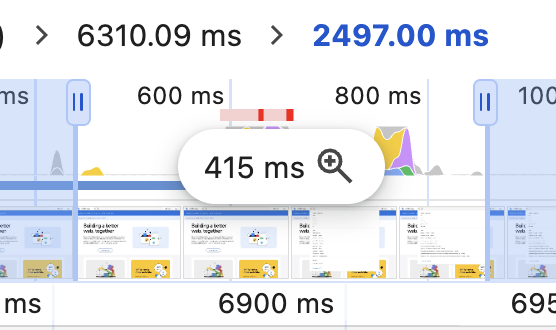
The preceding screenshot shows a close-up of the timeline overview, which visualizes main thread activity like script execution and presentation work. When you hold the pointer over it, a new button appears that will set the boundaries of the timeline to the current window. The button is labeled by the width of the time window, in milliseconds, and the icon. The breadcrumbs are located above the timeline overview, and each one is labeled by the size of its time window.
To use this feature:
- Zoom and pan the timeline to an area of interest.
- Click the magnifying glass icon in the timeline overview to clamp the timeline and set a breadcrumb.
- Repeat as needed to zoom in on a nested area of interest.
- Click the breadcrumbs to return to previous areas of interest or the full range of the timeline.
Trimming the timeline helps to ensure that you'll never accidentally scroll out of bounds into an irrelevant part of the timeline. When you need to, though, you can click the breadcrumbs to zoom back out. Another benefit is that the timeline overview will stay aligned with the following tracks. This can make it a lot easier to spot performance opportunities like forced reflows and identify their root cause in the flame chart.
Hide irrelevant parts of the flame chart
Analyzing main thread activity is no small feat. This part of the Performance panel is known as the flame chart, because of how long and spindly the call stacks can become. In some extreme cases, these stacks can be so unwieldy that it's hard to make sense of the whole thing and focus on what you're trying to optimize.
Beginning in Chrome 124, you can customize exactly which entries in the flame chart to hide, so you can focus on the most actionable information.
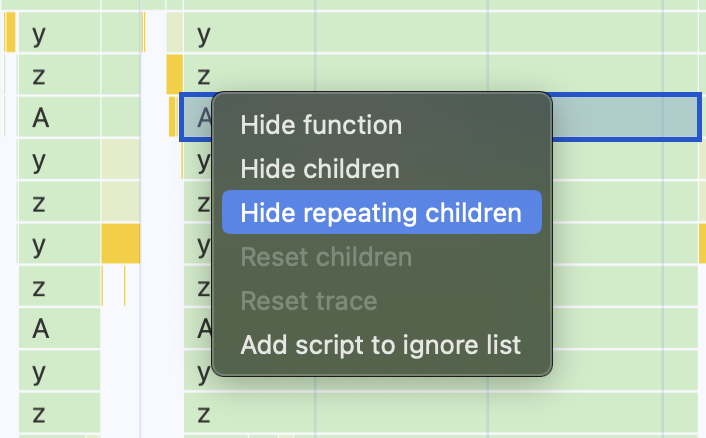
When you right-click on a function in the flame chart, a context menu appears with several options for hiding entries:
- Hide function: Remove the selected function from the flame chart. Its children will move up to appear immediately after its parent function.
- Hide children: Prune the flame chart at the selected function, hiding all of its children.
- Hide repeating children: Remove all instances of the selected function from the rest of the flame chart.
There are also several helpful keyboard shortcuts you can use when a function is selected:
- H: hide the selected function
- C: hide the children of the selected function
- R: hide instances of the selected function later in the stack'
- U: show the hidden children of the selected function
Permanently hide irrelevant scripts
The Add script to ignore list option hides the selected function from the flame chart, as well as all other functions defined within the same script file. The script is also added to the ignore list, which the DevTools debugger uses to step over functions and disregard exceptions originating from the script.
Scripts added to the ignore list are persisted, so they'll continue to be hidden from the flame chart in new traces. Scripts outside of your control would be good candidates for the ignore list. On the other hand, hiding individual functions is temporary to the current trace and more situation-dependent. For example, you might want to hide a cumbersome stack of recursive function calls to make the trace easier to work with.
To revert the ignore list or any other hidden functions in the flame chart, you can use the context menu to reset the children of the selected function or reset all hidden functions throughout the trace. Functions with hidden children are annotated with the ▼ icon, which also resets the children when clicked.
Any unnecessary depth and complexity that you can take away from the flame chart will make it that much more usable. When needed, having the ability to customize which entries you see is an ergonomic improvement to help you focus your attention on the most significant information for the task at hand.
Hide irrelevant tracks
Main thread activity makes up just one track of the Performance panel. Tracks in the Performance panel visualize the activity of a process, and they're all aligned to a common timeline to aid in debugging. In addition to the Main track, there are individual tracks for the other subframes, threads, and workers used by the page, as well as the Network, Frames, Animations, and Interactions tracks. Even more tracks mark the activity of lower-level Chrome processes like IO, GPU, and Compositor. That's a lot of information! And yet, for most performance workflows, you'll only be concerned with the information from a few tracks at a time.
As of Chrome 125, there's a new configuration mode that lets you hide unneeded tracks or rearrange them to your liking. For example, if you're optimizing a slow interaction, you may choose to hide everything but the Interactions, Main, and GPU tracks.
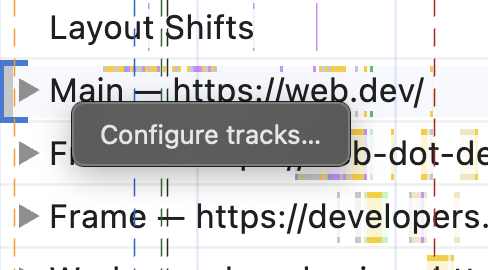
To edit the tracks, right-click on the name of any track and select Configure tracks…. This opens the configuration mode, where you'll be able to show, hide, or rearrange individual tracks. Click the Finish configuring tracks button to save your preferences.
Configuring tracks puts you in control of the way the Performance panel presents critical information to your workflow. You can use these settings to hide the activity from unrelated processes, and move the tracks around in a way that gives you the easiest access to the data you need.
Wrapping up
These three features provide you with powerful new ergonomic controls to customize your performance workflows. By using these features and reducing the amount of noise, you'll put yourself in a much better position to find what you're looking for and make sense of the data.
We'd love to hear what's working well or how your experience could be improved. Let us know if you have any questions or general feedback by reaching out to @ChromeDevTools. If something's not working or you have a suggestion for new features, leave a comment on this open issue.
This is just the beginning of our initiative to improve Chrome's performance tooling and we're excited to share everything else we have cooking to make the Performance panel easier to use and more powerful than ever. We'll publish our next post showcasing the next batch of features right here on the Chrome for Developers blog. Meanwhile, check out the What's New in Chrome page to stay in the loop with everything new in DevTools and Chrome.