

Published: March 19, 2025
In our continued coverage of the initiative to improve Chrome performance tooling, we're excited to announce more upgrades to how you can interact with the DevTools Performance panel. These improvements are designed to enhance your ability to navigate performance traces and reduce irrelevant noise, so you can concentrate on quickly tracking down and resolving performance issues.
Improved navigation
We've heard feedback from many users that scrolling and zooming in the Performance panel can be unintuitive. While many long-time users are used to it, many people expect a scroll gesture to, well, scroll, and not zoom in and out of the trace.
A new option under the allows switching between the existing "Classic" scrolling and the new "Modern" approach.
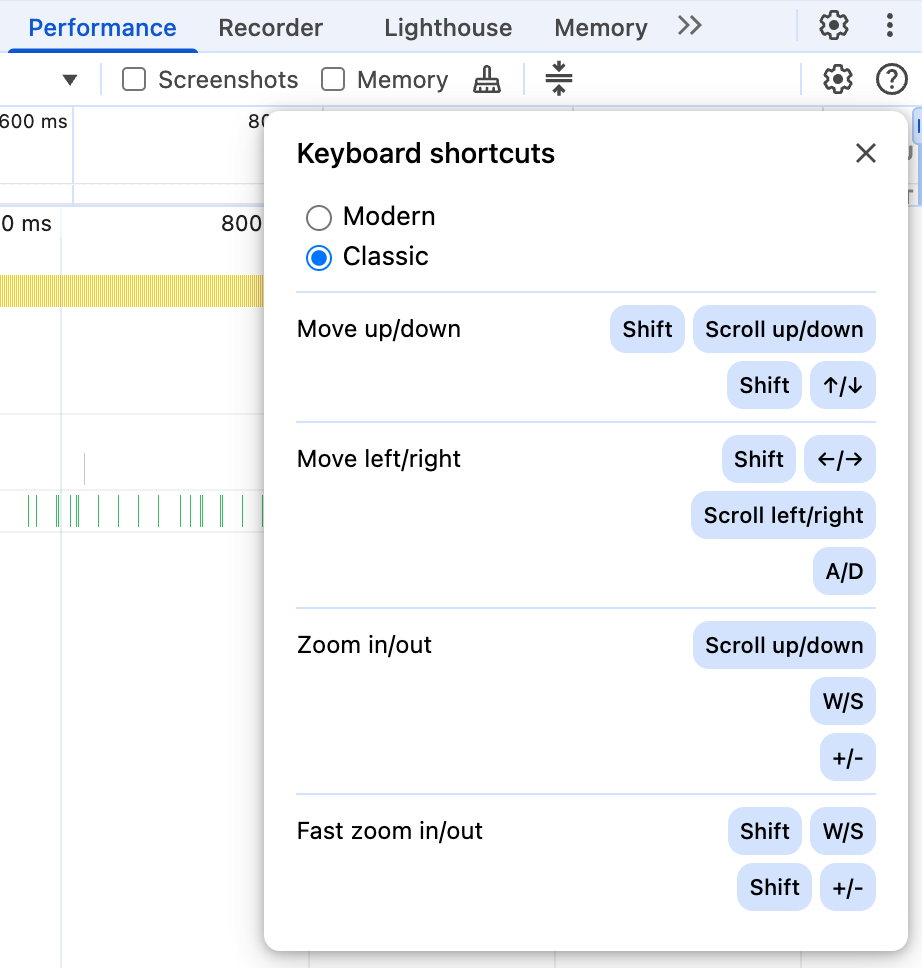
In Classic mode, scrolling (by trackpad or scroll wheel) continues to zoom in and out, while holding shift and scrolling will scroll up and down the flamechart.
In the new Modern mode, these are reversed: scrolling now scrolls the flamechart, while shift and scrolling zooms in and out.
Keyboard shortcuts (like using WASD to navigate the trace) will continue to work unchanged.
Bidirectional overview
Near the top of the Performance panel is the CPU chart, part of the timeline overview. It displays estimates of CPU usage during the trace recording, broken down by work type (for instance, orange for script execution, purple for rendering operations).
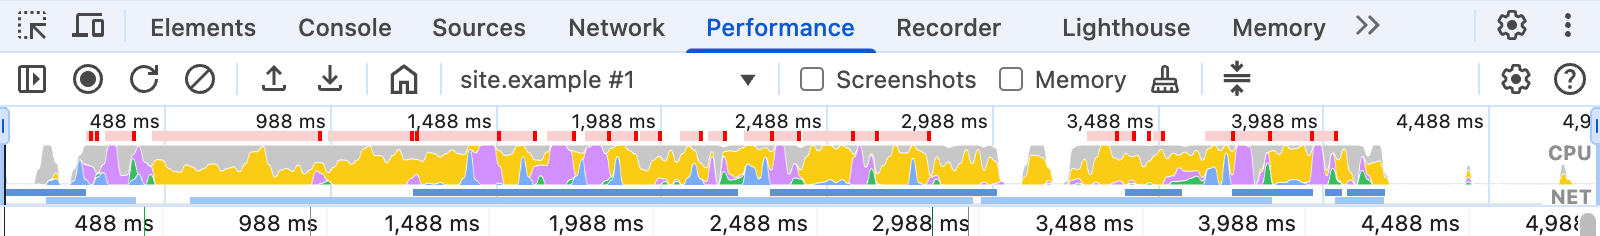
This gives an overview—sometimes referred to as a minimap—of the trace, providing a high-level summary of the entire timeline even as you zoom deeper to investigate particular issues.
However, it can be easy to lose your exact place in the minimap when primarily looking at the trace—and vice versa—so we've introduced new features that help tie the overview to the zoomed-in view. Now, when you hover over the overview, a corresponding vertical line appears in the flamechart, marking the same point in time in the flamechart:
Similarly, hovering over entries in the flamechart will now highlight the corresponding part of the CPU chart. This is great for seeing exactly which tasks are causing those CPU spikes.
Filter the trace
Debugging performance issues usually involves sifting through a large amount of data. To help you focus on the most relevant information, we've improved the ability to filter out noise.
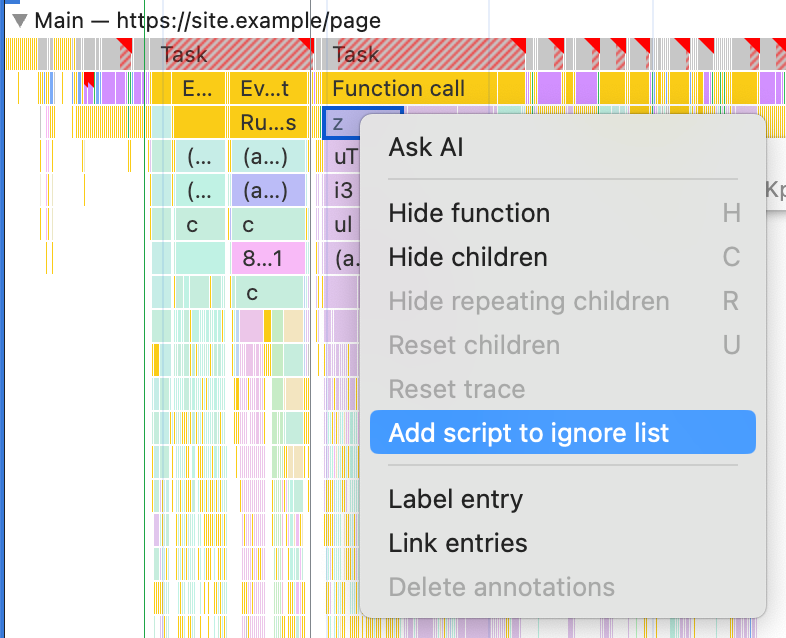
Last year, we introduced the ability to add scripts in the Performance panel to the DevTools ignore list, filtering out less relevant entries in the flamechart. For example, if you're debugging the performance of a component in your page, it can be distracting if the callstack of your framework is deep enough to require you to scroll up and down the performance panel, and you often want to collapse much of that callstack to focus on the important parts.
You can right-click an entry in the flamechart and select Add script to ignore list, which adds the script to the DevTools ignore list and collapses any entries from it in the flamechart.
But now you can also manually edit the ignore list directly from the at the top of the Performance panel. Ignore-list regexes are shared across DevTools—so matched scripts with be skipped when debugging in the Sources panel and collapsed into single entries in the flamechart—and the list is persistent across DevTools sessions.
This way you get fine-grained control over which files to ignore, and a handy place to enable and disable rules as you work.
Dim 3rd-party scripts
Third-party scripts are common on websites, but they can often be out of our control, or irrelevant for a particular debugging session. The new Dim 3rd parties option at the top of the Performance panel will gray out third-party script and network activity in the timeline, reducing visual clutter and allowing you to focus on first-party performance contributions.
But sometimes you want even more control, like concentrating on a particular third party, or even only contributions from your own API or CDN. At the bottom of the panel in the Summary tab, is a breakdown of first and third parties that DevTools is able to find in the page. Hovering over each entity in the list will gray-out any activity that isn't from that entity.
Conclusion
These new features should help you better navigate the Performance panel and filter out the noise to concentrate on the parts of the trace that are important to you. Try these features out and let us know how they could be further improved or what other improvements you'd love to see.