At Chrome Dev Summit 2020, we demoed Chrome's debugging support for WebAssembly applications on the web for the first time. Since then, the team has invested a lot of energy into making the developer experience scale for large and even huge applications. In this post we will show you the knobs we added (or made work) in the different tools and how to use them!
Scalable debugging
Let's pick up where we left off in our 2020 post. Here is the example we were looking at back then:
#include <SDL2/SDL.h>
#include <complex>

int main() {
  // Init SDL.
  int width = 600, height = 600;
  SDL_Init(SDL_INIT_VIDEO);
  SDL_Window* window;
  SDL_Renderer* renderer;
  SDL_CreateWindowAndRenderer(width, height, SDL_WINDOW_OPENGL, &window,
                              &renderer);

  // Generate a palette with random colors.
  enum { MAX_ITER_COUNT = 256 };
  SDL_Color palette[MAX_ITER_COUNT];
  srand(time(0));
  for (int i = 0; i < MAX_ITER_COUNT; ++i) {
    palette[i] = {
        .r = (uint8_t)rand(),
        .g = (uint8_t)rand(),
        .b = (uint8_t)rand(),
        .a = 255,
    };
  }

  // Calculate and draw the Mandelbrot set.
  std::complex<double> center(0.5, 0.5);
  double scale = 4.0;
  for (int y = 0; y < height; y++) {
    for (int x = 0; x < width; x++) {
      std::complex<double> point((double)x / width, (double)y / height);
      std::complex<double> c = (point - center) * scale;
      std::complex<double> z(0, 0);
      int i = 0;
      for (; i < MAX_ITER_COUNT - 1; i++) {
        z = z * z + c;
        if (abs(z) > 2.0)
          break;
      }
      SDL_Color color = palette[i];
      SDL_SetRenderDrawColor(renderer, color.r, color.g, color.b, color.a);
      SDL_RenderDrawPoint(renderer, x, y);
    }
  }

  // Render everything we've drawn to the canvas.
  SDL_RenderPresent(renderer);

  // SDL_Quit();
}
It's still a fairly small example and you would likely not see any of the real issues you would see in a really big application, but we can still show you what the new features are. It's quick and easy to set up and to try for yourself!
In the last post, we discussed how to compile and debug this example. Let's do that again, but let's also take a peek at the //performance//:
$ emcc -sUSE_SDL=2 -g -O0 -o mandelbrot.html mandelbrot.cc -sALLOW_MEMORY_GROWTH
This command produces a 3MB wasm binary. And the bulk of that, as you might expect, is debug information. You can verify this with the llvm-objdump tool [1] for example:
$ llvm-objdump -h mandelbrot.wasm

mandelbrot.wasm:        file format wasm

Sections:
Idx Name          Size     VMA      Type
  0 TYPE          0000026f 00000000
  1 IMPORT        00001f03 00000000
  2 FUNCTION      0000043e 00000000
  3 TABLE         00000007 00000000
  4 MEMORY        00000007 00000000
  5 GLOBAL        00000021 00000000
  6 EXPORT        0000014a 00000000
  7 ELEM          00000457 00000000
  8 CODE          0009308a 00000000 TEXT
  9 DATA          0000e4cc 00000000 DATA
 10 name          00007e58 00000000
 11 .debug_info   000bb1c9 00000000
 12 .debug_loc    0009b407 00000000
 13 .debug_ranges 0000ad90 00000000
 14 .debug_abbrev 000136e8 00000000
 15 .debug_line   000bb3ab 00000000
 16 .debug_str    000209bd 00000000
This output shows us all the sections that are in the generated wasm file, most of them are standard WebAssembly sections, but there are also several custom sections whose name starts with .debug_. That's where the binary contains our debug information! If we add up all the sizes, we see that debug info makes up roughly 2.3MB of our 3MB file. If we also time the emcc command, we see that on our machine it took roughly 1.5s to run. These numbers make a nice little baseline, but they are so small probably no one would bat an eye about them. In real applications, though, the debug binary can easily reach a size in the GBs and take minutes to build!
Skipping Binaryen
When building a wasm application with Emscripten, one of its final build steps is running the Binaryen optimizer. Binaryen is a compiler toolkit that both optimizes and legalizes WebAssembly(-like) binaries. The running of Binaryen as part of the build is fairly expensive, but it is only required under certain conditions. For debug builds, we can speed up the build time significantly if we avoid the need for Binaryen passes. The most common required Binaryen pass is for legalizing function signatures involving 64 bit integer values. By opting into the WebAssembly BigInt integration using -sWASM_BIGINT we can avoid this.
$ emcc -sUSE_SDL=2 -g -O0 -o mandelbrot.html mandelbrot.cc -sALLOW_MEMORY_GROWTH -sWASM_BIGINT -sERROR_ON_WASM_CHANGES_AFTER_LINK
We have thrown in the -sERROR_ON_WASM_CHANGES_AFTER_LINK flag for good measure. It helps detect when Binaryen is running and rewriting the binary unexpectedly. This way, we can make sure that we're staying on the fast path.
Even though our example is fairly small, we can still see the effect of skipping Binaryen! According to time, this command runs just under 1s, so half a second faster than before!
Advanced tweaks
Skipping input file scanning
Normally when linking an Emscripten project, emcc will scan all of the input object files and libraries. It does this in order to implement precise dependencies between JavaScript library functions and native symbols in your program. For larger projects this extra scanning of input files (using llvm-nm) can add significantly to the link time.
It is possible to instead run with -sREVERSE_DEPS=all which tells emcc to include all possible native dependencies of JavaScript functions. This has a small code size overhead but can speed up link times and can be useful for debug builds.
For a project as small as our example this makes no real difference but if you have hundreds or even thousands of object files in your project it can meaningfully improve link times.
Stripping the “name” section
In large projects, especially those with a lot of C++ template usage, the WebAssembly “name” section can be very large. In our example it's only a tiny fraction of the overall file size (see the output of llvm-objdump above) but in some cases it can be very significant. If the “name” section of your application is very large, and the dwarf debug information is sufficient for your debugging needs, it can be advantageous to strip the “name” section:
$ emstrip --no-strip-all --remove-section=name mandelbrot.wasm
This will strip the WebAssembly “name” section while preserving the DWARF debug sections.
Debug fission
Binaries with lots of debug data don't just put pressure on the build time but also on the debugging time. The debugger needs to load the data and needs to build an index for it, so that it can quickly respond to queries, like "What's the type of the local variable x?".
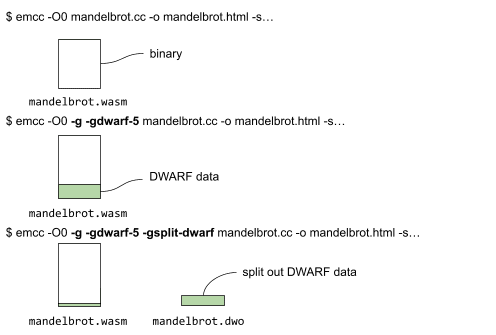
Debug fission allows us to split the debug information for a binary into two parts: one, that remains in the binary, and one, that is contained in a separate, so-called DWARF object (.dwo) file. It can be enabled by passing the -gsplit-dwarf flag to Emscripten:
$ emcc -sUSE_SDL=2 -g -gsplit-dwarf -gdwarf-5 -O0 -o mandelbrot.html mandelbrot.cc -sALLOW_MEMORY_GROWTH -sWASM_BIGINT -sERROR_ON_WASM_CHANGES_AFTER_LINK
Below, we show the different commands and what files are generated by compiling without debug data, with debug data, and finally with both debug data and debug fission.

When splitting the DWARF data, a portion of the debug data resides along with the binary, whereas the large part is put into the mandelbrot.dwo file (as illustrated above).
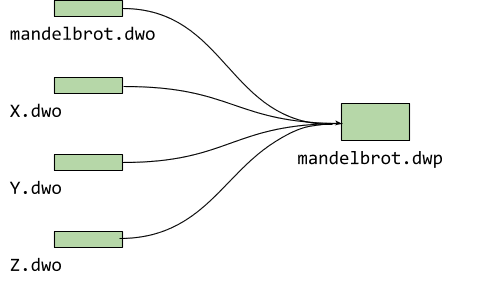
For mandelbrot we only have one source file, but generally projects are bigger than this and include more than one file. Debug fission generates a .dwo file for every one of them. For the current beta version of the debugger (0.1.6.1615) to be able to load this split debug information, we need to bundle all of those up into a so-called DWARF package (.dwp) like this:
$ emdwp -e mandelbrot.wasm -o mandelbrot.dwp

Building the DWARF package out of the individual objects has the advantage that you only need to serve one extra file! We're currently working on also loading all the individual objects in a future release.
What's with DWARF 5?
You might have noticed, we snuck another flag into the emcc command above, -gdwarf-5. Enabling version 5 of the DWARF symbols, which is currently not the default, is another trick to help us start debugging faster. With it, certain information is stored in the main binary that the default version 4 left out. Specifically, we can determine the full set of source files just from the main binary. This allows the debugger to do basic actions like showing the full source tree and setting breakpoints without loading and parsing the full symbol data. This makes debugging with split symbols a lot faster, so we're always using the -gsplit-dwarf and -gdwarf-5 command line flags together!
With the DWARF5 debug format we also get access to another useful feature. It introduces a name index in the debug data that will be generated when passing the -gpubnames flag:
$ emcc -sUSE_SDL=2 -g -gdwarf-5 -gsplit-dwarf -gpubnames -O0 -o mandelbrot.html mandelbrot.cc -sALLOW_MEMORY_GROWTH -sWASM_BIGINT -sERROR_ON_WASM_CHANGES_AFTER_LINK
During a debugging session, symbol lookups often happen by searching for an entity by name, e.g., when looking for a variable or a type. The name index accelerates this search by pointing directly to the compilation unit that defines that name. Without a name index, an exhaustive search of the entire debug data would be required to find the correct compilation unit that defines the named entity that we're looking for.
For the curious: Looking at the debug data
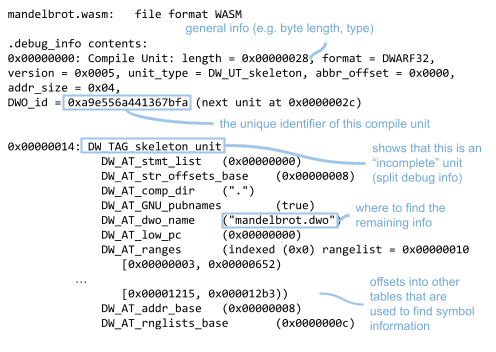
You can use llvm-dwarfdump in order to have a peek into the DWARF data. Let’s give this a try:
llvm-dwarfdump mandelbrot.wasm
This gives us an overview on the “Compile units” (roughly speaking, the source files) for which we have debug information. In this example, we only have the debug info for mandelbrot.cc. The general info will let us know that we have a skeleton unit, which just means that we have incomplete data on this file, and that there’s a separate .dwo file which contains the remaining debug info:

You can have a look also at other tables within this file, e.g. at the line table which shows the mapping of wasm bytecode to C++ lines (try using llvm-dwarfdump -debug-line).
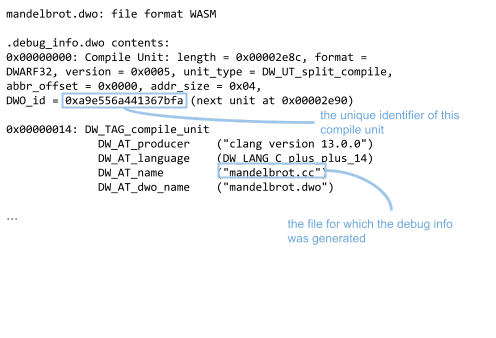
We can also have a look at the debug info that is contained in the separate .dwo file:
llvm-dwarfdump mandelbrot.dwo

TL;DR: What’s the advantage of using debug fission?
There are several advantages to splitting up the debug information if one is working with big applications:
Faster linking: The linker no longer needs to parse the entire debug information. Linkers usually need to parse the entire DWARF data that is in the binary. By stripping out large parts of the debug information into separate files, linkers deal with smaller binaries, which results in faster linking times (especially true for large applications).
Faster debugging: The debugger can skip parsing the additional symbols in
.dwo/.dwpfiles for some symbol lookups. For some lookups (such as requests on the line mapping of wasm-to-C++ files), we don’t need to look into the additional debug data. This saves us time, not needing to load the and parse the additional debug data.
1: If you don't have a recent version of llvm-objdump on your system, and you are using emsdk, you can find it in the emsdk/upstream/bin directory.
Download the preview channels
Consider using the Chrome Canary, Dev, or Beta as your default development browser. These preview channels give you access to the latest DevTools features, let you test cutting-edge web platform APIs, and help you find issues on your site before your users do!
Get in touch with the Chrome DevTools team
Use the following options to discuss the new features, updates, or anything else related to DevTools.
- Submit feedback and feature requests to us at crbug.com.
- Report a DevTools issue using the More options > Help > Report a DevTools issue in DevTools.
- Tweet at @ChromeDevTools.
- Leave comments on What's new in DevTools YouTube videos or DevTools Tips YouTube videos.


