Total Blocking Time (TBT) is one of the metrics tracked in the Performance section of the Lighthouse report. Each metric captures some aspect of page load speed.
The Lighthouse report displays TBT in milliseconds:

What TBT measures
TBT measures the total amount of time that a page is blocked from responding to user input, such as mouse clicks, screen taps, or keyboard presses. The sum is calculated by adding the blocking portion of all long tasks between First Contentful Paint and Time to Interactive. Any task that executes for more than 50 ms is a long task. The amount of time after 50 ms is the blocking portion. For example, if Lighthouse detects a 70 ms long task, the blocking portion would be 20 ms.
How Lighthouse determines your TBT score
Your TBT score is a comparison of your page's TBT time and TBT times millions of real sites when loaded on mobile devices. See How metric scores are determined to learn how Lighthouse score thresholds are set.
This table shows how to interpret your TBT score on mobile:
| TBT time (in milliseconds) |
Color-coding |
|---|---|
| 0–200 | Green (fast) |
| 200-600 | Orange (moderate) |
| Over 600 | Red (slow) |
This table shows how to interpret your TBT score on desktop:
| TBT time (in milliseconds) |
Color-coding |
|---|---|
| 0–150 | Green (fast) |
| 150-350 | Orange (moderate) |
| Over 350 | Red (slow) |
How to improve your TBT score
See What is causing my long tasks? to learn how to diagnose the root cause of long tasks with the Performance panel of Chrome DevTools.
In general, the most common causes of long tasks are:
- Unnecessary JavaScript loading, parsing, or execution. While analyzing your code in the Performance panel you might discover that the main thread is doing work that isn't really necessary to load the page. Reducing JavaScript payloads with code splitting, removing unused code, or efficiently loading third-party JavaScript should improve your TBT score.
- Inefficient JavaScript statements. For example, after analyzing your code in the Performance panel, suppose
you see a call to
document.querySelectorAll('a')that returns 2000 nodes. Refactoring your code to use a more specific selector that only returns 10 nodes should improve your TBT score.
How to improve your overall Performance score
Unless you have a specific reason for focusing on a particular metric, it's usually better to focus on improving your overall Performance score.
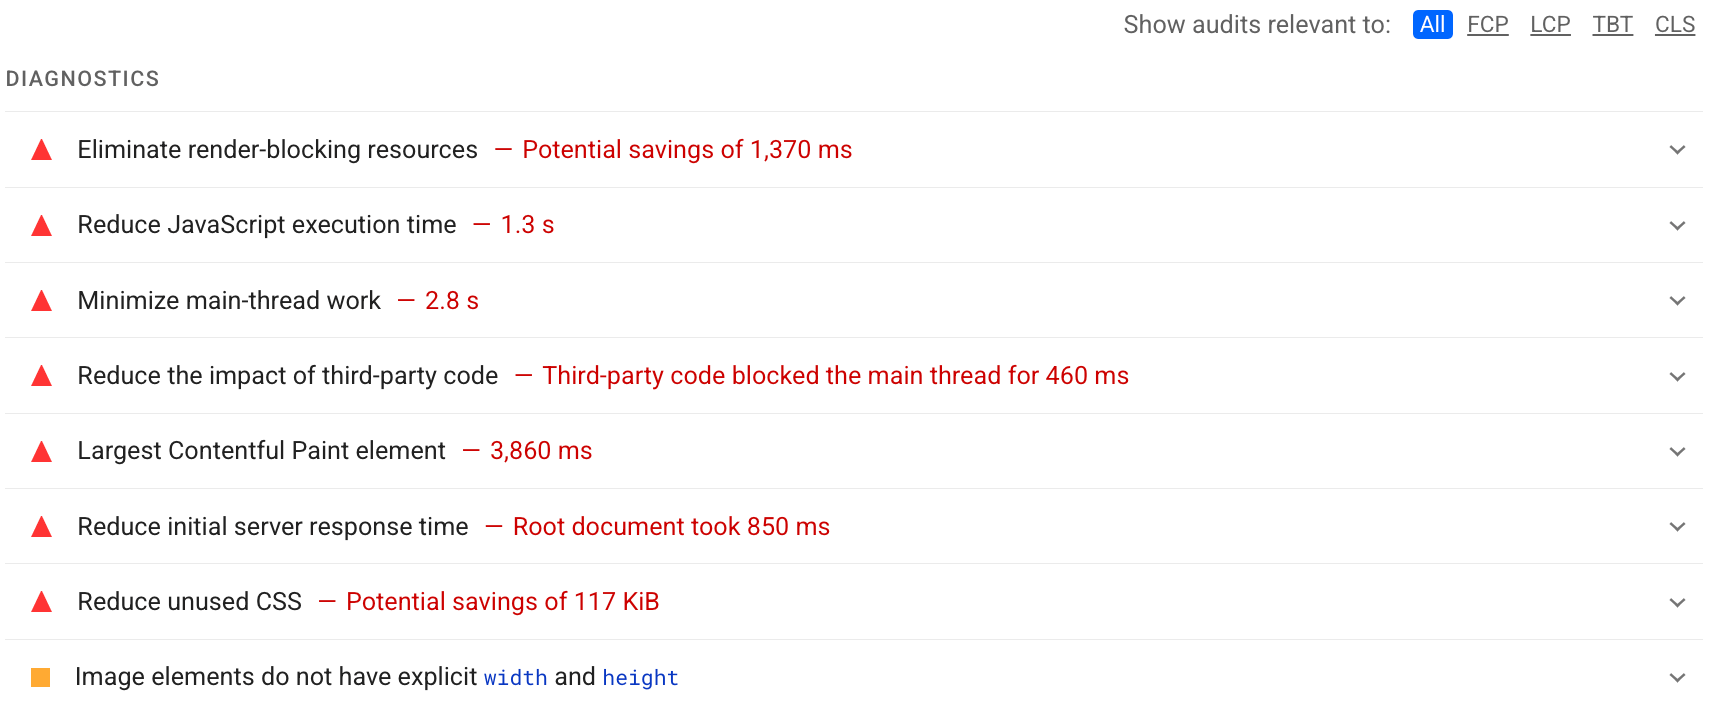
Use the Diagnostics section of your Lighthouse report to determine which improvements will have the most value for your page. The more significant the opportunity, the greater the effect it will have on your Performance score. For example, the following Lighthouse screenshot shows that eliminating render-blocking resources will yield the biggest improvement:

See the Performance audits to learn how to address the opportunities identified in your Lighthouse report.
