


Starting with the March 2024 dataset, the Chrome User Experience Report (CrUX) includes a navigation_types metric. This provides aggregated statistics about the navigation types of page loads for the dimension queried.
Different navigation types result in differences in performance metrics so when looking at the performance of your site, it's useful to understand the relative frequency of these different types. For example, when a navigation uses the back forward (bfcache), that usually results in a near-instant navigation, which is reflected in very small LCP and FCP metrics, and reduced CLS and INP metrics.
By exposing the navigation type breakdown, we hope to encourage site owners to be more aware of the navigation types used on their sites, and look to encourage some of the faster types by looking at caching setup, bfcache blockers, and prerendering.
The navigation_types metric is available in the daily CrUX API, the CrUX History API (with 3 weeks history available initially and increasing weekly to full coverage over the next 6 months), the latest CrUX BigQuery dataset, and the CrUX Dashboard. Having the history also lets site owners to view changes in navigation type usage over time. This can allow tracking of improvements (for example, removing bfcache blockage). It can also help explain changes in metrics even when no changes have been made to their sites.
What navigation types are available in CrUX?
CrUX distinguishes the following navigation types in the following table:
| Type | Description |
|---|---|
navigate |
A page load, which does not fit into any of the other categories. |
navigate_cache |
A page load for which the main resource (the main HTML document) was served from the HTTP cache. Sites often make use of caching for sub-resources, but the main HTML document is often cached considerably less. When it can be, it can result in noticeable performance improvements from being able to be cached locally and at a CDN. |
reload |
The user reloaded the page, either by hitting the reload button, by hitting enter in the address bar, or by undoing a tab close. Page reloads often result in revalidation back to the server to check if the main page has changed. A high percentage of page reloads may indicate frustrated users. |
restore |
The page was reloaded after a browser restart, or a tab that had been removed for memory reasons. For Chrome on Android, these are reported as reload instead. |
back_forward |
A history navigation, meaning that the page was seen and returned to recently. With correct caching, these should be reasonably fast experiences but still require the page to be processed and JavaScript to be executed—both of which the bfcache avoids. |
back_forward_cache |
A history navigation which was served from the bfcache. Optimizing your pages to take advantage of the bfcache should result in faster experiences. Sites should look to remove bfcache blockers to improve the percentage of navigations in this category. |
prerender |
The page was prerendered, which—similar to bfcache—can result in near-instant page loads. |
In some cases, a page load can be a combination of multiple navigation types. In that case, CrUX reports the first match in reverse order of the preceding table (from bottom to top).
Limitations of navigation types in CrUX
Since CrUX is a public dataset, its granularity of reporting is limited. For many origins and URLs, the navigation_types metric is not available due to insufficient eligible traffic. See the CrUX methodology for more information.
In addition, CrUX is not able to provide breakdowns of other metrics by navigation type, as this would further reduce the number of origins and URLs available in CrUX.
We recommend that sites implement their own Real User Monitoring (RUM) to be able to slice traffic by criteria such as the navigation types. Note that you may see differences in navigation types in these solutions depending on types reported, and which page views are included—see the article Why is CrUX data different from my RUM data?.
RUM can also provide a greater level of detail about specific performance issues. For example, while CrUX may imply that it would be worthwhile to improve bfcache eligibility, the bfcache notRestoredReasons API can inform exactly why a particular page load couldn't be served from the bfcache.
Navigation types in the CrUX API
To see the navigation types in the API, include the navigation_types metric in the request, or don't set a metric so that all metrics will be included:
export API_KEY="[YOUR_API_KEY]"
curl "https://chromeuxreport.googleapis.com/v1/records:queryRecord?key=$API_KEY" \
  --header 'Content-Type: application/json' \
  --data '{"origin": "https://example.com", metrics: ["navigation_types"]}'
The request format is described in more detail in the API documentation, including an explanation on how to get your API key, and the API guide. This will return an object like this:
{
  "record": {
    "key": {  "origin": "https://example.com" },
    "metrics": {
      "navigation_types": {
        "fractions": {
          "navigate": 0.5335,
          "navigate_cache": 0.2646,
          "reload": 0.0885,
          "restore": 0.0023,
          "back_forward": 0.0403,
          "back_forward_cache": 0.0677,
          "prerender": 0.0031
        }
      }
    },
    "collectionPeriod": {
      "firstDate": { "year": 2024, "month": 3, "day": 6 },
      "lastDate": { "year": 2024, "month": 4, "day": 2 }
    }
  }
}
In the response, CrUX reports the navigation_types metric as an object with the fractions of page loads for each of the navigation types. Each fraction is a value between 0.0 (indicating 0% of page loads) to 1.0, (indicating 100% of page loads) for the given key.
You can see from this response that for the collection period starting on March 6, 2024—up to and including April 2nd, 2024 - 6.77% of the navigations (page loads) were served from the browser's bfcache. Likewise, some of the other fractions can help identify opportunities for page loading optimizations. Note that for any given key (including a combination of a URL or origin and a form factor), the navigation_types fractions will add up to approximately 1.0.
Navigation types in the CrUX History API
The CrUX History API can provide a time-series for navigation types with up to 25 data points per fraction, which allows visualizing these fractions over time. To change your request from the CrUX API to CrUX History API, run it against the queryHistoryRecord endpoint instead of queryRecord. For example, our CrUX History Colab plots the navigation_types metric as stacked bars:
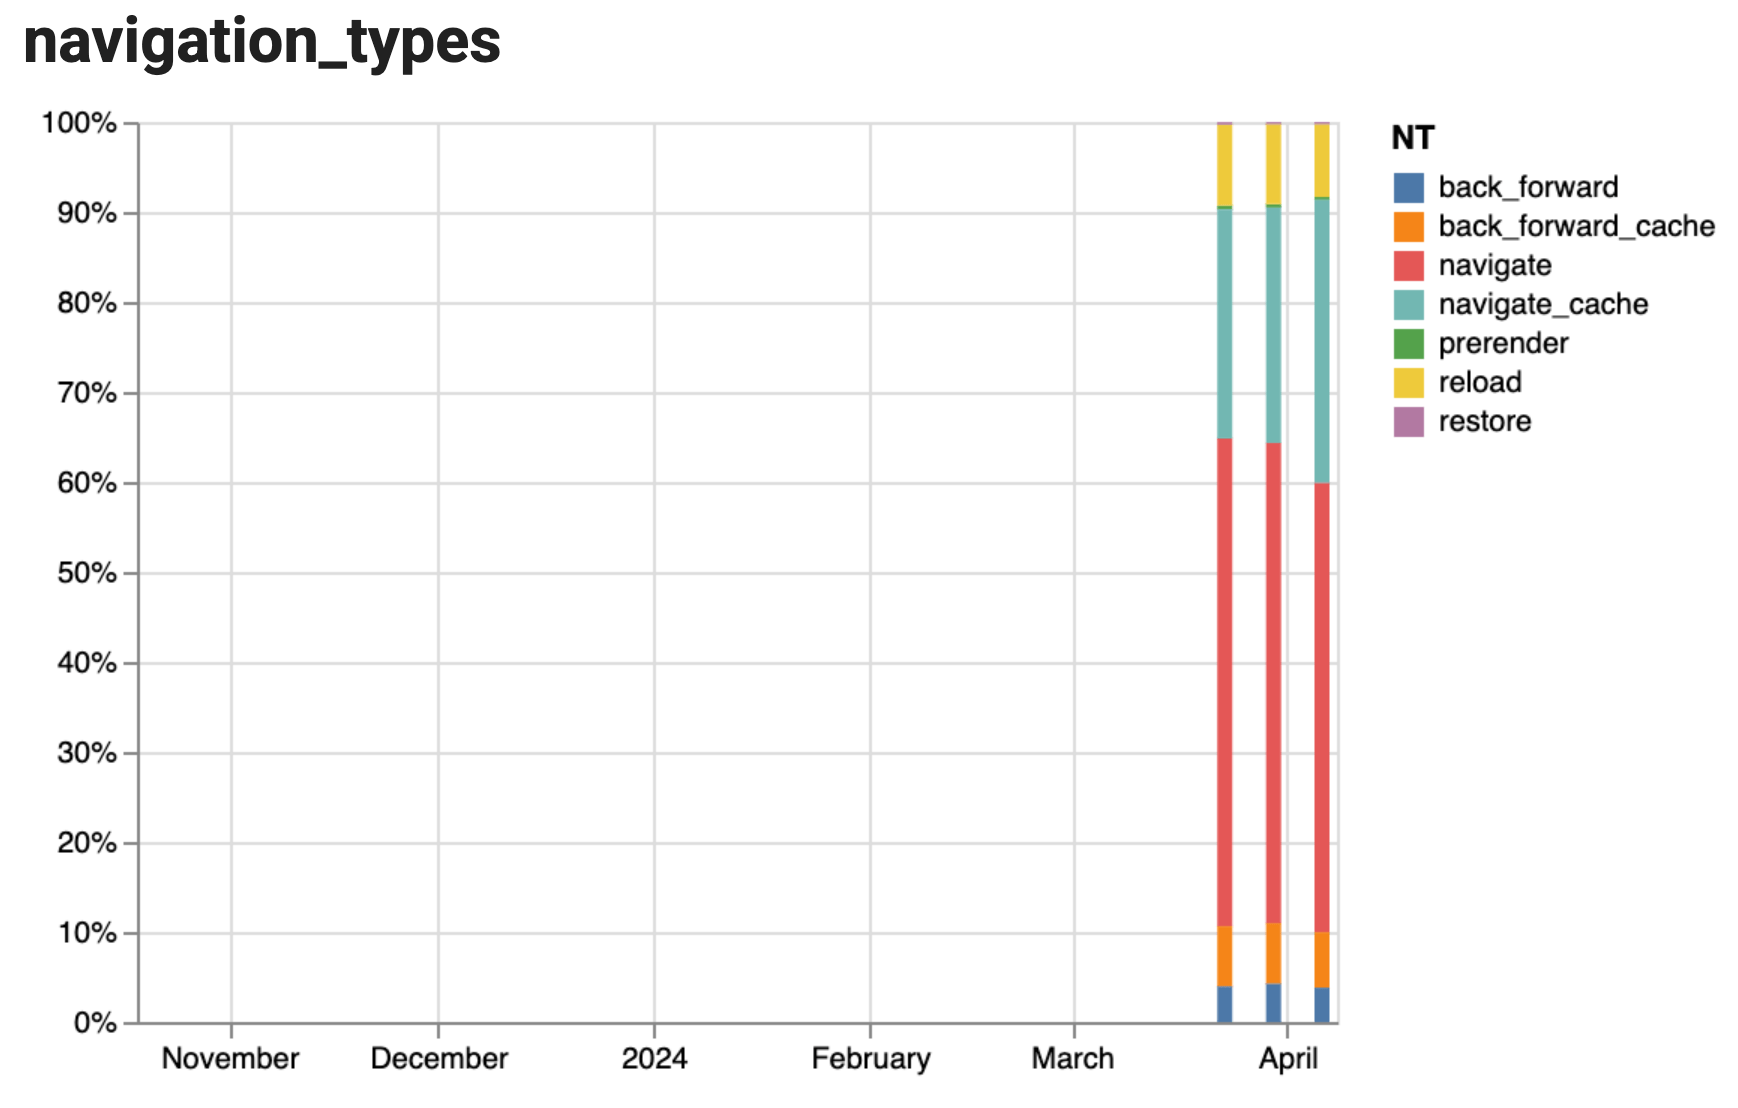
In the preceding screenshot, history is only available for 3 collection periods (28 days each, 7 days apart). Once fully populated, this will cover all 25 collection periods. Visualizing this history makes it possible to confirm that optimizations have taken effect or have regressed. This is especially true for HTTP cache configuration, optimizing a page for bfcache and prerendering.
Navigation types in CrUX BigQuery
The CrUX BigQuery tables now include a navigation_type record, made of each type, while the summary materialized views include multiple navigation_types_* columns—one for each type.
Detailed tables
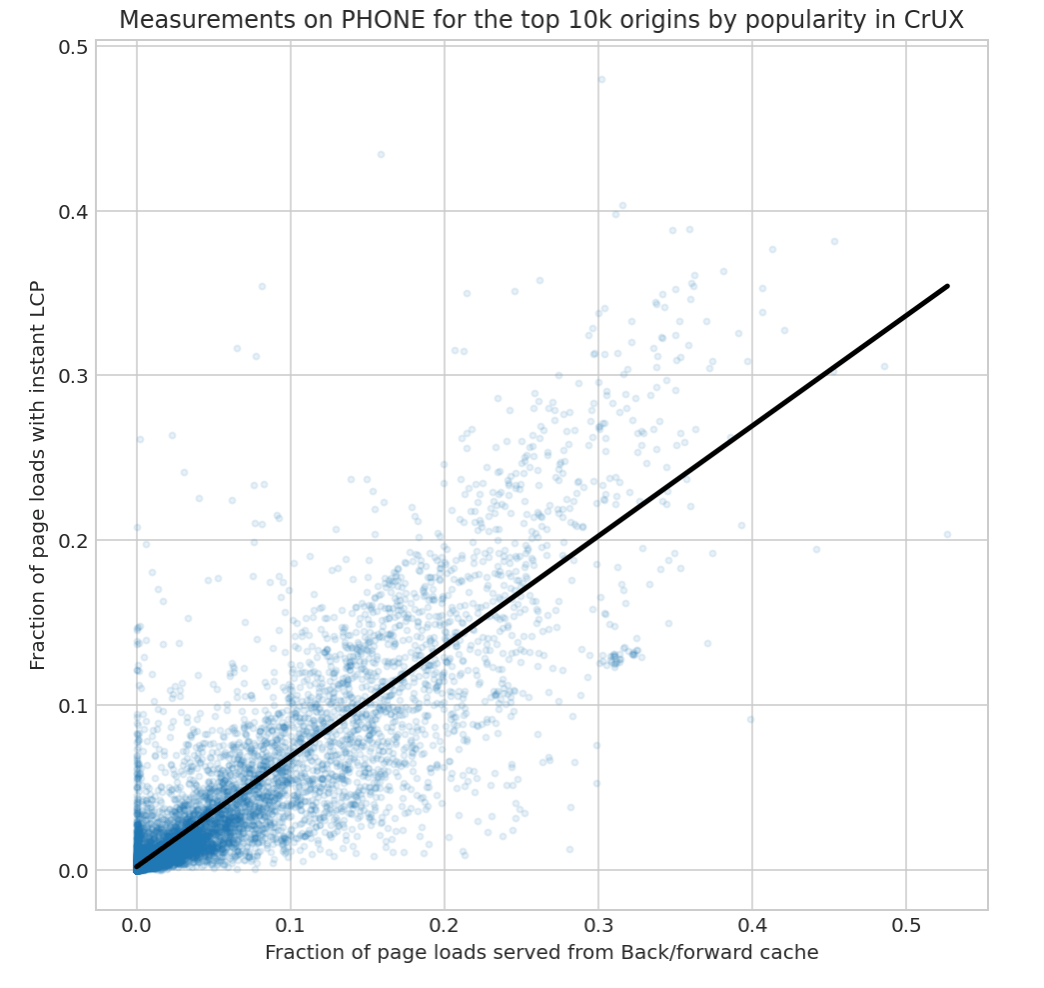
The detailed table schema in CrUX BigQuery provides detailed histograms for the web performance metrics, which allow us to show in this example analysis how particular navigation types may be correlated with instant or good loading performance.
As an example, we looked at the back_forward_cache fraction and its correlation with how frequently pages loaded instantly (instant_lcp_density defined as LCP <= 200ms) and how frequently good LCP was seen (good_lcp_density defined as LCP <= 2500ms). We observed a strong statistical correlation between back_forward_cache and instant_lcp_density (ρ=0.87)—shown in the following plot—and a moderate correlation between back_forward_cache and good_lcp_density (ρ=0.29).
The Colab for this analysis is well commented; here, we only discuss the query which extracts the navigation_types fractions for the 10k most popular origins from the detailed tables in CrUX BigQuery:
- We access the
all.202403table here (see theFROM-clause), and filterform_factorforphoneand select origins with popularity rank <= 10000 for the top 10k most popular origins (see theWHEREclause). - When querying the
navigation_typesmetric in BigQuery, it's necessary to divide by the total of thenavigation_typesfractions, as they will only add up per origin, but not per (origin, form factor) combination. - Not all origins will have
navigation_types, so it's good practice to useSAVE_DIVIDE.
WITH tmp AS (
  SELECT
    origin,
    SUM(navigation_types.navigate.fraction) AS navigate,
    SUM(navigation_types.navigate_cache.fraction) AS navigate_cache,
    SUM(navigation_types.reload.fraction) AS reload,
    SUM(navigation_types.restore AS restore,
    SUM(navigation_types.back_forward.fraction) AS back_forward,
    SUM(navigation_types.back_forward_cache.fraction) AS back_forward_cache,
    SUM(navigation_types.prerender.fraction) AS prerender,
    SUM(navigation_types.navigate.fraction
      + navigation_types.navigate_cache.fraction
      + navigation_types.reload.fraction
      + navigation_types.restore.fraction
      + navigation_types.back_forward.fraction
      + navigation_types.back_forward_cache.fraction
      + navigation_types.prerender.fraction) AS total
  FROM
    `chrome-ux-report.all.202403`
  WHERE
    experimental.popularity.rank <= 10000 AND
    form_factor.name = 'phone'
  GROUP BY
    origin
)

SELECT
  origin,
  ROUND(SAFE_DIVIDE(navigate, total), 4) AS navigate,
  ROUND(SAFE_DIVIDE(navigate_cache, total), 4) AS navigate_cache,
  ROUND(SAFE_DIVIDE(reload, total), 4) AS reload,
  ROUND(SAFE_DIVIDE(restore, total), 4) AS restore,
  ROUND(SAFE_DIVIDE(back_forward, total), 4) AS back_forward,
  ROUND(SAFE_DIVIDE(back_forward_cache, total), 4) AS back_forward_cache,
  ROUND(SAFE_DIVIDE(prerender, total), 4) AS prerender
FROM
  tmp
Materialized tables
When a summary is sufficient, it is often more expedient (and cheaper) to query the materialized tables instead. For example, the following query extracts the available navigation_types data from the chrome-ux-report.materialized.device_summary table. This table is keyed by month, origin and device type.
SELECT
  yyyymm,
  device,
  navigation_types_navigate,
  navigation_types_navigate_cache,
  navigation_types_reload,
  navigation_types_restore,
  navigation_types_back_forward,
  navigation_types_back_forward_cache,
  navigation_types_prerender
FROM
  chrome-ux-report.materialized.device_summary
WHERE
  origin = 'https://example.com' AND
  navigation_types_navigate IS NOT NULL
ORDER BY
  yyyymm DESC,
  device DESC
Note that these fractions won't add up to 1.0 per row, so it's necessary to divide each fraction by the sum of the results that the query is to be interpreted over.
The reason for this is that navigation_type fractions in chrome-ux-report.materialized.device_summary—like histogram densities—add up to 1.0 per origin instead of per origin and device per date. This lets you view navigation type distribution across devices:
SELECT
  device,
  navigation_types_back_forward
FROM
  chrome-ux-report.materialized.device_summary
WHERE
  origin = 'https://www.google.com' AND
  yyyymm = 202403
device |
navigation_types_back_forward |
|---|---|
phone |
0.0663 |
desktop |
0.0179 |
tablet |
0.0009 |
In this query result, the fractions reflect the percentage of the page loads for the origin https://www.google.com: 6.63% of these page loads had the navigation type back_forward on phone, 1.79% desktop, and 0.09% tablet.
The considerably higher back_forward percentage on phone suggests we could try to optimize these page loads so that they can be served from bfcache.
However, it is also important to consider what fraction of page loads is already served by the bfcache—that is, the bfcache hit rate. The following query suggests that this particular origin may already be well optimized, given its > 60% hit rates for phone and desktop.
SELECT
  device,
  navigation_types_back_forward_cache /
    (navigation_types_back_forward + navigation_types_back_forward_cache)
    AS back_forward_cache_hit_rate
FROM
  chrome-ux-report.materialized.device_summary
WHERE
  origin = 'https://www.google.com' AND
  yyyymm = 202403
device |
back_forward_cache_hit_rate |
|---|---|
phone |
0.6239 |
desktop |
0.6805 |
tablet |
0.7353 |
So it would appear the high back_forward rate on phones is not due to less bfcache usage, but more of a reflection of how users navigate back and forwards more on phones.
Navigation types in the CrUX Dashboard
The easiest way to see navigation types is in the CrUX Dashboard, which can be accessed for an origin from this link. As you can see from the following screenshot only one month's worth of data is initially available but over time the history will fill up letting you see changes in types month on month.
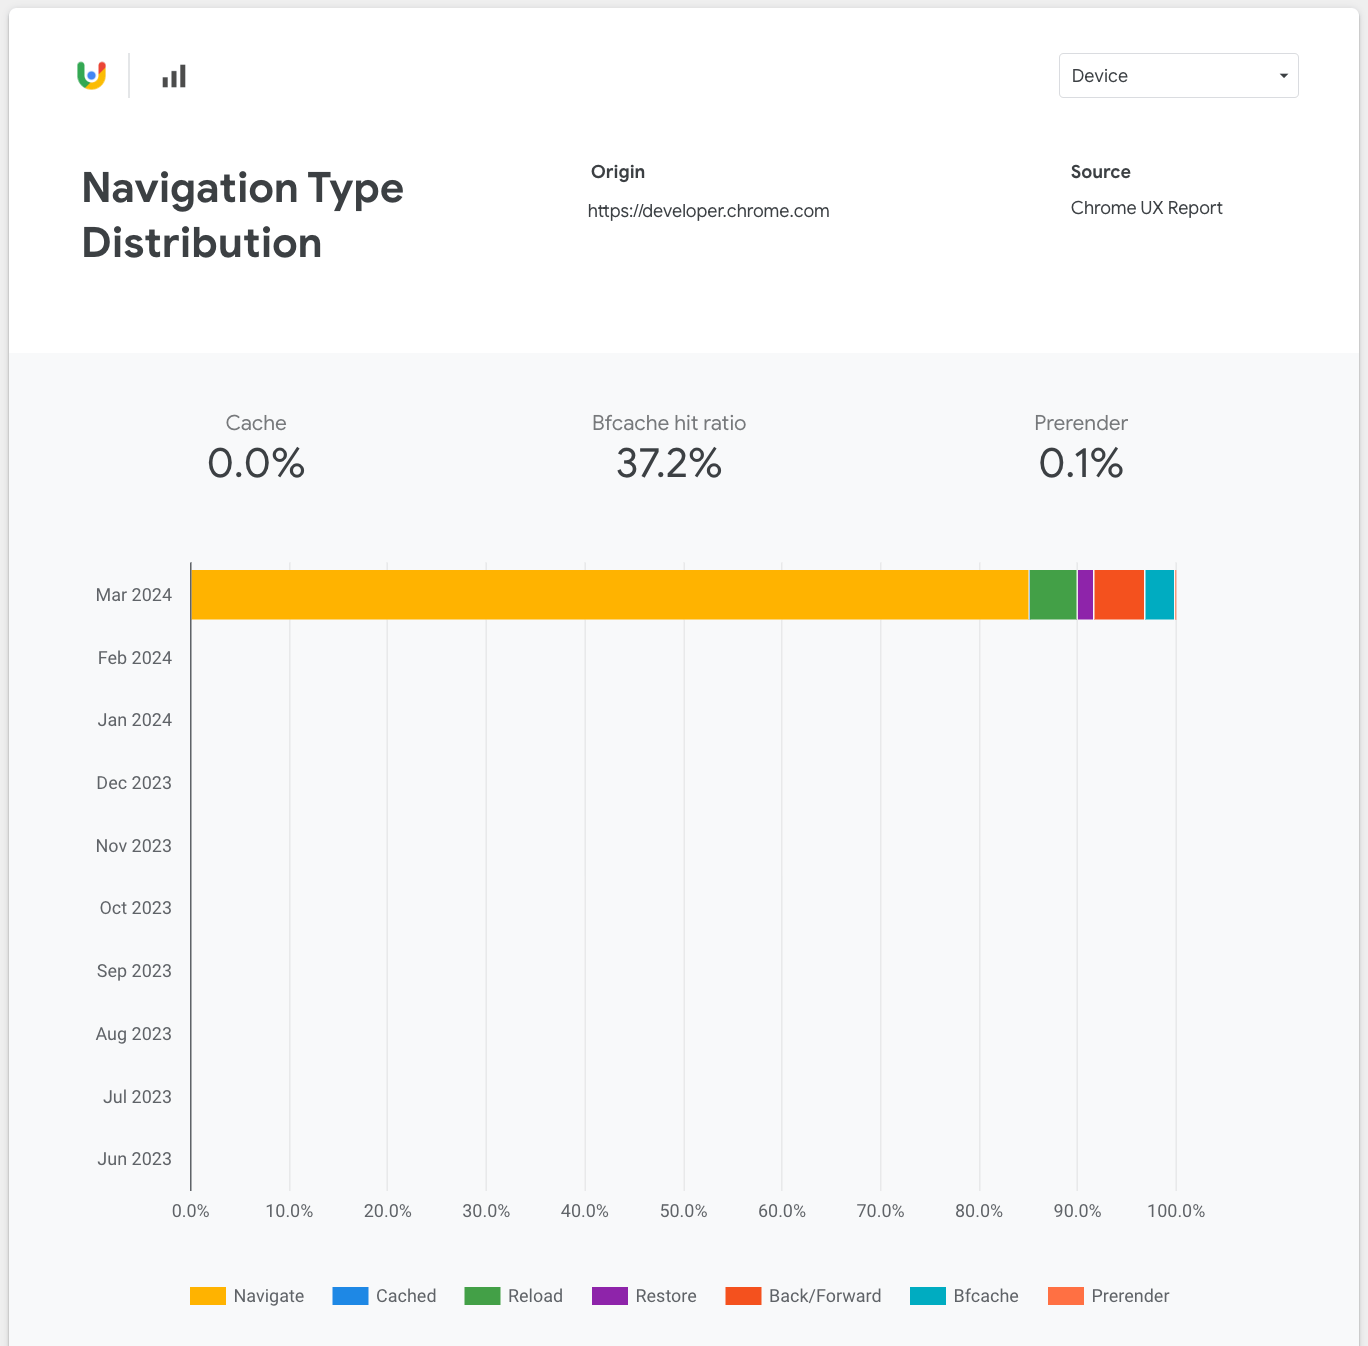
As you can also see, we have highlighted the faster navigation types, that sights should seek to optimize, at the top of this page of the Dashboard.
Conclusion
We hope you find the navigation type breakdowns in CrUX useful and that it helps you understand and optimize your site's performance. By ensuring efficient use of HTTP caching, the bfcache, and prerendering, sites can achieve much faster page loads than page loads that require trips back to the server.
We are also pleased to make the data available in all the various CrUX access points so users can consume the data as they want and see the type breakdowns by URL for those that are exposed in the CrUX APIs.
We would love to hear feedback on this addition to CrUX on social media or on the CrUX discussion group.