Mathias Bynens

Peter Kvitek
Because Chrome is effectively invisible in Headless mode, it might sound tricky to solve an issue. It's possible to debug Headless Chrome in a way that's very similar to headful Chrome.
Launch Chrome in Headless mode with the
--remote-debugging-port command-line flag.
chrome --headless --remote-debugging-port=0 https://developer.chrome.com/
This prints a unique WebSocket URL to stdout, for example:
DevTools listening on ws://127.0.0.1:60926/devtools/browser/b4bd6eaa-b7c8-4319-8212-225097472fd9
In a headful Chrome instance, we can then use Chrome DevTools remote debugging to connect to the Headless target and inspect it.
- Go to
chrome://inspectand click the Configure… button. - Enter the IP address and port number from the WebSocket URL, for example,
127.0.0.1:60926. - Click Done. You should see a Remote Target appear with all its tabs and other targets listed.
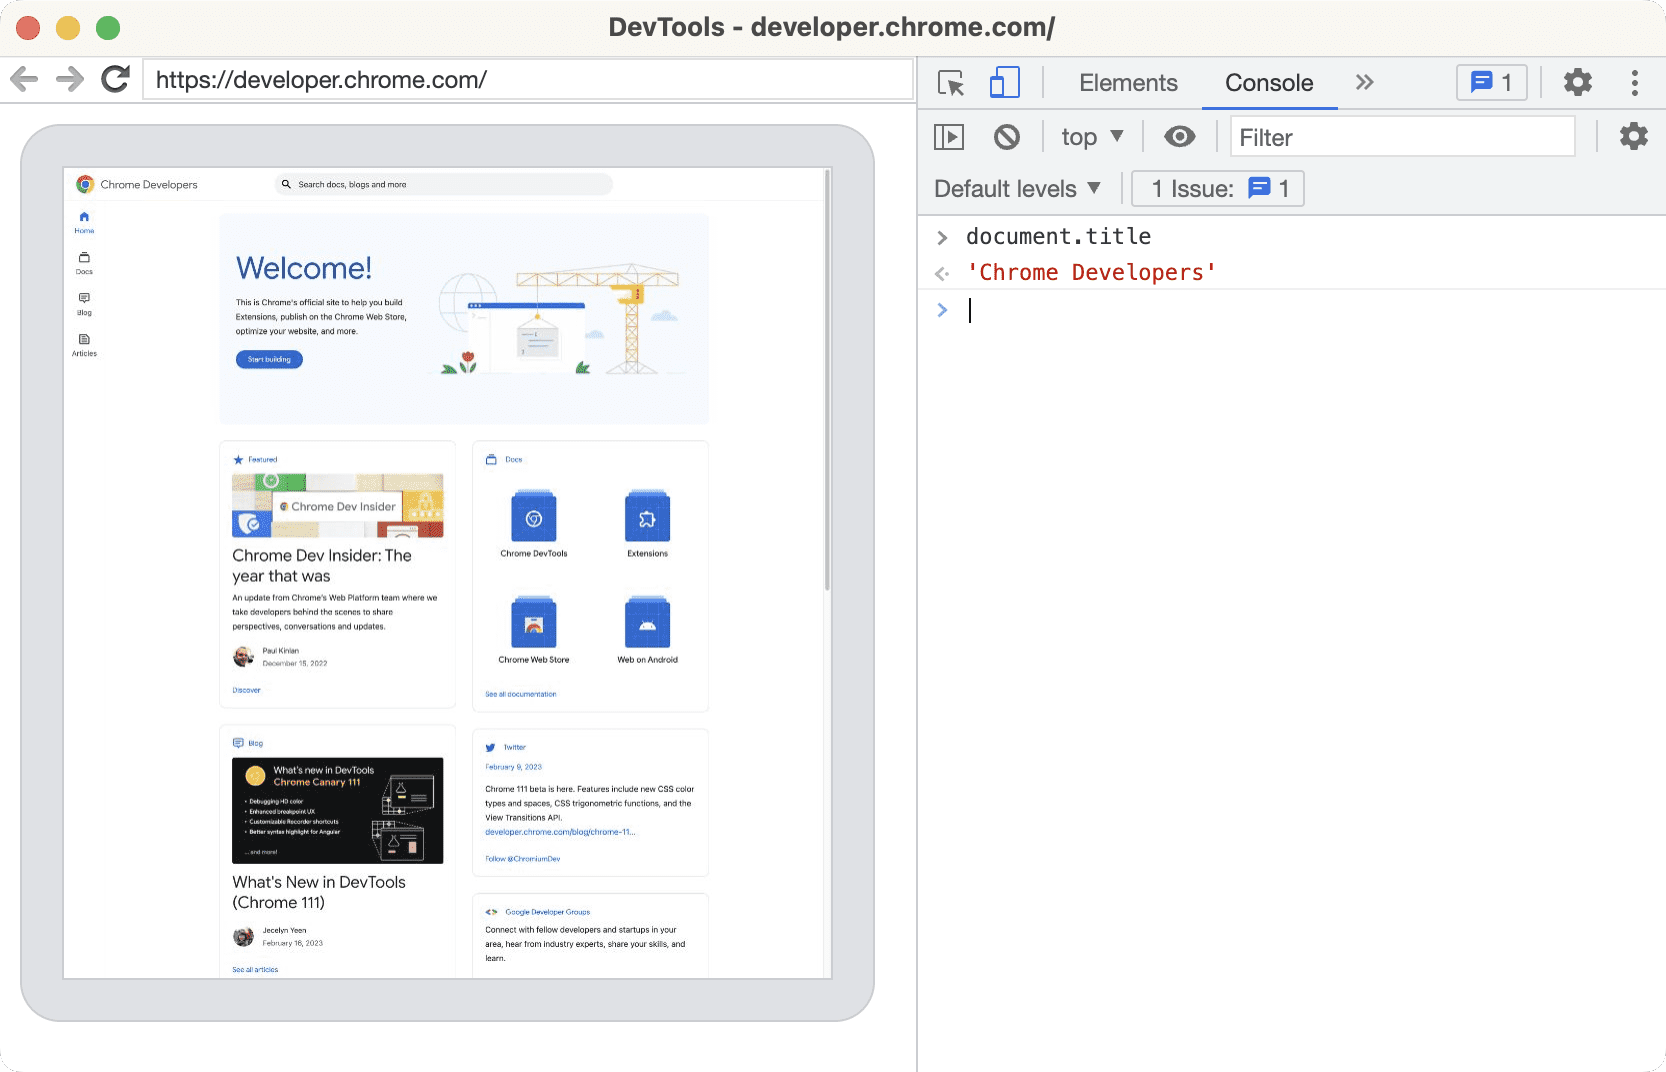
- Click inspect to access to Chrome DevTools and inspect the remote Headless target, including a live view of the page.