Extensions can access the same Chrome DevTools as web pages. To become an expert in debugging extensions, you will need to know how to locate logs and errors of the different extension components. This tutorial provides fundamental techniques for debugging your extension.
Before you begin
This guide assumes that you have basic web development experience. We recommend reading Development Basics for an introduction to the extension development workflow. Design the user interface gives you an introduction to the user interface elements available in extensions.
Break the extension
This tutorial will break one extension component at a time and then demonstrate how to fix it. Remember to undo the bugs introduced in one section before continuing to the next section. Start by downloading the Broken Color sample on GitHub.
Debug the manifest
First, let's break the manifest file by changing the "version" key to "versions":
manifest.json:
{
  "name": "Broken Background Color",
  "version": "1.0",
  "versions": "1.0",
  "description": "Fix an Extension!",
  ...
}
Now let's try loading the extension locally. You will see an error dialog box pointing to the problem:
Failed to load extension
Required value version is missing or invalid. It must be between 1-4 dot-separated integers each between 0 and 65536.
Could not load manifest.

When a manifest key is invalid the extension fails to load, but Chrome gives you a hint of how to fix the problem.
Undo that change and enter an invalid permission to see what happens.
Change the "activeTab" permission to lowercase "activetab":
manifest.json:
{
  ...
  "permissions": ["activeTab", "scripting", "storage"],
  "permissions": ["activetab", "scripting", "storage"],
  ...
}
Save the extension and try loading it again. It should load successfully this time. In the extension Management page you will see three buttons: Details, Remove and Errors. The Errors button label turns red when there's an error. Click the Errors button to see the following error:
Permission 'activetab' is unknown or URL pattern is malformed.

Before moving on, change the permission back, click Clear all in the upper right-hand corner to clear the logs, and reload the extension.

Debug the service worker
Locating logs
The service worker sets the default color to storage and logs it to the console. To view this log, open the Chrome DevTools panel by selecting the blue link next to Inspect views.

Locating errors
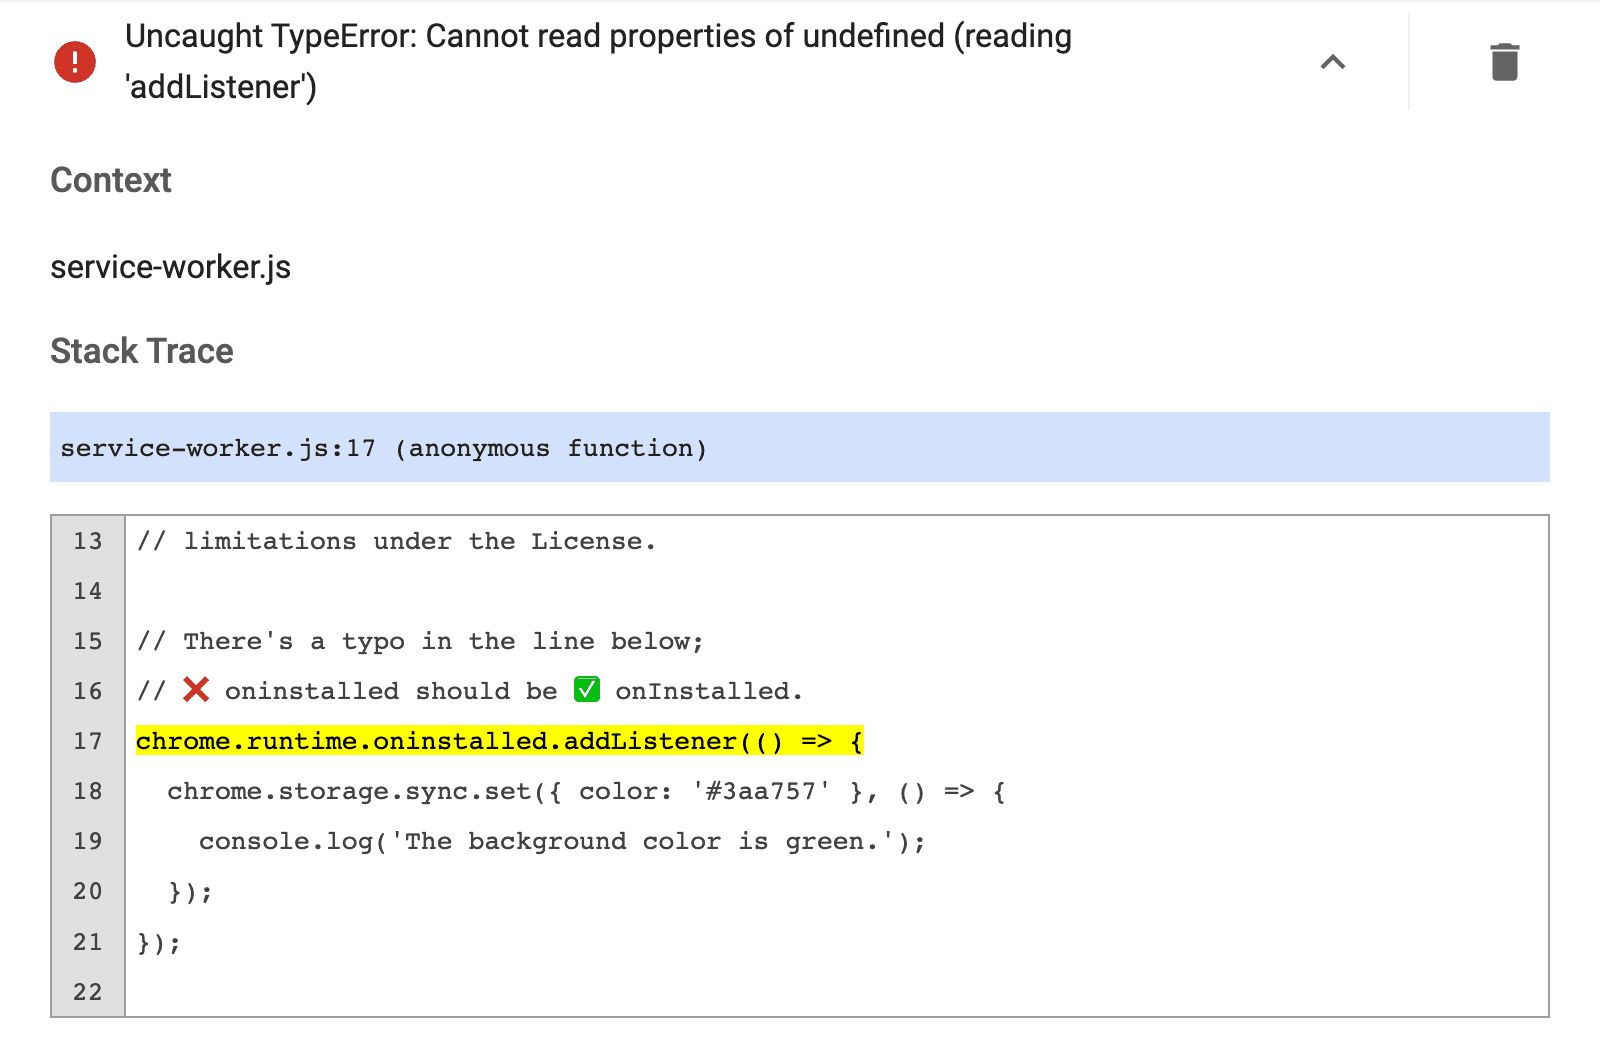
Let's break the service worker by changing onInstalled to lowercase oninstalled:
service-worker.js:
// There's a typo in the line below;
// ❌ oninstalled should be ✅ onInstalled.
chrome.runtime.onInstalled.addListener(() => {
chrome.runtime.oninstalled.addListener(() => {
  chrome.storage.sync.set({ color: '#3aa757' }, () => {
    console.log('The background color is green.');
  });
});
Refresh and click Errors to view the error log. The first error lets you know that the service worker failed to register. This means something went wrong during initiation:
Service worker registration failed. Status code: 15.

The actual error comes after:
Uncaught TypeError: Cannot read properties of undefined (reading 'addListener')

Undo the bug we introduced, click Clear all in the upper right-hand corner, and reload the extension.
Check the service worker status
You can identify when the service worker wakes up to perform tasks by following these steps:
- Copy your extension ID located above "Inspect views".

Extension ID in the Extensions Management page. Open your manifest file in the browser. For example:
chrome-extension://YOUR_EXTENSION_ID/manifest.jsonInspect the file.
Navigate to the Application panel.
Go to the Service Workers pane.
To test your code, start or stop the service worker using the links next to status.

Debug the popup
Now that the extension initializes correctly, let's break the popup by commenting out the highlighted lines below:
popup.js:
...
changeColorButton.addEventListener('click', (event) => {
  const color = event.target.value;

  // Query the active tab before injecting the content script
  chrome.tabs.query({ active: true, currentWindow: true }, (tabs) => {
    // Use the Scripting API to execute a script
    chrome.scripting.executeScript({
      target: { tabId: tabs[0].id },
      args: [color],
      func: setColor
    });
  });
});
Navigate back to the Extensions Management page. The Errors button reappears. Click it to view the new log. It shows the following error message:
Uncaught ReferenceError: tabs is not defined

You can open the popup's DevTools by inspecting the popup.

The error, tabs is undefined, says the extension doesn't know where to inject the content script.
Correct this by calling tabs.query(), then selecting the active tab.
To update the code, click the Clear all button in the upper right-hand corner, and then reload the extension.
Debug content scripts
Now let's break the content script by changing the variable "color" to "colors":
content.js:
...
function setColor(color) {
  // There's a typo in the line below;
  // ❌ colors should be ✅ color.
  document.body.style.backgroundColor = color;
  document.body.style.backgroundColor = colors;
}
Refresh the page, open the popup and click the green box. Nothing happens.
If you go to the Extensions Management page the Errors button does not appear. This is because only runtime errors, console.warning and,
console.error are recorded on the Extensions Management page.
Content scripts run inside a website. So to find these errors we must inspect the web page the extension is trying to alter:
Uncaught ReferenceError: colors is not defined

To use DevTools from within the content script, click the dropdown arrow next to top and select the extension.

The error says colors is not defined. The extension must not be passing the variable correctly.
Correct the injected script to pass the color variable into the code.
Monitor network requests
The popup often makes all of the required network requests before even the speediest of developers can open DevTools. To view these requests, refresh from inside the network panel. It reloads the popup without closing the DevTools panel.

Declare permissions
Some extension APIs require permissions. Refer to the permissions article and the Chrome APIs to ensure an extension is requesting the correct permissions in the manifest.
  {
    "name": "Broken Background Color",
    ...
    "permissions": [
      "activeTab",
      "declarativeContent",
      "storage"
    ],
  ...
  }
Further reading
Learn more about Chrome Devtools by reading the documentation.
