Time to Interactive (TTI) is one of six metrics tracked in the Performance section of the Lighthouse report. Each metric captures some aspect of page load speed.
Measuring TTI is important because some sites optimize content visibility at the expense of interactivity. This can create a frustrating user experience: the site appears to be ready, but when the user tries to interact with it, nothing happens.
Lighthouse displays TTI in seconds:

What TTI measures
TTI measures how long it takes a page to become fully interactive. A page is considered fully interactive when:
- The page displays useful content, which is measured by the First Contentful Paint,
- Event handlers are registered for most visible page elements, and
- The page responds to user interactions within 50 milliseconds.
How Lighthouse determines your TTI score
The TTI score is a comparison of your page's TTI and the TTI for real websites, based on data from the HTTP Archive. For example, sites performing in the ninety-ninth percentile render TTI in about 2.2 seconds. If your website's TTI is 2.2 seconds, your TTI score is 99.
This table shows how to interpret your TTI score:
| TTI metric (in seconds) |
Color-coding |
|---|---|
| 0–3.8 | Green (fast) |
| 3.9–7.3 | Orange (moderate) |
| Over 7.3 | Red (slow) |
How to improve your TTI score
One improvement that can have a particularly big effect on TTI is deferring or removing unnecessary JavaScript work. Look for opportunities to optimize your JavaScript. In particular, consider reducing JavaScript payloads with code splitting and applying the PRPL pattern. Optimizing third-party JavaScript also yields significant improvements for some sites.
These two Diagnostic audits provide additional opportunities to reduce JavaScript work:
Tracking TTI on real users' devices
To learn how to measure when TTI actually occurs on your users' devices, see Google's User-centric Performance Metrics page. The Tracking TTI section describes how to programmatically access TTI data and submit it to Google Analytics.
How to improve your overall Performance score
Unless you have a specific reason for focusing on a particular metric, it's usually better to focus on improving your overall Performance score.
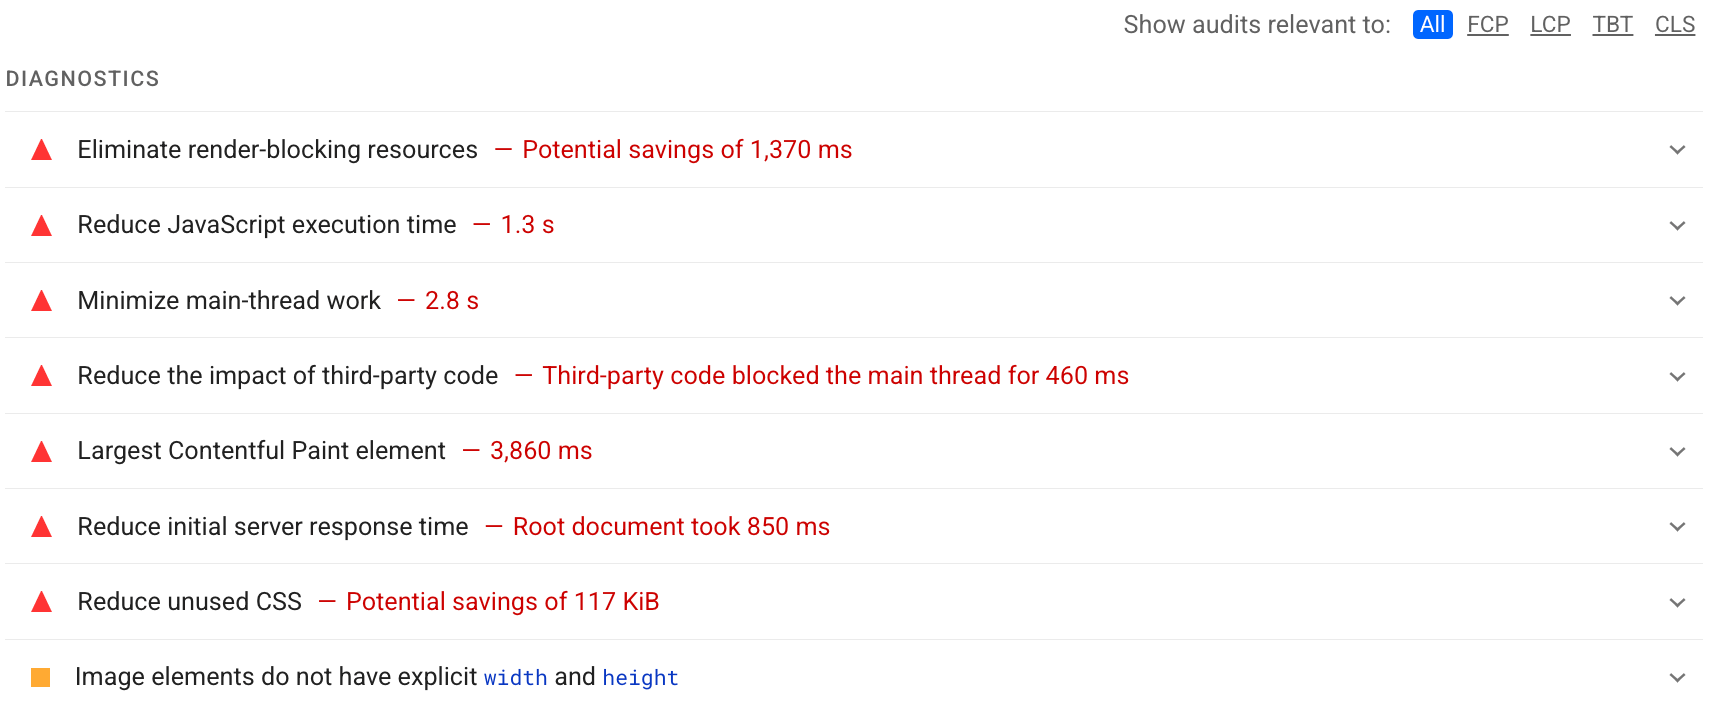
Use the Diagnostics section of your Lighthouse report to determine which improvements will have the most value for your page. The more significant the opportunity, the greater the effect it will have on your Performance score. For example, the following Lighthouse screenshot shows that eliminating render-blocking resources will yield the biggest improvement:

See the Performance audits to learn how to address the opportunities identified in your Lighthouse report.
