

Published: September 15, 2026
This document details the measurement methodology used to measure CrUX ad metrics which consists of Ad Count, Ad Density, Ad Weight: CPU, and Ad Weight: Network.
Measurement lifecycle
Chrome tracks ad experience metrics across a lifecycle from the start of the page load until the tab is unloaded.
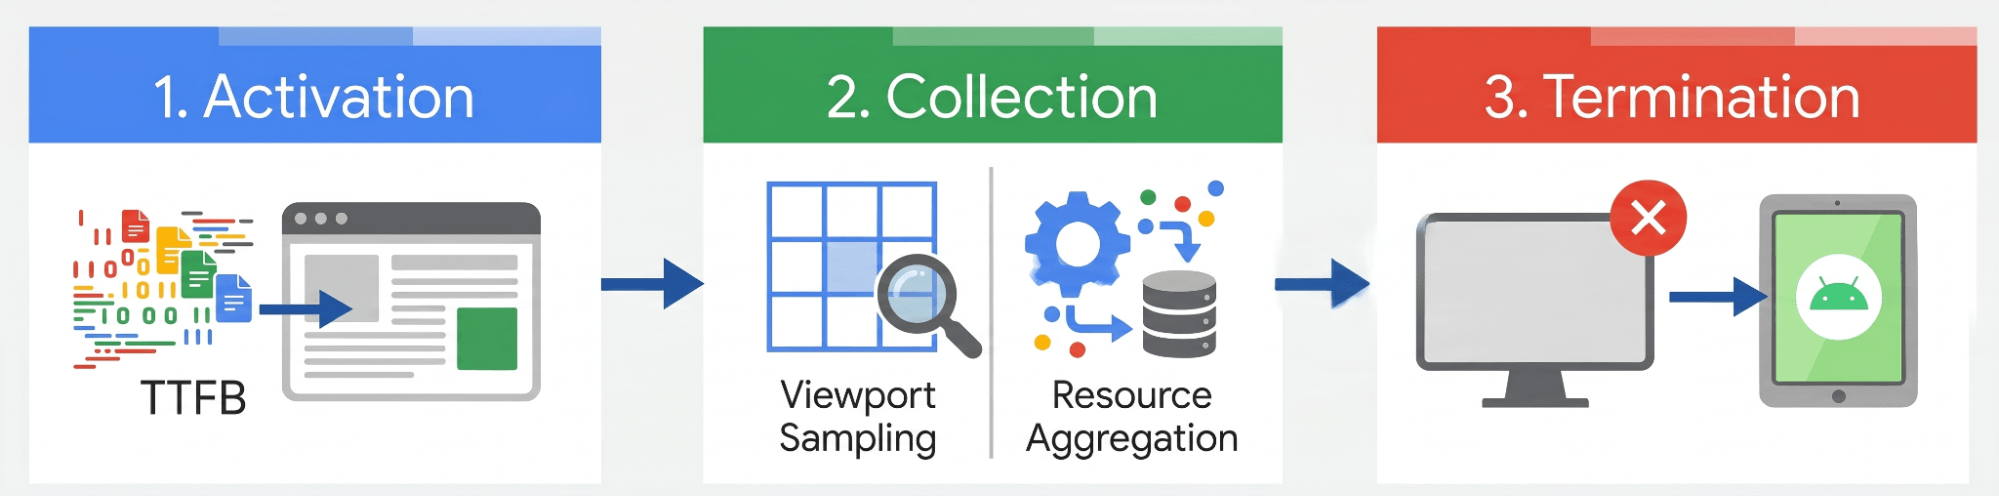
The measurement lifecycle consists of three phases:
- Activation: Chrome begins measuring ad metrics when the browser receives the first response bytes (time-to-first-byte or TTFB) for the main HTML document.
- Collection: For average Ad Count and Ad Density, Chrome performs viewport sampling. For cumulative CPU and network resource usage, the browser aggregates the values throughout the duration of the user's session.
- Termination: Telemetry collection ends when the page is unloaded (due to hard navigation, tab closure, or browser termination). On Android, collection also terminates if the browser app is backgrounded.
Reporting scope
Chrome's ad detection is most reliable on sites with recognizable advertising partners. To support the quality of the metrics reported in CrUX, we include only those sites that list at least one authorized seller in their ads.txt. Origins with no ads.txt, or those containing only a placeholder record, are excluded from CrUX ad metrics reporting.
Local ad metrics in DevTools
The ads.txt filtering occurs during CrUX data aggregation, not within the browser. As a result, the Chrome DevTools Ads panel attempts to display ad metrics locally for any page you inspect, even on sites without an ads.txt file or without authorized sellers declared. As explained before, these local measurements will only be included in CrUX aggregate reports if the site maintains an ads.txt file with authorized sellers.
The 75th percentile (p75)
Chrome reports the 75th percentile (p75) of the ad metrics, which indicates that 75% of all user sessions on the page experienced that metric value or better.
For example, if the reported Ad Density of p75 is 23% (or "23"), it means that 75% of all visits to that site had an Ad Density of 23% or less, while 25% of visits experienced a higher Ad Density. Similarly, if the reported Ad Count of p75 is "3.00", it means 75% of sessions had 3 or fewer ads in the viewport at any given sample point.
Chrome uses the 75th percentile rather than averages to prevent outliers from skewing the data. The skew can come from outliers, such as a user on a slow connection or a page layout with heavy scripts, whereas percentiles show the distribution of user experiences.
Visual measurement
- Viewport sampling: To calculate Ad Count and Ad Density, Chrome samples the viewport once per second, and takes a snapshot. An ad is considered visible if any of its pixels are inside the viewport at the exact moment of the 1-second sample point.
- Overlapping ads:
- For Ad Density, if multiple ads overlap, the overlapping area is counted only once by calculating the union of the ad areas.
- For Ad Count, each ad is counted individually if at least one of its pixels is in the viewport, even if it is partially or fully overlapped by another ad.
- Partial visibility:
- For Ad Density, only the portion of the ad that is physically inside the viewport at the sample point is measured.
- For Ad Count, an ad is included in the count if at least one pixel of the ad element is inside the viewport at the sample point.
- Dynamic viewports on mobile: On mobile, browser interface elements like the address bar may show or hide as the user scrolls, changing the height of the visible area. Chrome uses the actual viewport dimensions at the exact moment of each 1-second sample.
- Non-rendering ads: Ads that are not rendered (such as those with
display: none) have no layout footprint, and are excluded from both count and density calculations. CPU and network ad weights are still measured.
Scrolling and navigation behaviors
User interactions and site behaviors, such as infinite scrolling, single-page application (SPA) routing, and backgrounding, can affect the ad metric measurement lifecycle.
Infinite scrolling
On a site with infinite scrolling, the sampling engine continues to collect viewport samples while the page is active. If a user idles at the bottom of a long page, the stream of identical samples will continue to be added to the session average. This may skew the overall session average depending on the duration of the idle state.
Single-page applications
On single-page application (SPA) sites using client-side routing, soft navigations don't reset the collection window. Metrics accumulate continuously for the entire lifespan of the tab until a hard navigation or tab closure occurs.
All layout samples collected using viewport sampling across all soft-navigated views within the session are averaged together into a single, cumulative session score. This behavior is similar to how Core Web Vitals metrics are aggregated over the entire lifespan of a page view without resetting on client-side client-routed transitions.
This will likely change in the near future. For more details, see the documentation on measuring soft navigations.
Background activity
To maintain telemetry accuracy, the collection pauses if the browser tab moves to the background, such as when the user switches tabs or if the device screen locks. Sampling resumes automatically when the tab returns to the foreground or the device is unlocked.
Overlay videos (Picture-in-Picture) are ignored to prevent background runtime skewing.
Feedback
If you have any questions or feedback regarding ad metrics, reach out to us at the Chrome UX Report Google Group.