


Use device mode to approximate how your page looks and performs on a mobile device.
Overview
Device mode is the name for a collection of features in Chrome DevTools that help you simulate mobile devices. These features include:
- Simulating a mobile viewport
- Throttling the CPU
- Throttling the network
- Additionally, in the Sensors panel:
Limitations
Think of device mode as a first-order approximation of how your page looks and feels on a mobile device. With device mode you don't actually run your code on a mobile device. You simulate the mobile user experience from your laptop or desktop.
There are some aspects of mobile devices that DevTools will never be able to simulate. For example, the architecture of mobile CPUs is very different than the architecture of laptop or desktop CPUs. When in doubt, your best bet is to actually run your page on a mobile device. Use Remote Debugging to view, change, debug, and profile a page's code from your laptop or desktop while it actually runs on a mobile device.
Open the device toolbar
To open the device toolbar, follow these steps:
- Open DevTools.
- Click Toggle device toolbar located in the action bar at the top.

Simulate a mobile viewport
By default, the device toolbar opens in viewport with Dimensions set to Responsive. Using the Dimensions drop-down, you can simulate the dimensions of a specific mobile device.

Responsive Viewport Mode
Drag the handles to resize the viewport to whatever dimensions you need. Or, enter specific values
in the width and height boxes. In this example, the width is set to 480 and the height is set to
415.

Alternatively, use the width presets bar to set the width with a click to one of the following:

| Mobile S | Mobile M | Mobile L | Tablet | Laptop | Laptop L | 4K |
|---|---|---|---|---|---|---|
| 320px | 375px | 425px | 768px | 1024px | 1440px | 2560px |
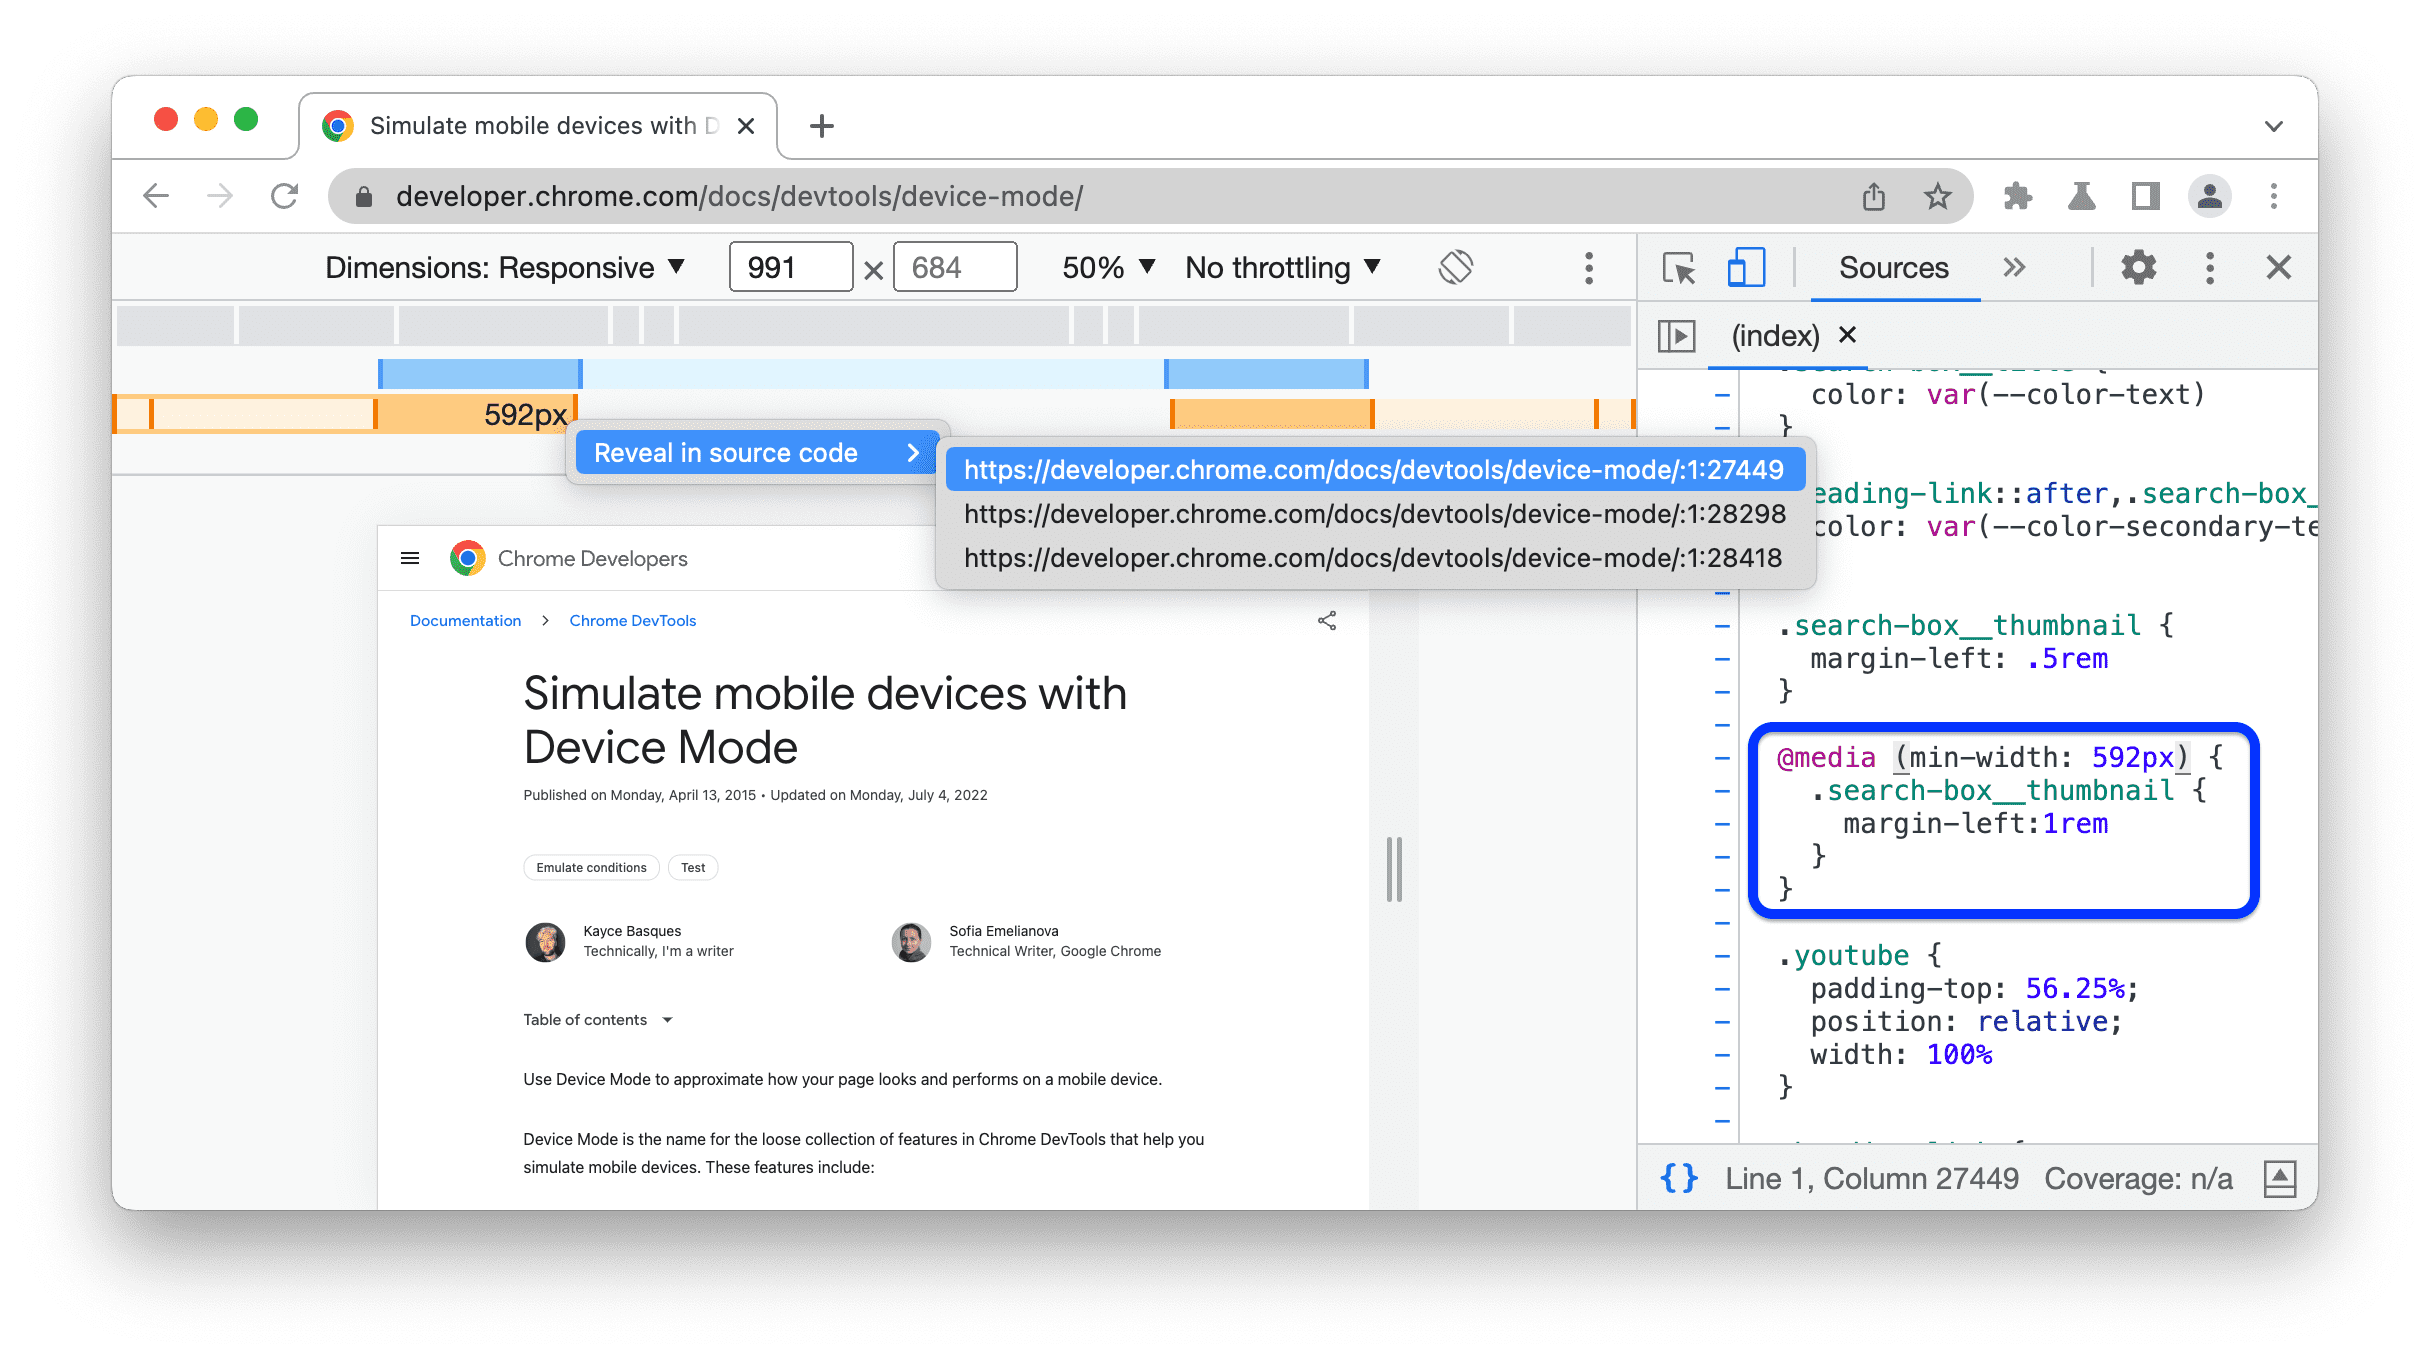
Show media queries
To show media query breakpoints above your viewport, click More options > Show media queries.

DevTools now displays two additional bars above the viewport:
- The blue bar with
max-widthbreakpoints. - The orange bar with
min-widthbreakpoints.
Click between breakpoints to change the viewport's width so that the breakpoint gets triggered.

To find the corresponding @media declaration, right-click between breakpoints and select Reveal in source code. DevTools opens the Sources panel at the corresponding line in the Editor.
Set device pixel ratio
Device pixel ratio (DPR) is the ratio between physical pixels on the hardware screen and logical (CSS) pixels. In other words, DPR tells Chrome how many screen pixels to use to draw a CSS pixel. Chrome uses the DPR value when drawing on HiDPI (High Dots Per Inch) displays.
To set a DPR value:
Click More options > Add device pixel ratio.

In the action bar at the top of the viewport, select a DPR value from the new DPR drop-down menu.

Set the device type
Use the Device Type list to simulate a mobile device or desktop device.
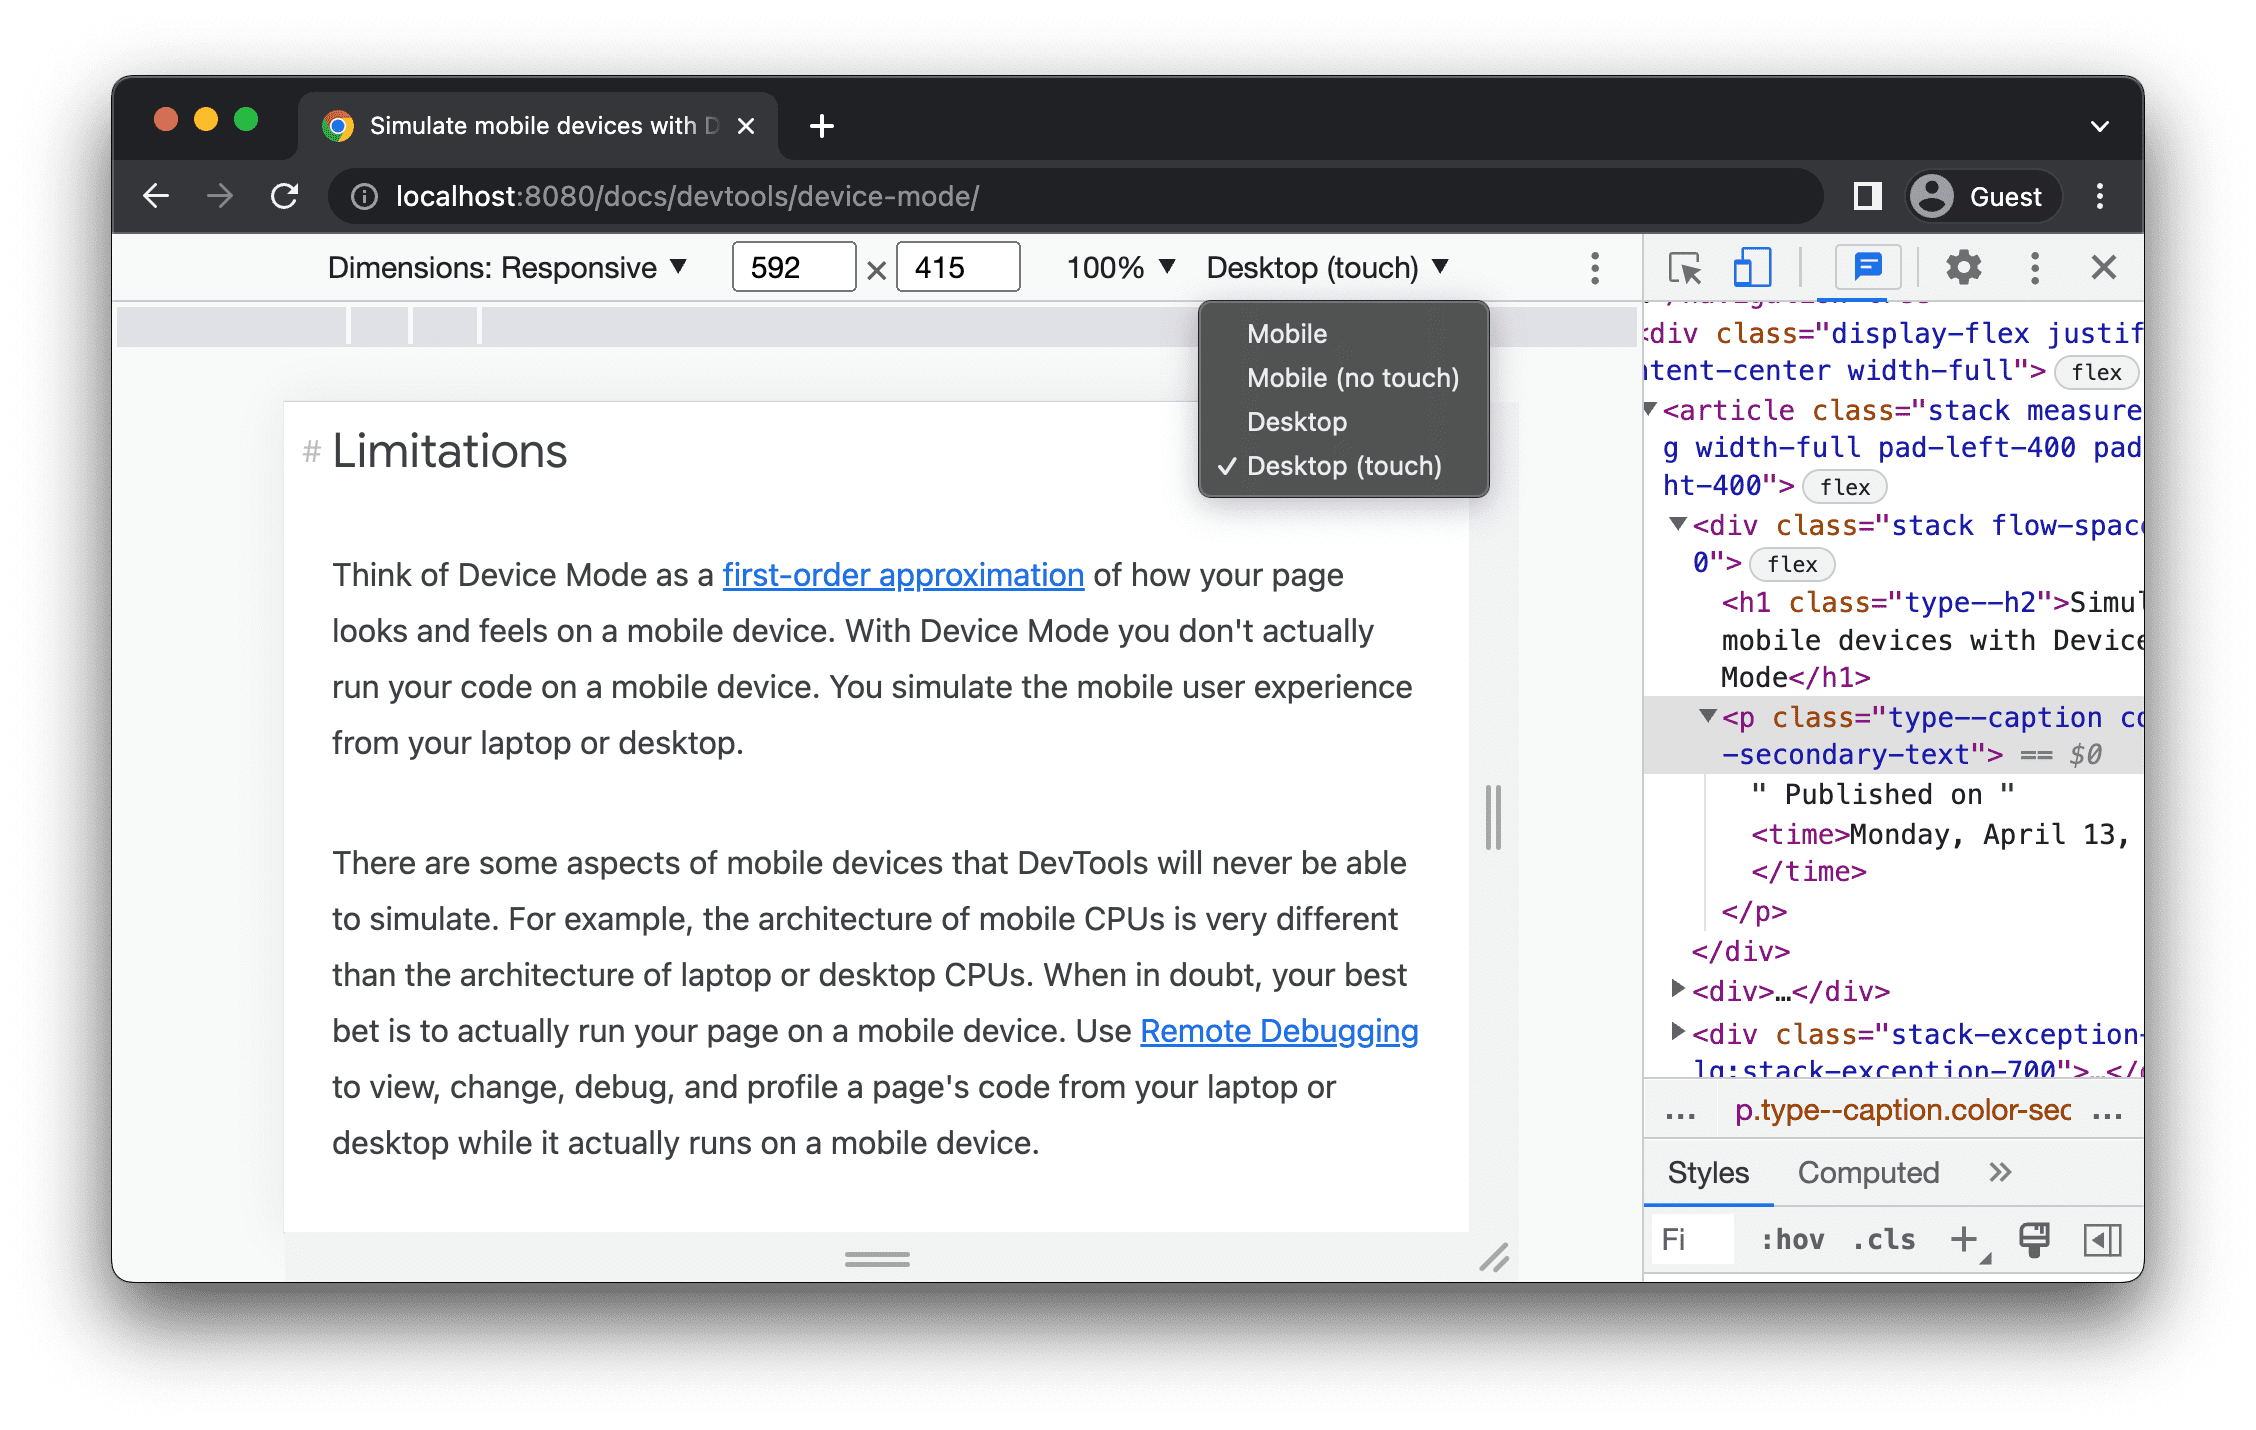
If you can't see the list on the action bar at the top, select More options > Add device type.
The next table describes the differences between the options.
Rendering method refers to whether Chrome renders the page as a mobile or
desktop viewport. Cursor icon refers to what type of cursor you see when you
hover over the page. Events fired refers to whether the page fires
touch or click events when you interact with the page.
| Option | Rendering method | Cursor icon | Events fired |
|---|---|---|---|
| Mobile | Mobile | Circle | touch |
| Mobile (no touch) | Mobile | Normal | click |
| Desktop | Desktop | Normal | click |
| Desktop (touch) | Desktop | Circle | touch |
Device-specific mode
To simulate the dimensions of a specific mobile device, select the device from the Dimensions list.

For more information, see Add a custom mobile device.
Rotate the viewport to landscape orientation
Click Rotate to rotate the viewport to landscape orientation.

Note that the Rotate button disappears if your Device toolbar is narrow.
See also Set orientation.
Toggle dual-screen mode
Some devices, for example, Surface Duo, have two screens and two ways to use them: with one or both screens active.
To toggle between dual and single screen, click the Toggle dual-screen mode in the toolbar.

Set device posture
Some devices, for example, Asus Zenbook Fold, have foldable screens. Such screens have a posture: continuous or folded. The continuous posture refers to a "flat" position and folded forms an angle between sections of the display.
To set the device posture, select Continuous or Folded from the corresponding drop-down menu in the toolbar.

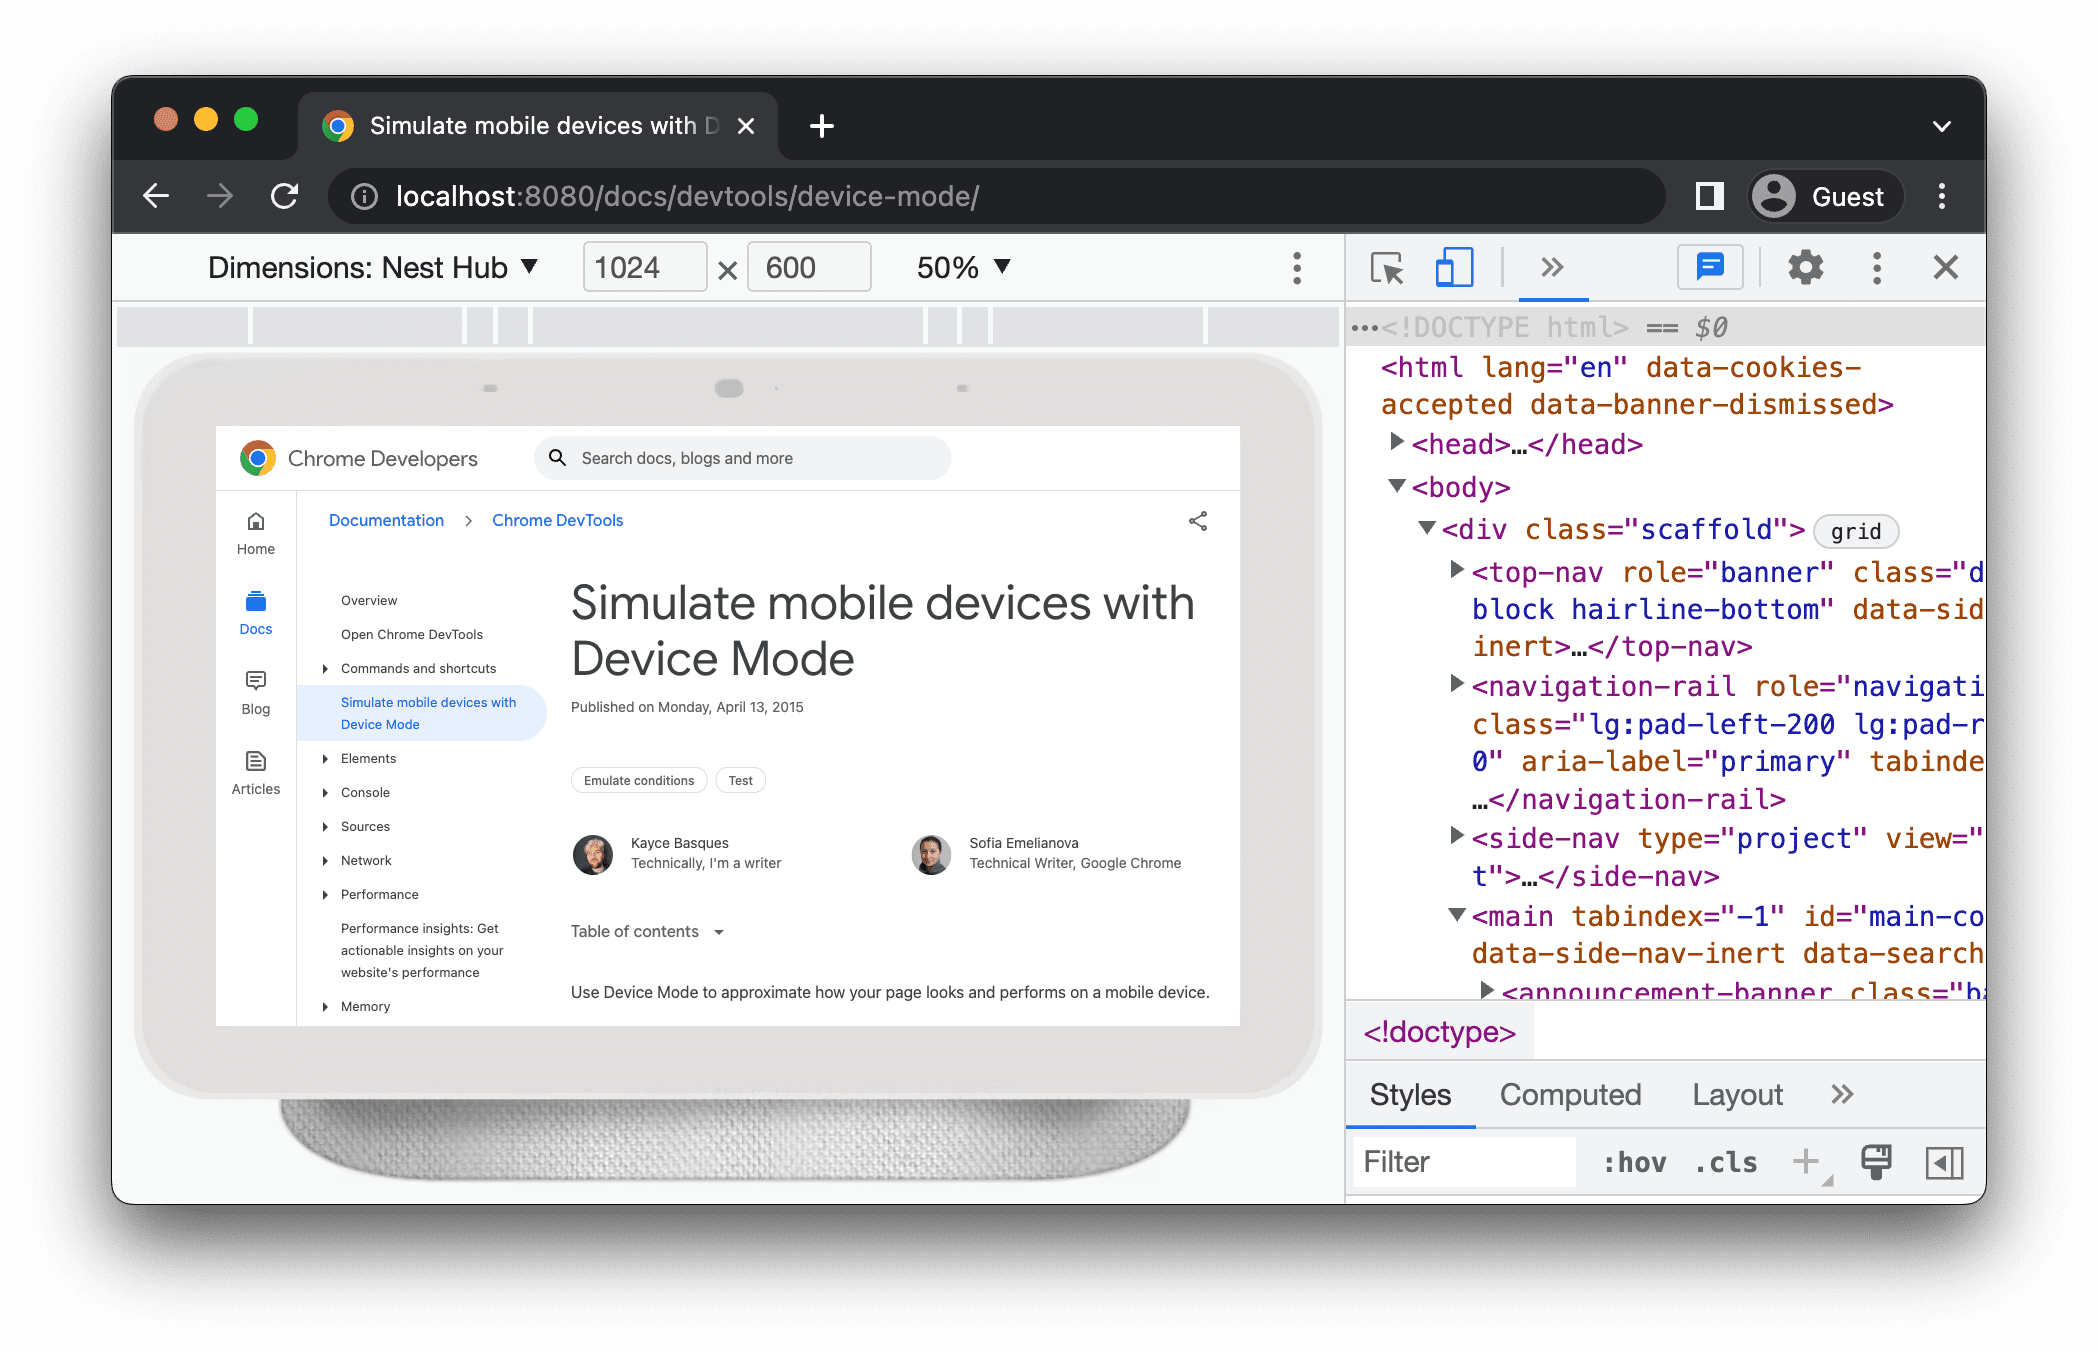
Show device frame
When simulating the dimensions of a specific mobile device like a Nest Hub, select More options > Show device frame to show the physical device frame around the viewport.

In this example, DevTools shows the frame for the Nest Hub.
Add a custom mobile device
To add a custom device:
Click the Device list and then select Edit.
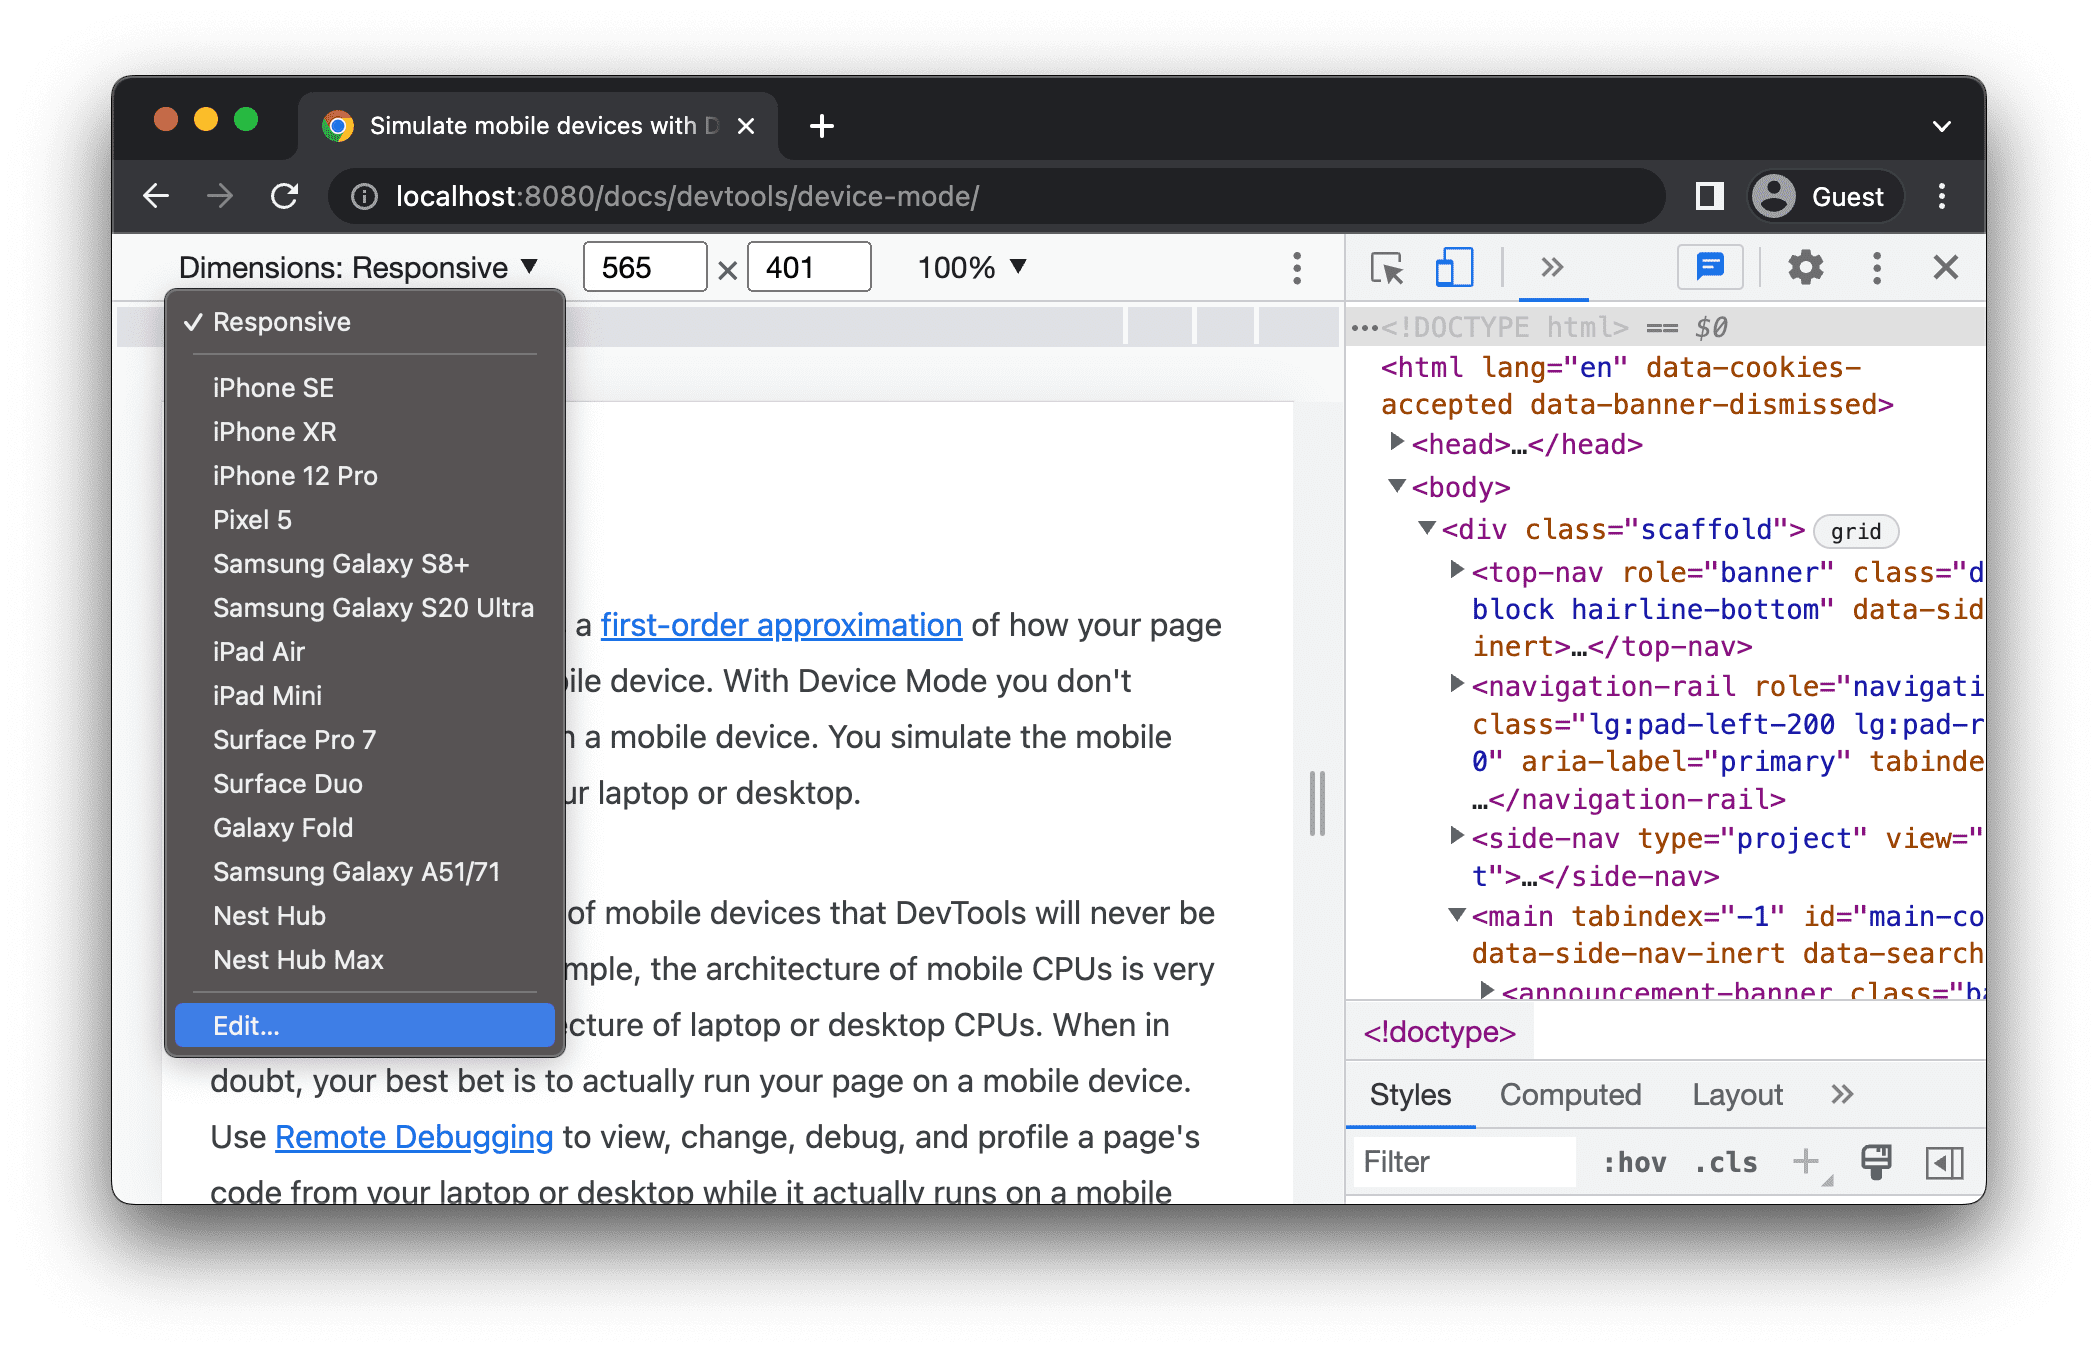
On the Settings > Devices tab, either choose a device from the list of supported ones or click Add custom device to add your own.
If you're adding your own, enter a name, width, and height for the device, then click Add.

The device pixel ratio, user agent string, and device type fields are optional. The device type field is the list that is set to Mobile by default.
Back in the viewport, select the newly added device from the Dimensions list.
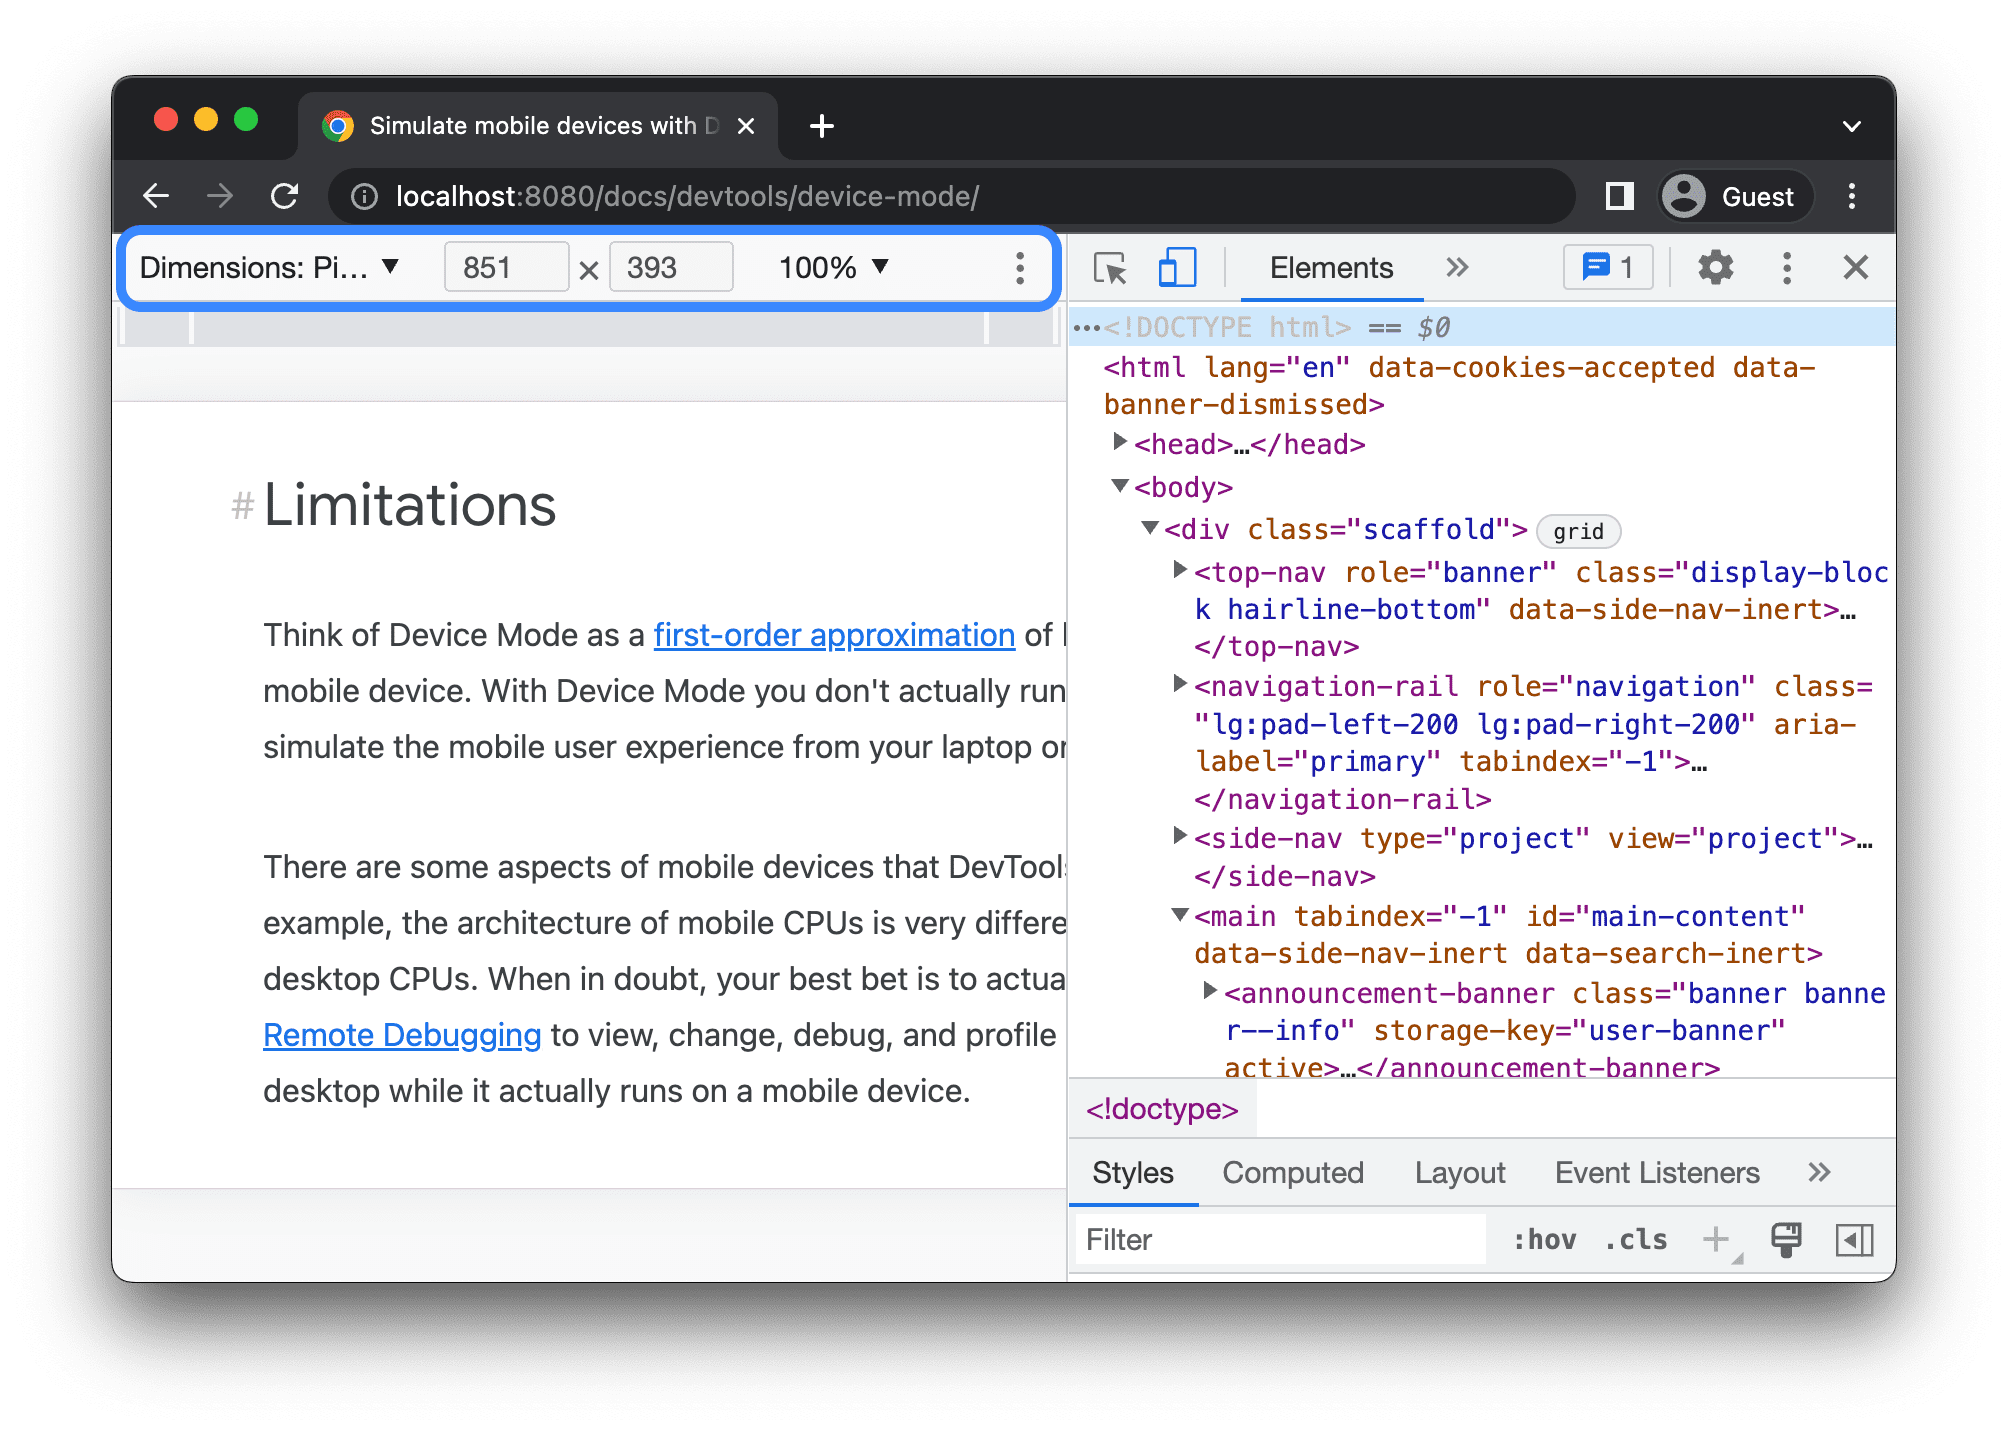
Show rulers
Click More options > Show rulers to see rulers. The sizing unit of the rulers is pixels.

DevTools shows rulers at the top and to the left of the viewport.

Click the rulers at specific marks to set the viewport's width and height.
Zoom the viewport
Use the Zoom list to zoom in or out.

Capture a screenshot
To capture a screenshot of what you see in the viewport, click More options > Capture screenshot.
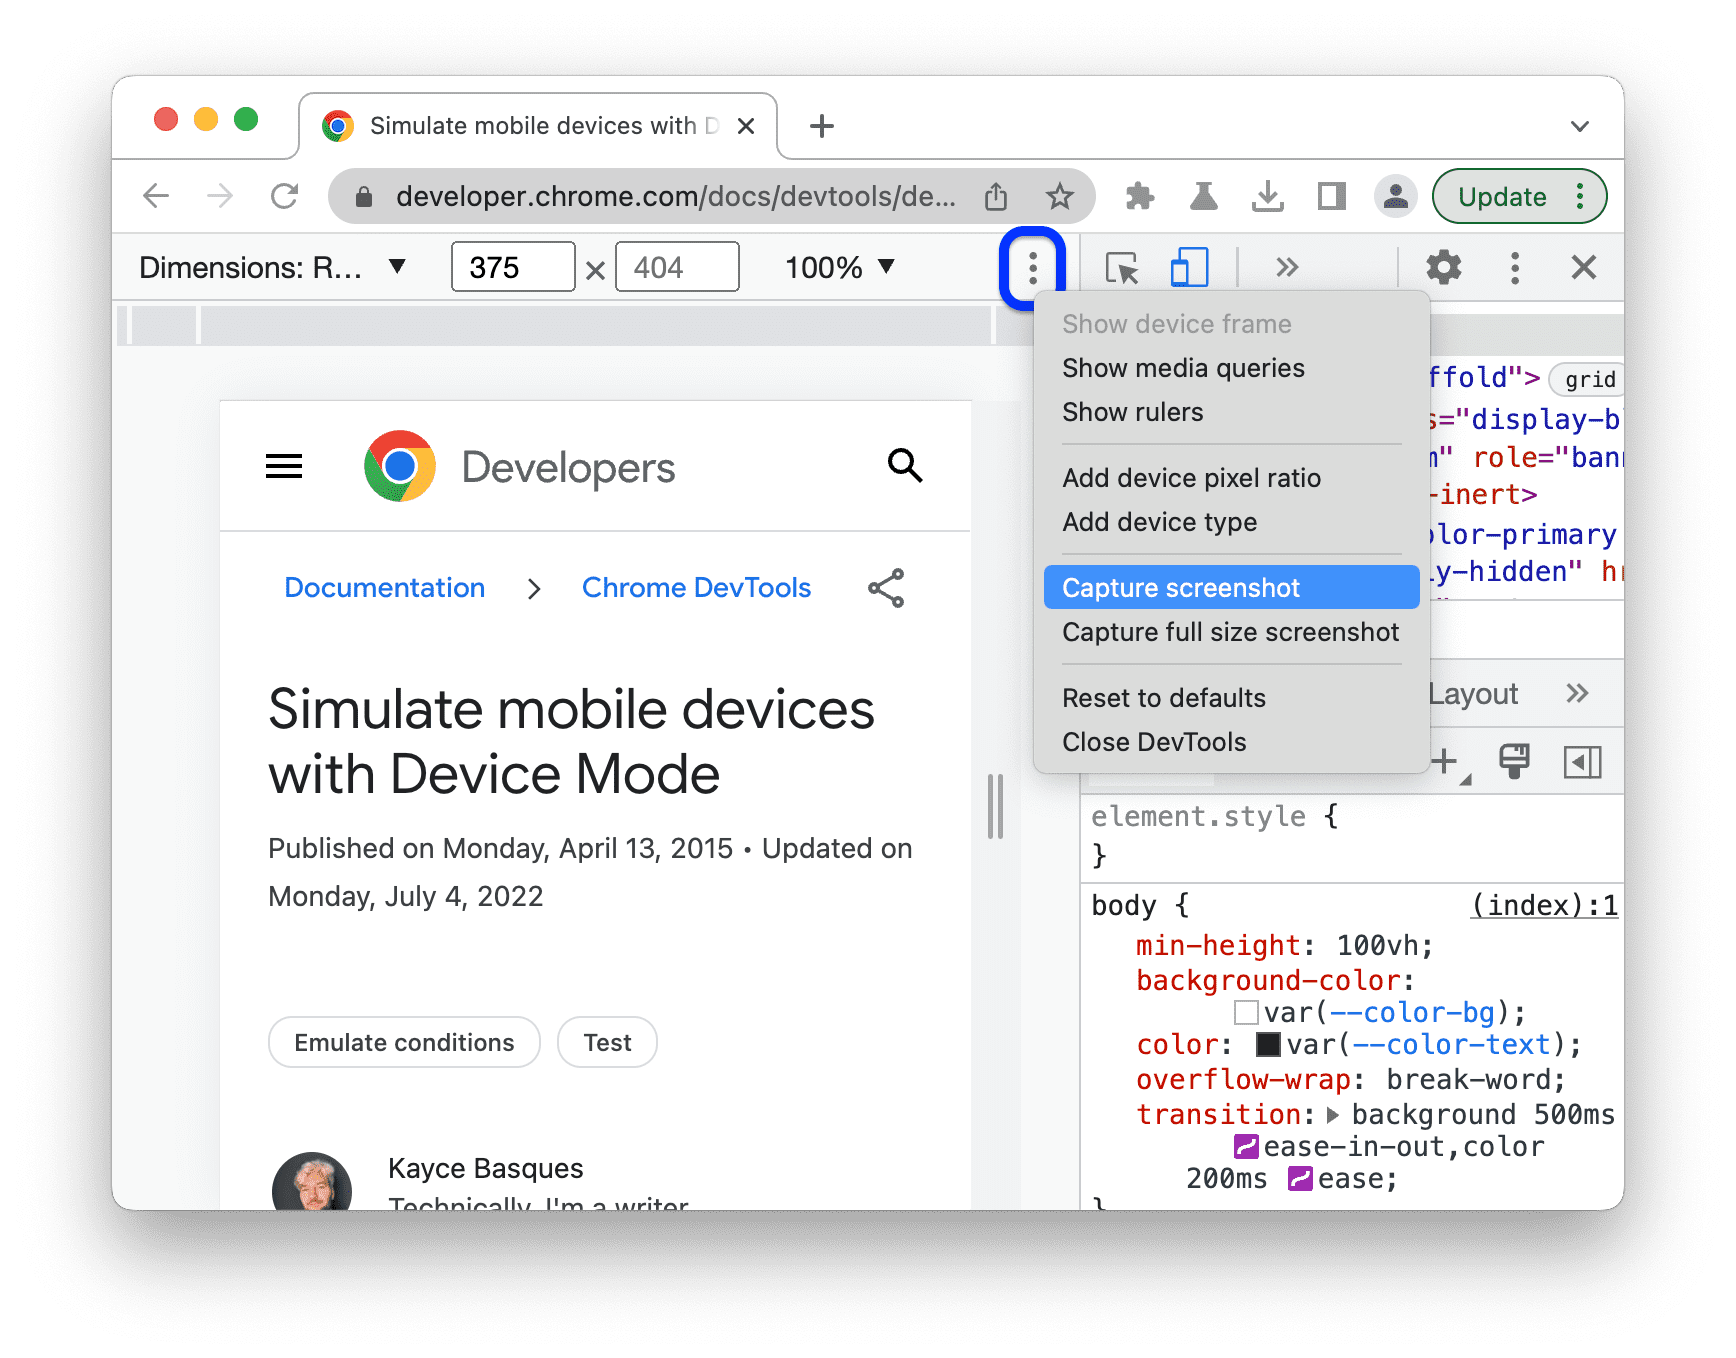
To capture a screenshot of the whole page including the content that isn't visible in the viewport, select Capture a full size screenshot from the same menu.
To include a device frame when capturing a screenshot in Device-specific mode, first Show device frame, and then click Capture screenshot as directed previously.

To learn other ways to take screenshots with DevTools, see 4 ways to capture screenshots with DevTools.
Throttle the network and CPU
To throttle both the network and CPU, select Mid-tier mobile or Low-end mobile from the Throttle list.

Mid-tier mobile simulates fast 3G and throttles your CPU so that it is 4 times slower than normal. Low-end mobile simulates slow 3G and throttles your CPU 6 times slower than normal. Keep in mind that the throttling is relative to the normal capability of your laptop or desktop.
Note that the Throttle list will be hidden if your Device toolbar is narrow.
Throttle the CPU only
To throttle the CPU only and not the network, go to the Performance panel,
click Capture Settings ![]() , and
then select 4x slowdown, 6x slowdown, or 20x slowdown from the
CPU list.
, and
then select 4x slowdown, 6x slowdown, or 20x slowdown from the
CPU list.

Throttle the network only
To throttle the network only and not the CPU, go the Network panel and select Fast 3G or Slow 3G from the Throttle list.

Or press Command+Shift+P (Mac) or Control+Shift+P (Windows, Linux, ChromeOS) to
open the Command Menu, type 3G, and select Enable fast 3G throttling or
Enable slow 3G throttling.

You can also set network throttling from the Performance panel. Click Capture Settings and then select Fast 3G or Slow 3G from the Network list.

Emulate sensors
Use the Sensors panel to override geolocation, simulate device orientation, force touch, and emulate idle state.
The next sections provide a quick look on how to override geolocation and set device orientation. For a complete list of features, see Emulate device sensors.
Override geolocation
To open the geolocation overriding UI, click Customize and control DevTools and then select More tools > Sensors.

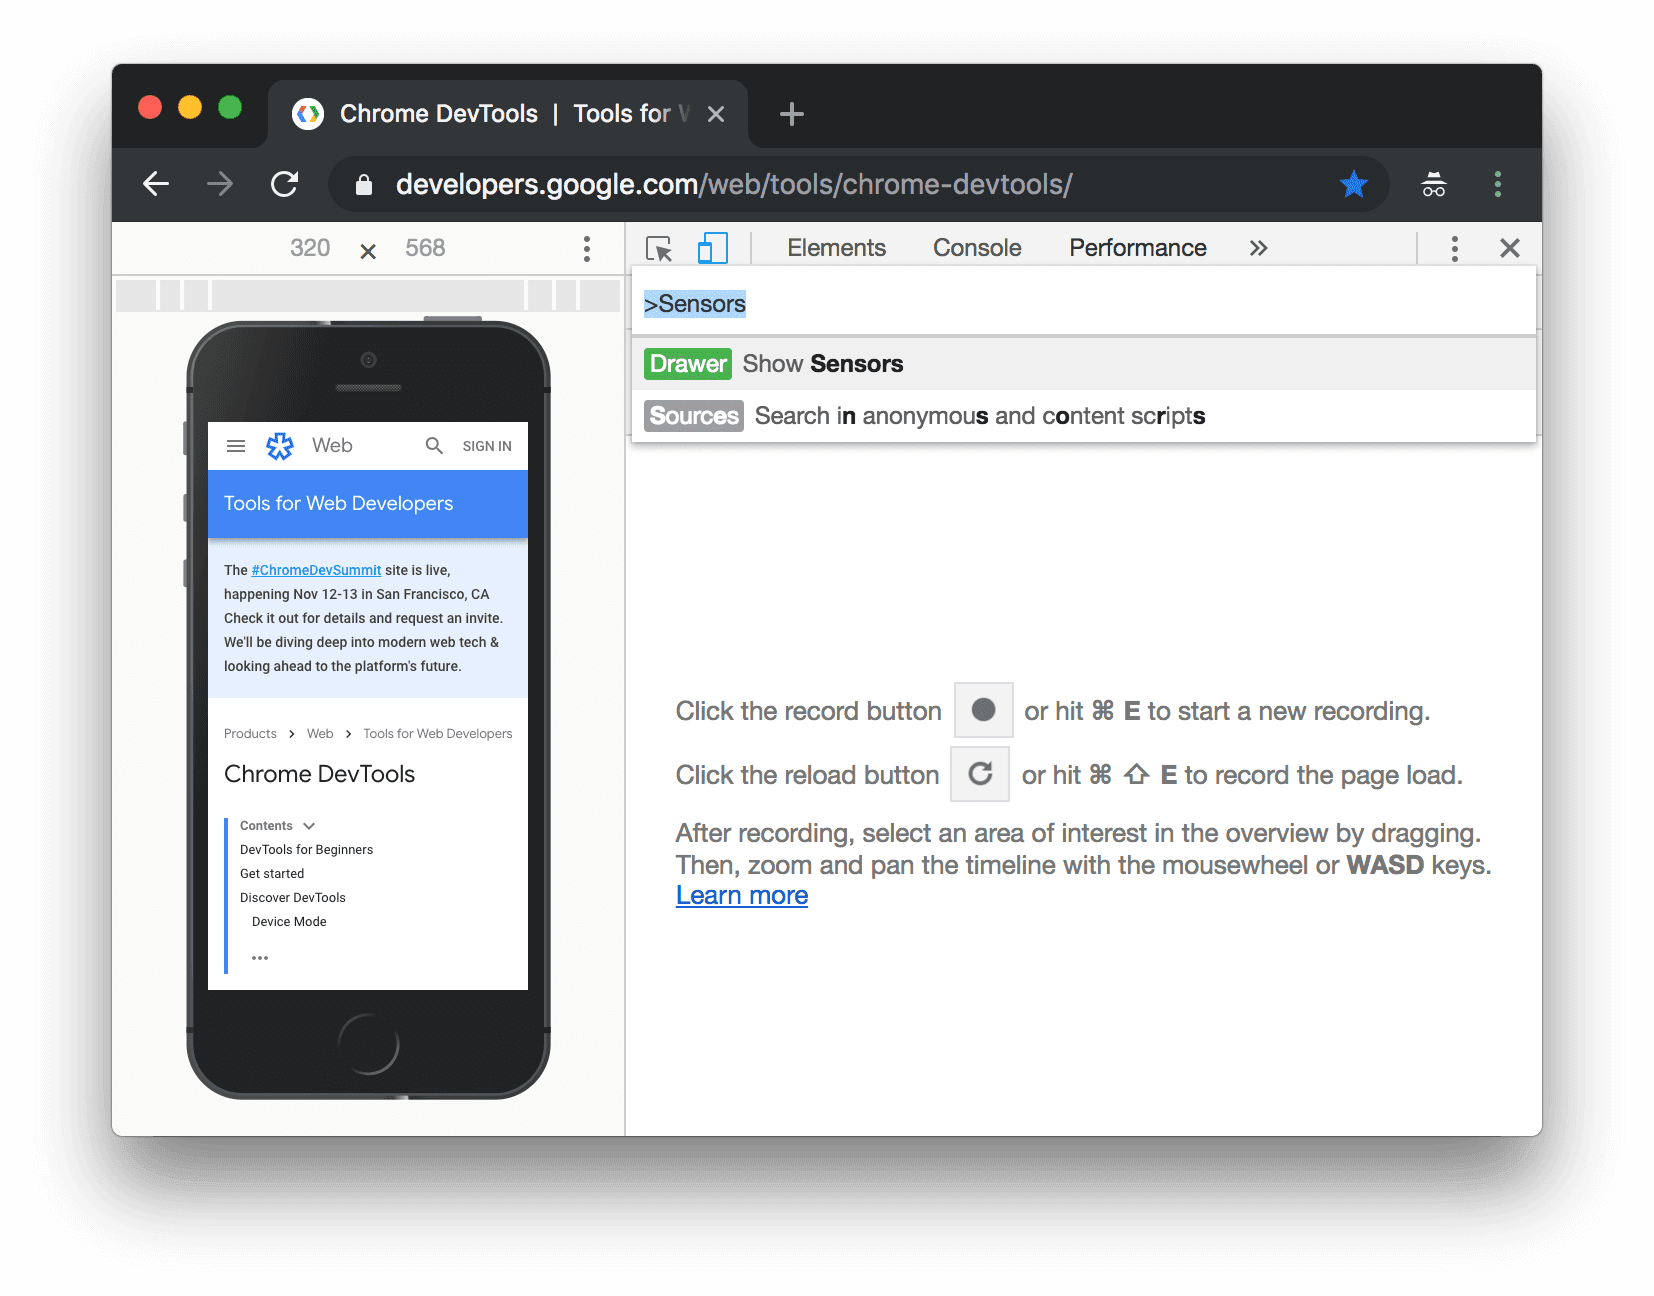
Or press Command+Shift+P (Mac) or Control+Shift+P (Windows, Linux, ChromeOS) to open the Command
Menu, type Sensors, and then select Show Sensors.

Select one of the presets from the Location list, or select Other... to enter your own coordinates, or select Location unavailable to test out how your page behaves when geolocation is in an error state.

Set orientation
To open the orientation UI, click Customize and control DevTools and then select More tools > Sensors.

Or press Command+Shift+P (Mac) or Control+Shift+P (Windows, Linux, ChromeOS) to open the Command
Menu, type Sensors, and then select Show Sensors.
Select one of the presets from the Orientation list or select Custom orientation to set your own alpha, beta, and gamma values.
