


Published: September 22, 2025, Last updated: January 7, 2026
For users, few things are more frustrating than a web page that suddenly slows to a crawl, drains their battery, or eats up their monthly data allowance. Sometimes, the culprit isn't the content they came to see, but an advertisement running in the background.
To protect the user experience, Chrome enforces limits on the resources an ad can use. When an ad exceeds these limits—becoming a heavy ad—Chrome unloads it to free up the device's resources.
This documentation explains how this intervention works, the specific thresholds involved, and some best practices you can use to ensure ads perform smoothly.
What is the heavy ad intervention?
The heavy ad intervention is a mechanism in Chrome that monitors the resource usage of ad frames. If an ad consumes a disproportionate amount of bandwidth or CPU processing power, Chrome will unload that specific ad frame.
Instead of the ad, the user will see a gray box with a message stating Ad removed usually accompanied by a Details link explaining that the ad used too many resources.

When is an ad considered heavy?
Chrome determines an ad is heavy based on three specific thresholds. If an ad hasn't been interacted with by the user and it meets any of the following criteria, it will be unloaded:
- Network usage: The ad uses more than four megabytes of network bandwidth.
- Peak CPU usage: The ad uses the main thread for more than 15 seconds in any 30-second window.
- Total CPU usage: The ad uses the main thread for more than 60 seconds total. All resources used by any descendant iframes of the ad frame count against the limits for the intervention on that ad.
What are some common triggers for this intervention?
Certain types of ad behaviors are more likely to trigger these interventions than others. Common culprits include:
- Uncompressed media: Loading extremely large, poorly compressed images.
- Heavy Javascript: Performing extensive operations, such as decoding video files using JavaScript.
- Heavy calculations: Performing complex calculations in the background.
- Video content without gestures: Loading large video files before a user interacts with an ad.
What happens when an ad is removed?
When Chrome detects that an ad has exceeded the heavy ad thresholds, it takes immediate action to protect the user's device resources.
The user experience
From the user's perspective, the ad is immediately unloaded. In its place, Chrome displays a gray box with a message: Ad removed. If the user clicks the Details within the container, they will see a specific explanation.
The developer experience
Chrome also generates an intervention report with the Reporting API to let you know exactly what happened. Previously, these reports were only sent to the ad frame itself and its descendant frames. However, publishers often had no way of knowing that ads on their own pages were being removed. To address this, Chrome has expanded the reporting mechanism. Intervention reports are now sent to the embedding frame (the parent of the root ad frame) in addition to the ad frame itself. Reports sent to the embedding frame include the child frame's ID and the ad frame URL.
To configure the page for HTTP reports, the response should include the Report-To header:
Reporting-Endpoints: default="https://example.com/reports"
The post request triggered will include a report like this:
POST /reports HTTP/1.1
Host: example.com
…
Content-Type: application/report

[{
 "type": "intervention",
 "age": 60,
 "url": "https://example.com/url/of/ad.html",
 "body": {
   "sourceFile": null,
   "lineNumber": null,
   "columnNumber": null,
   "id": "HeavyAdIntervention",
   "message": "Ad was removed because its CPU usage exceeded the limit. See https://www.chromestatus.com/feature/4800491902992384?utm_source=devtools"
 }
}]
The embedding frame will receive a similar report, addressed to the embedding frame URL, but the message will additionally contain the child frame's ID and the specific URL of the child frame:
...
"message": "Ad was removed because its CPU usage exceeded the limit. See https://www.chromestatus.com/feature/4800491902992384?utm_source=devtools (id=123;url=http://example2.com/pre-redirect-ad-url.html)"
...
The Javascript API provides the ReportingObserver with an observe() method that can be used to trigger a provided callback on interventions. This can be useful if you want to attach additional information to the report to aid in debugging.
// callback that will handle intervention reports
function sendReports(reports) {
  for (let report of reports) {
    // Log the `report` json using your own reporting process
    navigator.sendBeacon('https://report.example/your-endpoint', report);
  }
}

// create the observer with the callback
const observer = new ReportingObserver(
  (reports, observer) => {
    sendReports(reports);
  },
  { buffered: true }
);

// start watching for interventions
observer.observe();
Since the intervention unloads the iframe page (for example, an ad), use the pagehide event to ensure the reporting callback captures the intervention report before the page vanishes.
window.addEventListener('pagehide', (event) => {
  // pull all pending reports from the queue
  let reports = observer.takeRecords();
  sendReports(reports);
});
The resulting JSON from the JavaScript is similar to that sent on the POST request:
[
  {
    type: 'intervention',
    url: 'https://example.com/url/of/ad.html',
    body: {
      sourceFile: null,
      lineNumber: null,
      columnNumber: null,
      id: 'HeavyAdIntervention',
      message:
        'Ad was removed because its network usage exceeded the limit. See https://www.chromestatus.com/feature/4800491902992384',
    },
  },
];
Best practices for developers
To prevent your ads from falling under the heavy ad banner, consider the following best practices:
- Require user interaction for heavy content: The intervention criteria apply to ads that the user has not interacted with. If a user clicks or taps on your ad, the resource limits no longer apply. For video or rich media experiences, wait for a user gesture (like a "click to play") before loading heavy assets.
- Optimize images and video: Ensure images are compressed and videos are optimized for the web. Avoid loading large video files automatically; instead, use lightweight placeholders until the user engages.
- Audit CPU use: Complex animations or Javascript operations that trigger continuous layout and paint can spike CPU usage. Use tools to identify bottlenecks in your code that might keep the main thread busy for long periods.
- Monitor descendant frames: Remember that the resource count includes everything inside your ad's iframe. If your ad loads third-party tracking pixels or sub-frames, their resource usage counts against your limit.
- Isolate non-ad content: Separate non-ad content frames into different domains or recognizable patterns that are unlikely to be considered ad domains by the filter list provider's policy.
How to debug and diagnose the cause of an intervention?
To effectively troubleshoot and resolve heavy ad interventions, you must first understand how Chrome's detection logic identifies content as an ad and then use built-in developer tools to audit the specific resource triggers that led to the removal
How does Chrome detect the presence of an ad?
Chrome tags content as an ad by matching resource requests against a filter list. The detection logic applies to content within iframes. The main page frame is never considered ad-related, even if it contains ad scripts. Note that an iframe loaded from a resource matched by the filter list will be considered an ad even if other, non-ad content is loaded from that frame as well. An example of this is a video player loaded in an iframe tagged as an ad might also load non-ad content.
How to verify ad detection?
As a developer you can visually verify if Chrome has successfully detected your content as an ad using Chrome DevTools.
- Highlighting ad frames: In the Rendering panel, select Highlight Ad Frames, Which color-codes detected ad frames in red on the screen.
- Element annotation: In the Elements panel, detected ad iframes will display an ad annotation next to the opening
<iframe>tag. - Network activity: In the Network panel, filter requests based on an
Is ad-relatedboolean. - Ad status: In the application panel under the Frames section, ad-tagged frames will include an
Ad Statusattribute.
How to diagnose the cause of an intervention?
Chrome provides tools to audit and improve the quality and performance of web pages. Run Lighthouse in Chrome DevTools to get reports on how well your page performs. You can also refer to the web.dev/fast collection and explore more information about Web Vitals.
Network usage
Bring up the Network panel in Chrome DevTools to see the overall network activity for the ad. Check the Disable cache option to get consistent results over repeated loads.

The transferred value at the bottom of the page will show you the amount transferred for the entire page. To restrict the requests just to the ones related to the ad, use the Filter input at the top.
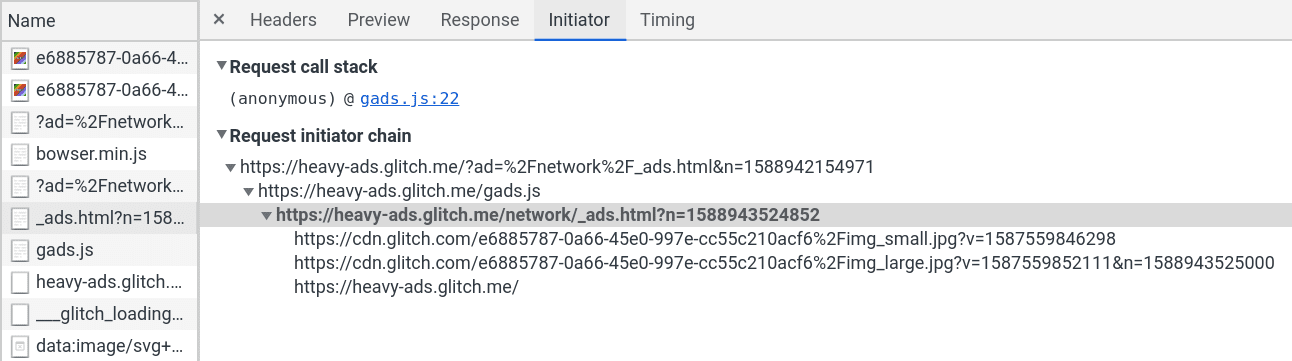
If you find the initial request for the ad, for example, the source for the iframe, use the Initiator tab within the request to see all of the requests it triggers.
Sorting the overall list of requests by size is a good way to spot overly large resources. Common culprits include images and videos that have not been optimized.
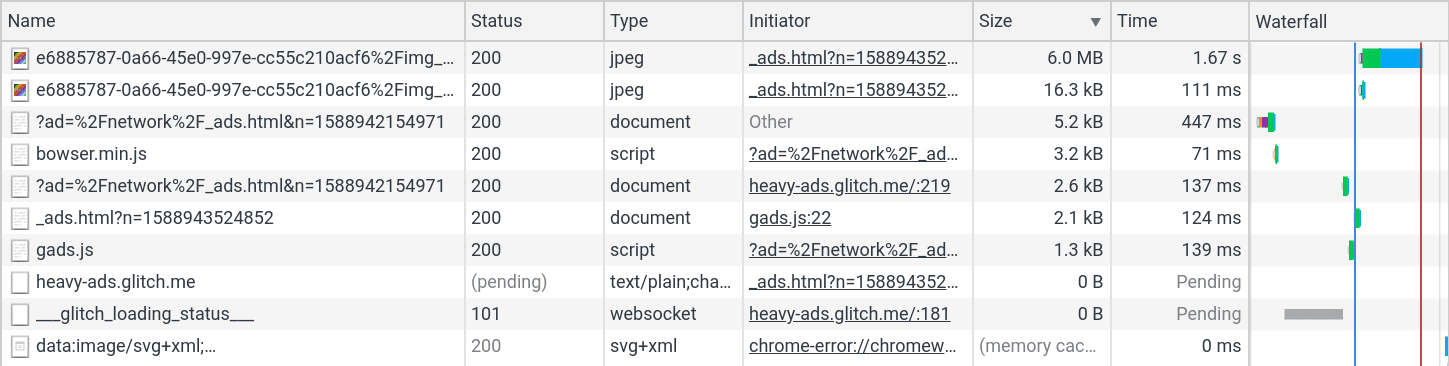
Additionally, sorting by name can be a good way to spot repeated requests. It may not be a single large resource triggering the intervention, but a large number of repeated requests that incrementally go over the limit.
CPU usage
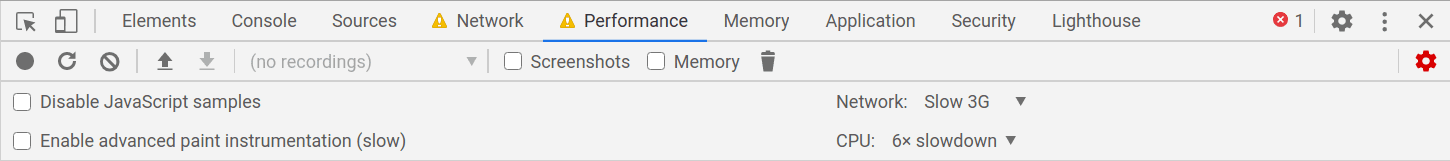
The Performance panel in DevTools will help diagnose CPU usage issues. Open up the Capture Settings menu. Use the CPU drop-down to slow down the CPU as much as possible. The interventions for CPU are far more likely to trigger on lower-powered devices than high-end development machines.
Next, click the Record button to begin recording activity. You may want to experiment with when and how long you record for, as a long trace can take quite a while to load. Once the recording is loaded you can use the top timeline to select a portion of the recording. Focus on areas on the graph in solid yellow, purple, or green that represent scripting, rendering, and painting.
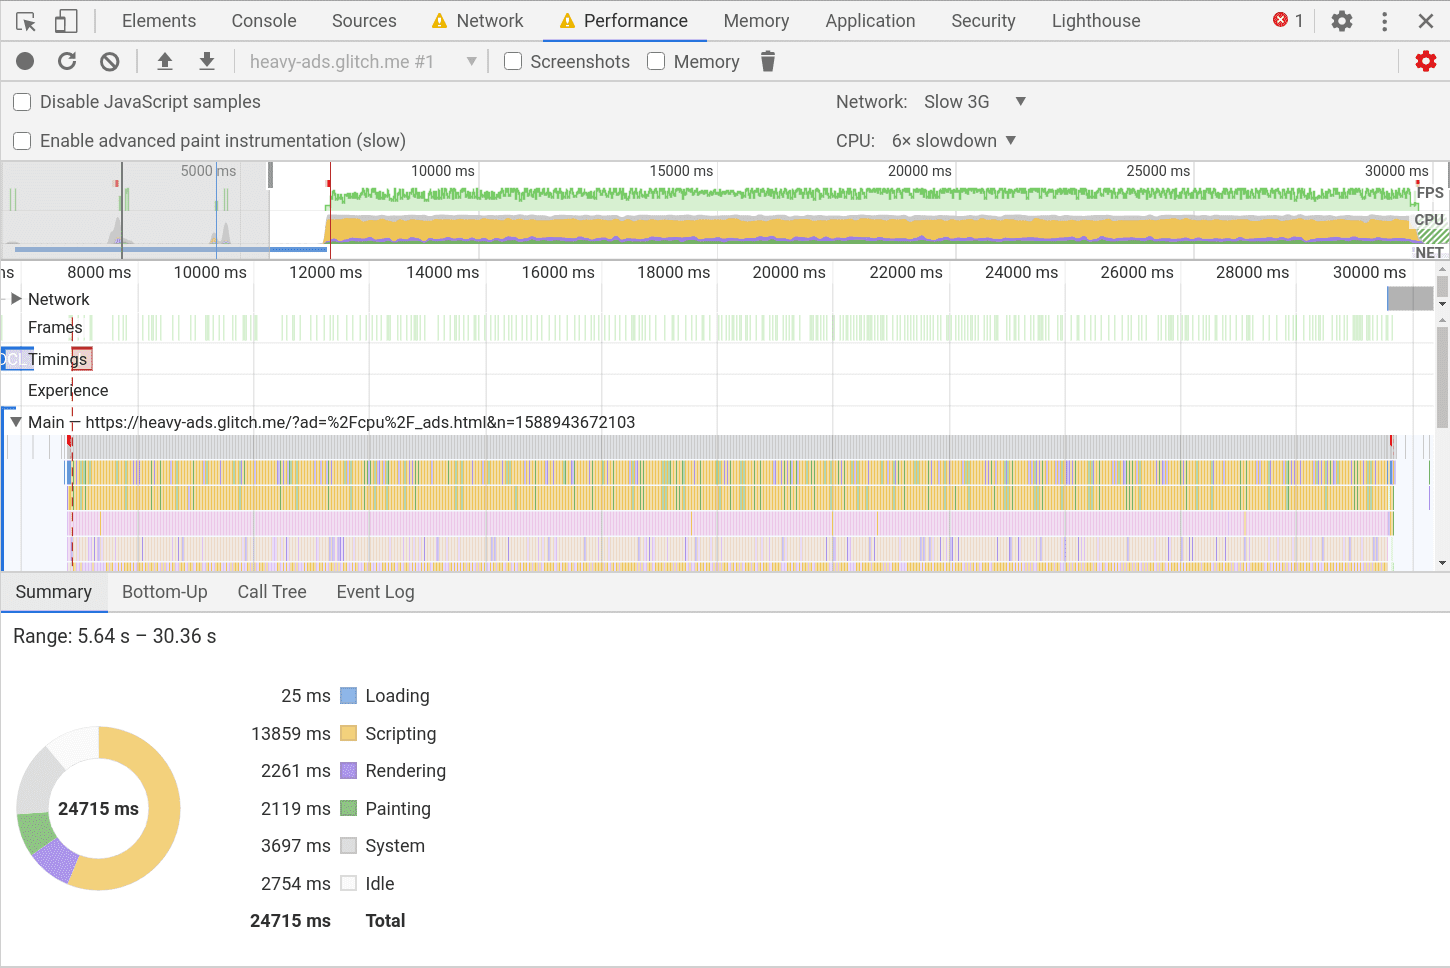
Explore the Bottom-Up, Call Tree, and Event Log tabs at the bottom. Sorting those columns by Self Time and Total Time can help identify bottlenecks in the code.
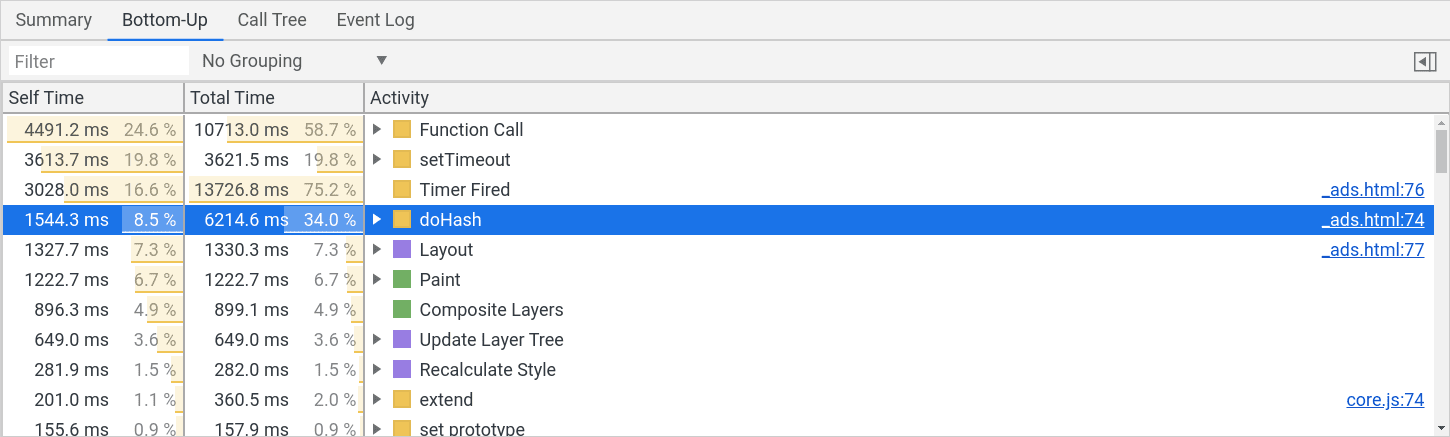
The associated source file is also linked there, so you can follow it through to the Sources panel to examine the cost of each line.
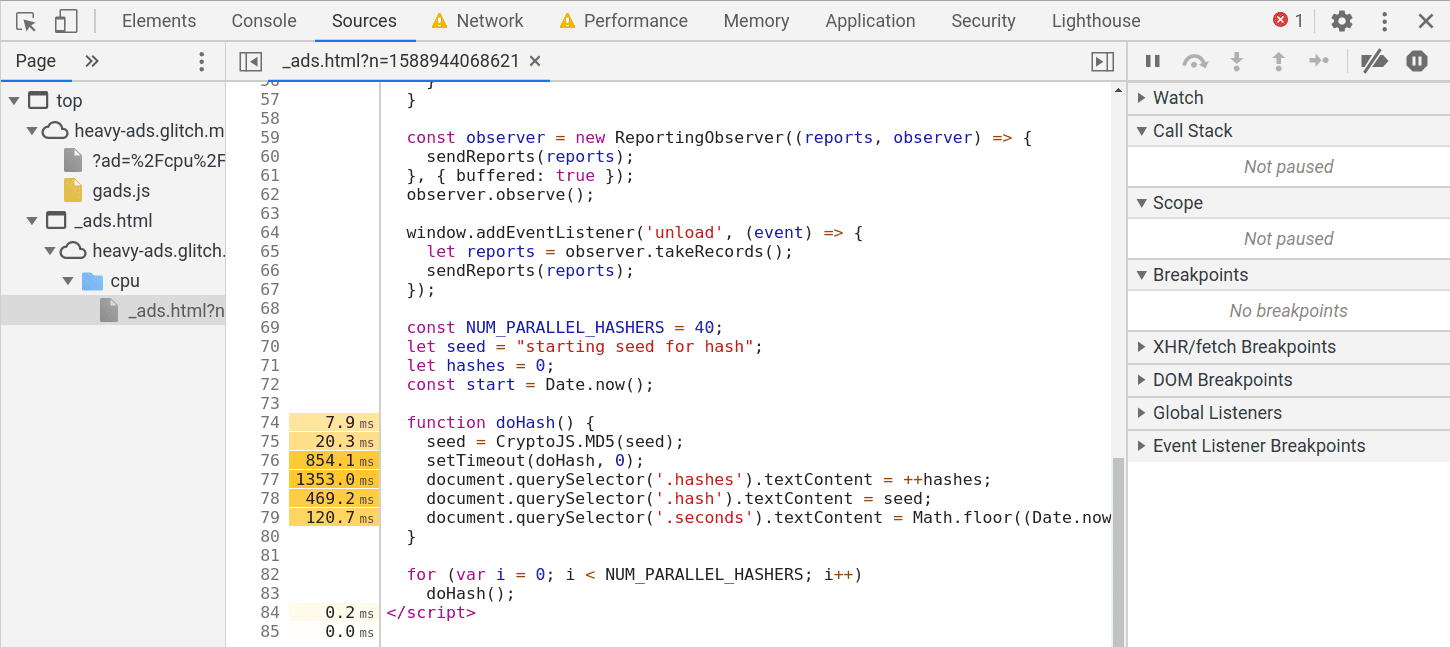
Common issues to look for here are poorly optimized animations that are triggering continuous layout and paint or costly operations that are hidden within an included library.
How to report incorrect interventions?
If non-ad content has been tagged as such, consider changing the code to avoid matching the filtering rules, or engage directly with the EasyList maintainers to change the filtering rules. Remember that the heavy ads intervention does not impact frames with user gesture, so video can be excluded by requiring clicking on a play button before loading content. If the EasyList does not match your content, and Chrome has somehow misclassified the content as ad related, then you can raise an issue with Chrome using this template. When raising an issue include a captured example of the intervention report and a sample URL to reproduce the issue.