First Contentful Paint (FCP) is one of six metrics tracked in the Performance section of the Lighthouse report. Each metric captures some aspect of page load speed.
Lighthouse displays FCP in seconds:

What FCP measures
FCP measures how long it takes the browser
to render the first piece of DOM content
after a user navigates to your page.
Images, non-white <canvas> elements, and SVGs on your page are considered
DOM content; anything inside an iframe isn't included.
How Lighthouse determines your FCP score
Your FCP score is a comparison of your page's FCP time and FCP times for real websites, based on data from the HTTP Archive. For example, sites performing in the ninety-ninth percentile render FCP in about 1.2 seconds. If your website's FCP is 1.2 seconds, your FCP score is 99. See How metric scores are determined to learn how Lighthouse score thresholds are set.
This table shows how to interpret your FCP score for mobile:
| FCP time (in seconds) |
Color-coding |
|---|---|
| 0–1.8 | Green (fast) |
| 1.8–3 | Orange (moderate) |
| Over 3 | Red (slow) |
The Web Vitals initiative recommends the same thresholds regardless of device for its thresholds, which basically uses the mobile thresholds. However, since Lighthouse is a lab tool, it can be useful to be stricter when testing for faster desktop devices it uses different thresholds.
The following table shows how to interpret your FCP score on desktop:
| FCP time (in seconds) |
Color-coding |
|---|---|
| 0–0.9 | Green (fast) |
| 0.9–1.6 | Orange (moderate) |
| Over 1.6 | Red (slow) |
How to improve your FCP score
One issue that's particularly important for FCP is font load time. Check out the Ensure text remains visible during webfont load post for ways to speed up your font loads.
Measure FCP on real users' devices
To learn how to measure when FCP actually occurs on your users' devices, see Measure FCP in JavaScript.
See Google's Assessing Loading Performance in Real Life with Navigation and Resource Timing for more on collecting real-user metrics.
How to improve your overall Performance score
Unless you have a specific reason for focusing on a particular metric, it's usually better to focus on improving your overall Performance score.
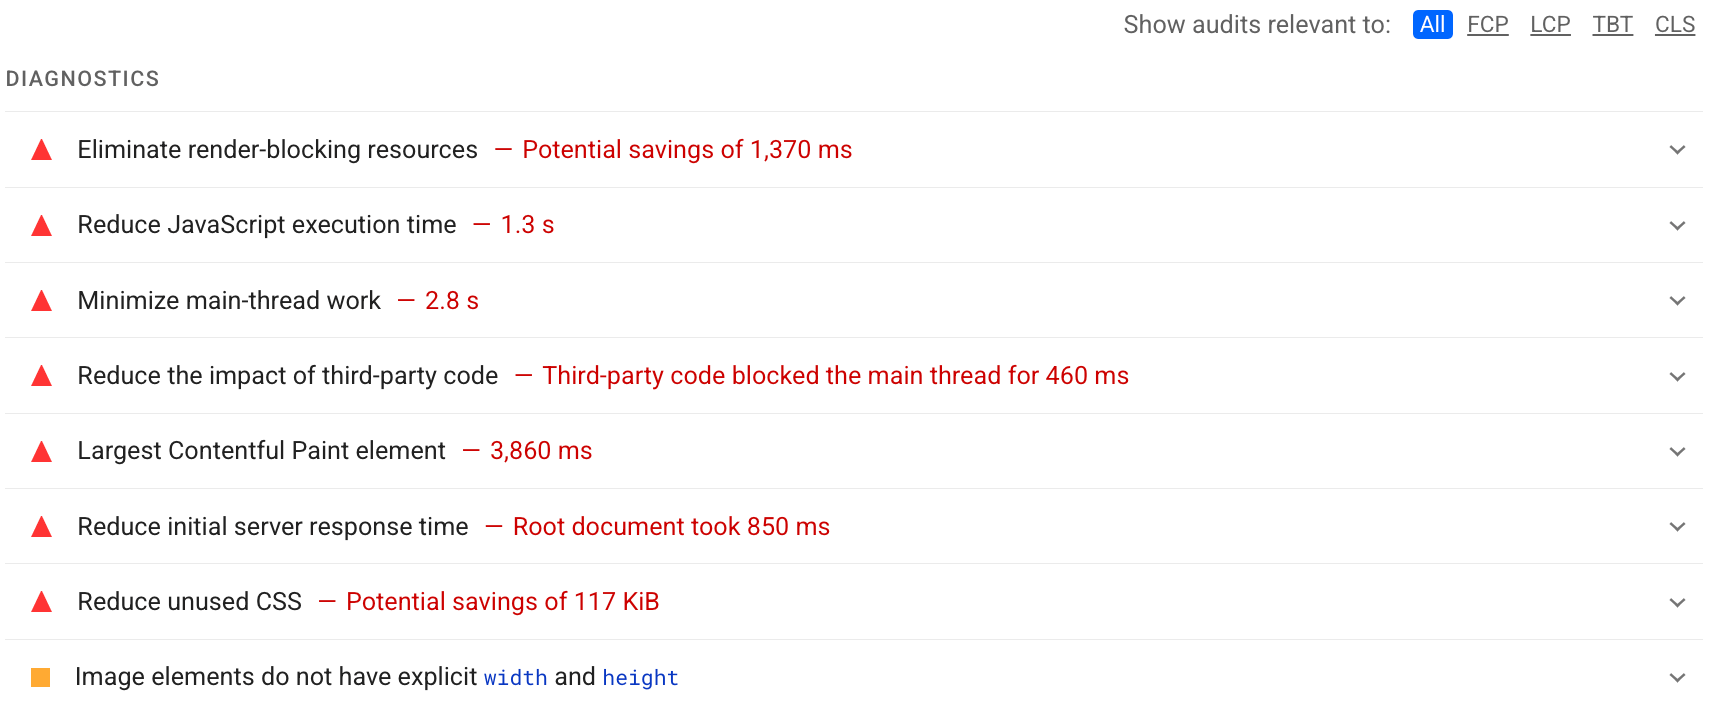
Use the Diagnostics section of your Lighthouse report to determine which improvements will have the most value for your page. The more significant the opportunity, the greater the effect it will have on your Performance score. For example, the following Lighthouse screenshot shows that eliminating render-blocking resources will yield the biggest improvement:

See the Performance audits to learn how to address the opportunities identified in your Lighthouse report.
