

Configure the appearance and behavior of DevTools and its panels using ![]() Settings > Preferences. This tab lists both general customization options and panel-specific ones.
Settings > Preferences. This tab lists both general customization options and panel-specific ones.
To set preferences, open ![]() Settings > Preferences and scroll to one of the sections described next.
Settings > Preferences and scroll to one of the sections described next.
To find out what each setting does, search this page for the setting's name and expand its description.
This reference indicates different settings with the following icons:
 Checkboxes
- Drop-down lists

 Deprecated
To restore default preferences, scroll to the end of the Preferences tab and click Restore defaults and reload.
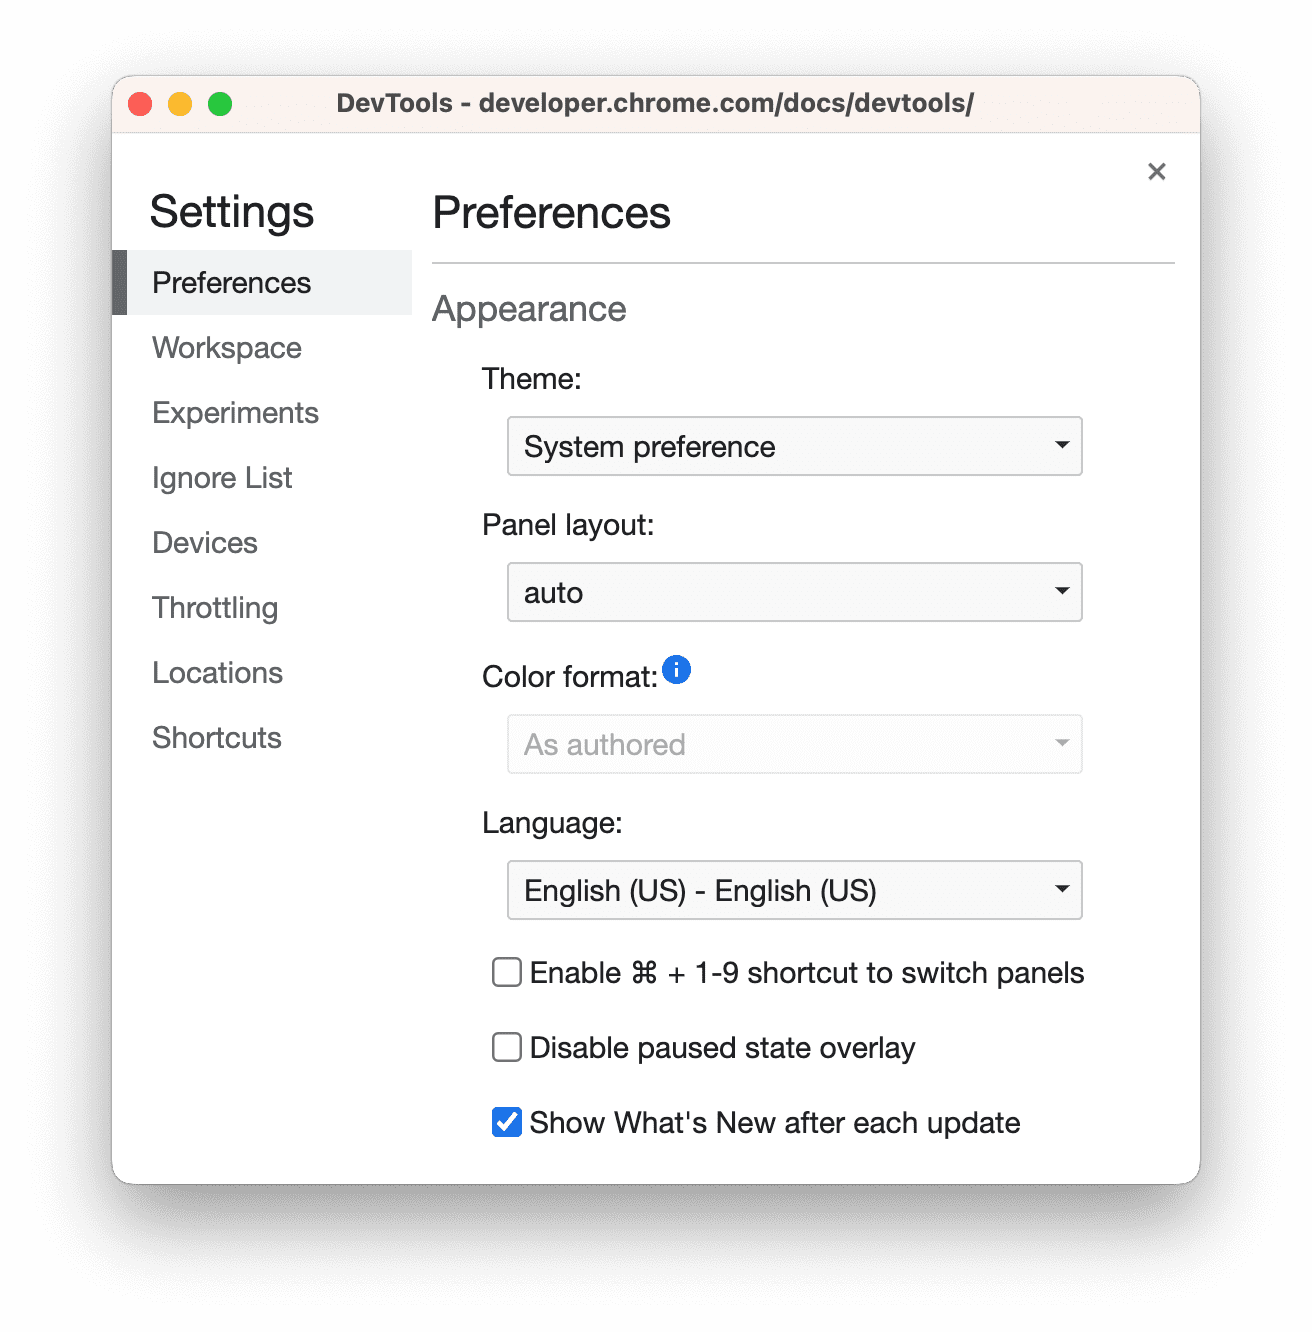
Appearance
This section lists options that customize DevTools appearance.
Themes  sets a color theme for DevTools UI.
Panel layout  arranges panes in panels.
Affects Elements > Styles and sister tabs, and the Sources > Debugger pane. The auto option makes the layout depend on DevTools width.
Language  sets the locale for DevTools UI.
To apply this setting, reload DevTools.
 Enable Ctrl/Cmd + 0-9 shortcut to switch panels lets you open panels using the keyboard.
This video shows how to switch between the tabs using the corresponding keyboard shortcuts.
 Disable paused state overlay hides the Paused in debugger
  overlay in the viewport when code execution is paused.
 Show What's New after each update automatically opens the What's New drawer tab after each Chrome update.

Sources
This section lists options that customize the Sources panel.
 Search in anonymous and content scripts lets you search all loaded JavaScript files, including those in Chrome extensions, using the Search tab.
This video shows how to search for text in an extension source file.
 Automatically reveal files in sidebar selects files on the Sources > Page pane when you switch between tabs in the Editor.
This video shows how, with this option enabled, the Sources panel selects files in the navigation tree as you switch between tabs.
 Enable JavaScript source maps lets DevTools find sources of generated or minified JavaScript files.

 Enable tab moves focus makes the
  Tab key move focus inside DevTools instead of inserting a Tab character in the Editor.
Requires to reload DevTools.
This video first shows Tab characters inserted with the Tab key. Then when you enable this option and reload DevTools, the Tab key moves focus.
 Detect indentation sets indentation to the one in the source file opened in the Editor.
Requires to reload DevTools.
This video first shows the default indentation of eight spaces. Then when you enable this option, it overrides the default indentation to that of the source file.
 Autocompletion enables handy suggestions in the Editor.
This video first doesn't show any suggestions. Then when you enable this option, the Editor shows suggestions for command completion.
Auto bracket closing automatically adds a closing bracket or tag when you type an opening one.
This video shows typing opening brackets before and after enabling automatic bracket closing.
 Bracket matching underlines and highlights in light red in the Editor a square bracket, curly bracket, or parenthesis without a pair.

 Code folding lets you fold and unfold code blocks in curly brackets in the Editor.
Requires to reload DevTools.
This video shows how to fold code blocks when you enable this option.
Show whitespace characters  displays whitespace characters in the Editor.
Requires to reload DevTools. Options do the following:
- All denotes all whitespace characters as dots (
...). Additionally, the Editor denotes the Tab character as a line (—). - Trailing highlights whitespace characters at the end of lines in light red.
 Display variable values inline while debugging shows you the variable values next to assignment statements while the execution is paused.

 Focus Sources panel when triggering a breakpoint opens Sources > Editor at the line with the breakpoint that paused execution.
This video first shows the Sources panel out of focus when paused at a breakpoint. Then when you enable this option, DevTools opens the Editor in the Sources panel and shows you the line of code with the breakpoint.
Automatically pretty print minified sources makes those sources readable.
When pretty-printed, the Editor may show a single long code line in multiple lines, preceded by - to indicate that it's a line continuation.

 Enable CSS source maps lets DevTools find the sources of generated CSS files, for example,
 .scss, and show them to you.

 Allow scrolling past end of file lets you scroll further than the last line in the Editor.
This video shows you how to scroll past the end of file when you enable this option.
 Allow DevTools to load resources, such as source maps, from remote file paths. Disabled by default for security reasons.
If left disabled, DevTools logs to the Console messages similar to the following:

Default indentation  lets you choose the number of spaces the
  Tab key inserts in the Editor.
This example shows how to set the default indentation to eight spaces first and then to a Tab character.
Elements
This section lists options that customize the Elements panel.
 Show user agent shadow DOM displays shadow DOM nodes in the DOM tree.

 Word wrap breaks long lines in the DOM tree and wraps them to the next line.
 Show HTML comments displays HTML comments in the DOM tree.

 Reveal DOM node on hover selects the corresponding node in the DOM tree as you hover over an element in the viewport in
  inspect mode.
This video first shows that DOM nodes aren't selected in the DOM tree. Then when you enable this option, the Elements panel selects the nodes on hover.
 Show detailed inspect tooltip displays the tooltip in the viewport in
  inspect mode as you hover over an element.

 Show rulers on hover displays the rulers in the viewport as you hover over elements in the DOM tree.

 Show CSS documentation tooltip displays a tooltip with a short description when you hover over a property in the Styles pane.
The Learn more link takes you an MDN CSS Reference on the property.

Network
This section lists options that customize the Network panel. Most of the options are the same as in the panel's settings.
 Preserve log is the same as Preserve log in the Network panel. Saves requests across page loads.
This video first shows the requests log refreshed on page reload, then persisted when you enable this option.
 Record network log is the same as
  Record network log in the Network panel. Starts or stops recording requests in the network log.

 Enable network request blocking blocks requests that match patterns in the Network request blocking drawer.
This video first shows that the requests aren't blocked. Then, after you enable this option, a pattern in the Network request blocking drawer blocks them.
 Disable cache (while DevTools is open) is the same as Disable cache in the Network panel. Disables browser cache.

Allow to generate HAR with sensitive data adds options to the Export HAR button that let you export with or without sensitive data (sanitized).
Sensitive data is the data in Cookie, Set-Cookie, and Authorization headers.

 Color-code resource types highlights requests in different colors depending on their type in the Waterfall column of the network log.

 Group network log by frame is the same as Group by frames in the Network panel. This option groups requests initiated by inline frames.

 Force ad blocking on this site blocks detected ads on the page while DevTools is open.

Performance
This section lists options that customize the Performance panel.
Flamechart mouse wheel action  assigns scroll or zoom action to your mouse wheel when you navigate the flame chart.
This example shows both scroll and zoom mouse wheel actions on a flame chart in the Performance panel.
Console
This section lists options that customize the Console. Most of the options are the same as in Console Settings.

 Hide network messages hides network messages in the Console.
This video shows how to hide network messages with this option both in ![]() Settings and in Console Settings.
Settings and in Console Settings.
 Selected context only makes the Console show messages only for the selected context: top, iframe, worker, or extension.
This video shows how to enable this option both in ![]() Settings and in Console > Settings and select the context in the Console.
Settings and in Console > Settings and select the context in the Console.
 Log XMLHttpRequests makes the Console log XHR and fetch requests.
This video shows how to enable this option both in ![]() Settings and Console > Settings and log the
Settings and Console > Settings and log the XHR finished loading messages to the Console.
 Show timestamps makes the Console show timestamps next to messages.

 Autocomplete from history makes the Console suggest commands you ran earlier as you type.
You can find the same option in Console > Settings.

 Accept autocomplete suggestion on Enter makes the Console accept the selected suggestion from the autocomplete drop-down when you press Enter.
This video shows what happens when you press Enter before and after enabling this option.
 Group similar messages in console makes the Console group similar messages together.
You can find the same option in Console > Settings.

 Show CORS errors in console makes the Console show the CORS errors it logged.
You can find the same option in Console > Settings.

 Eager evaluation makes the Console show a preview of an output as you type a command.
You can find the same option in Console > Settings.
This video shows various output previews.
 Treat code evaluation as user action turns any command you run in the Console into user interaction.
In other words, it sets navigator.userActivation.isActive to true upon evaluation. You can find the same option in Console > Settings.
This video shows the evaluation result of navigator.userActivation.isActive before and after enabling this option.
 Automatically expand console.trace() messages makes the Console display expanded
 console.trace() messages when it logs them.

 Preserve log upon navigation makes the Console log a
 Navigated to message upon every navigation and save logs across all pages.
You can find the same option in Console > Settings.

Extension
This section lists options that customize link handling for Chrome DevTools extensions.
Link handling  sets an option to open files with when you click a link to a source file, for example, in the Elements > Styles pane.
Persistence
This section lists options that control how DevTools saves the changes you make.
 Enable local overrides makes DevTools persist changes you make to sources across page loads.
For more information, see Local Overrides.
Debugger
This section lists options that control the Debugger behavior.
 Disable JavaScript lets you see how your web page looks and behaves when JavaScript is disabled.
Reload the page to see if and how the page depends on JavaScript while loading.
When JavaScript is disabled, Chrome shows the corresponding ![]() icon in the address bar and DevTools shows a warning
icon in the address bar and DevTools shows a warning ![]() icon next to Sources.
icon next to Sources.
 Disable async stack traces hides the "full story" of the async operation in the Call Stack.
By default, the Debugger tries to trace async operations if the framework you're using supports such tracing.

For more information, see View async stack traces.
Global
This section lists options that have global effects in DevTools.
 Auto-open DevTools for popups opens DevTools when you click links that open new tabs. That is, all links with
 target=_blank.
This video first shows how to click a link and open a new tab *without* DevTools. Then when you enable this option, a new tab opens *with* DevTools.
 Search as you type makes DevTools "jump" to the first search result as you type your search query. If disabled, DevTools takes you to the result only when you press Enter.
This video first shows how DevTools "jumps" as you type a search query. Then when you enable this option, DevTools takes you to the first result when you press Enter.
Sync
This section lets you set up the synchronization of settings between devices.
 Enable settings sync lets you sync DevTools settings across multiple devices.
To use this setting, first enable Chrome Sync. For more information, see Sync settings.