


This page is a reference of features related to the Chrome DevTools Console. It assumes that you're already familiar with using the Console to view logged messages and run JavaScript. If not, see Get Started.
If you're looking for the API reference on functions like console.log() see Console API
Reference. For the reference on functions like monitorEvents() see Console Utilities API
Reference.
Open the Console
You can open the Console as a panel or as a tab in the Drawer.
Open the Console panel
Press Control+Shift+J or Command+Option+J (Mac).
To open the Console from the Command Menu, start typing Console and then run the Show
Console command that has the Panel badge next to it.

Open the Console in the Drawer
Press Escape or click Customize And Control DevTools
![]() and then
select Show Console Drawer.
and then
select Show Console Drawer.

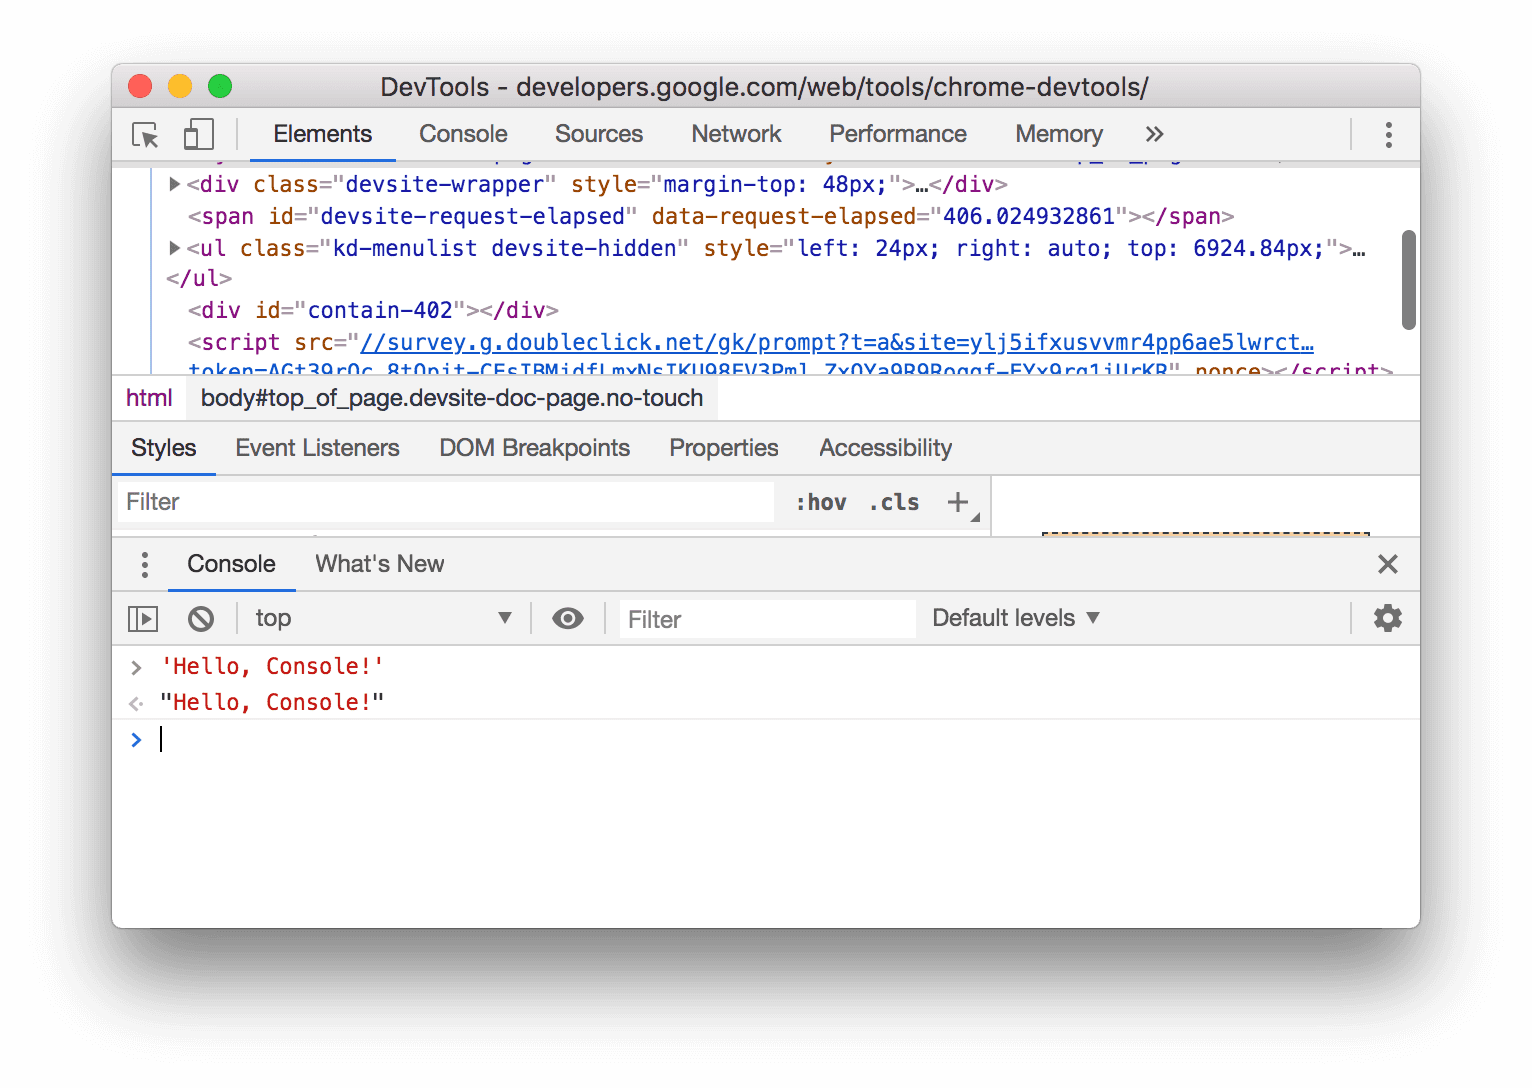
The Drawer pops up at the bottom of your DevTools window, with the Console tab open.
To open the Console tab from the Command Menu, start typing Console and then run the Show
Console command that has the Drawer badge next to it.

Open Console Settings
Click ![]() Console Settings in the top-right corner of the Console.
Console Settings in the top-right corner of the Console.
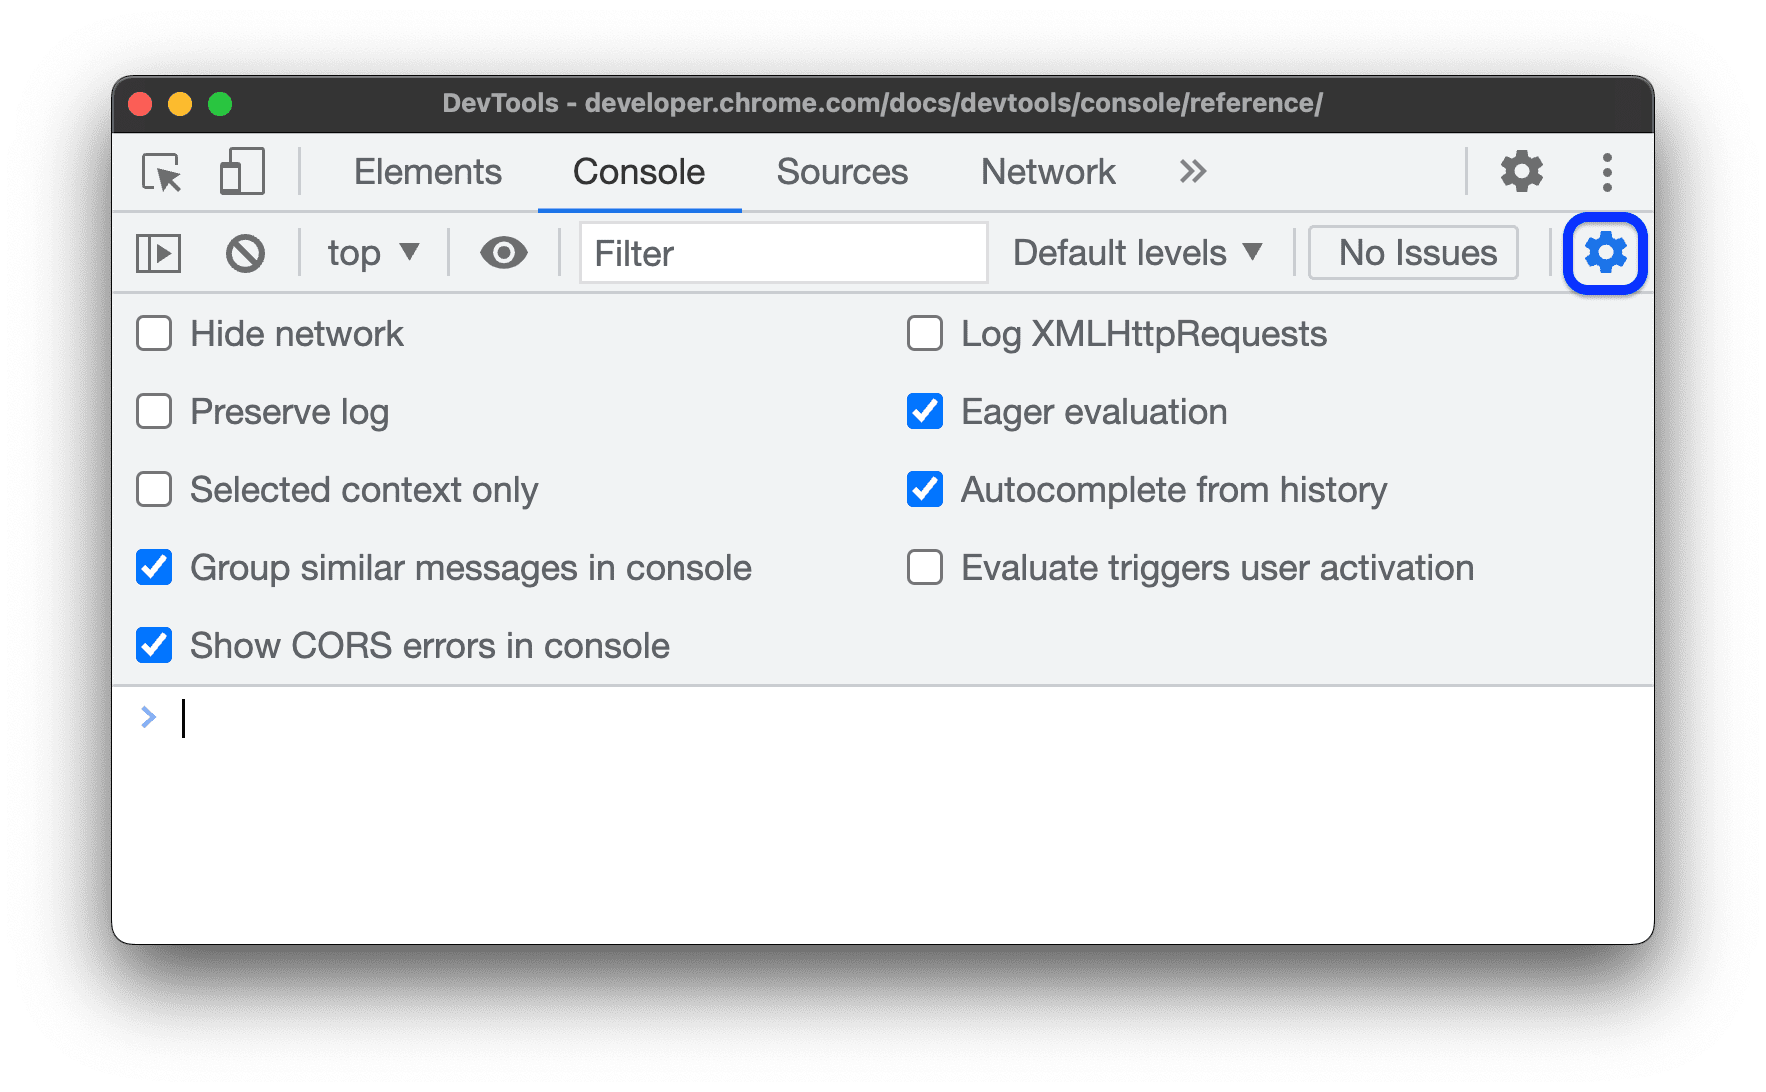
The links below explain each setting:
- Hide network
- Preserve log
- Selected context only
- Group similar messages in console
- Show CORS errors in console
- Log XMLHttpRequests
- Eager evaluation
- Autocomplete from history
Open the Console Sidebar
Click Show Console Sidebar
![]() to show
the Sidebar, which is useful for filtering.
to show
the Sidebar, which is useful for filtering.
View messages
This section contains features that change how messages are presented in the Console. See View messages for a hands-on walkthrough.
Disable message grouping
Open Console Settings and disable Group similar to disable the Console's default message grouping behavior. See Log XHR and Fetch requests for an example.
View messages from breakpoints
The Console marks messages triggered by breakpoints in the following way:
console.*calls in conditional breakpoints with an orange question mark?- Logpoint messages with pink two dots
..

To jump to the inline breakpoint editor in the Sources panel, click the anchor link next to the breakpoint message.
View stack traces
The Console automatically captures stack traces for errors and warnings. A stack trace is a history of function calls (frames) that led to the error or warning. The Console shows them in reverse order: the latest frame is at the top.
To view a stack trace, click the ![]() expand icon next to an error or warning.
expand icon next to an error or warning.

View error causes in stack traces
The Console can show you chains of error causes in the stack trace, if any.
To make debugging easier, you can specify error causes when catching and rethrowing errors. As the Console walks up the cause chain, it prints each error stack with a Caused by: prefix, so you can find the original error.

View async stack traces
If supported by the framework you are using or when directly using browser scheduling primitives, such as setTimeout, DevTools can trace async operations by linking both parts of the async code together.
In this case, the stack trace shows the "full story" of the async operation.

Show known third-party frames in stack traces
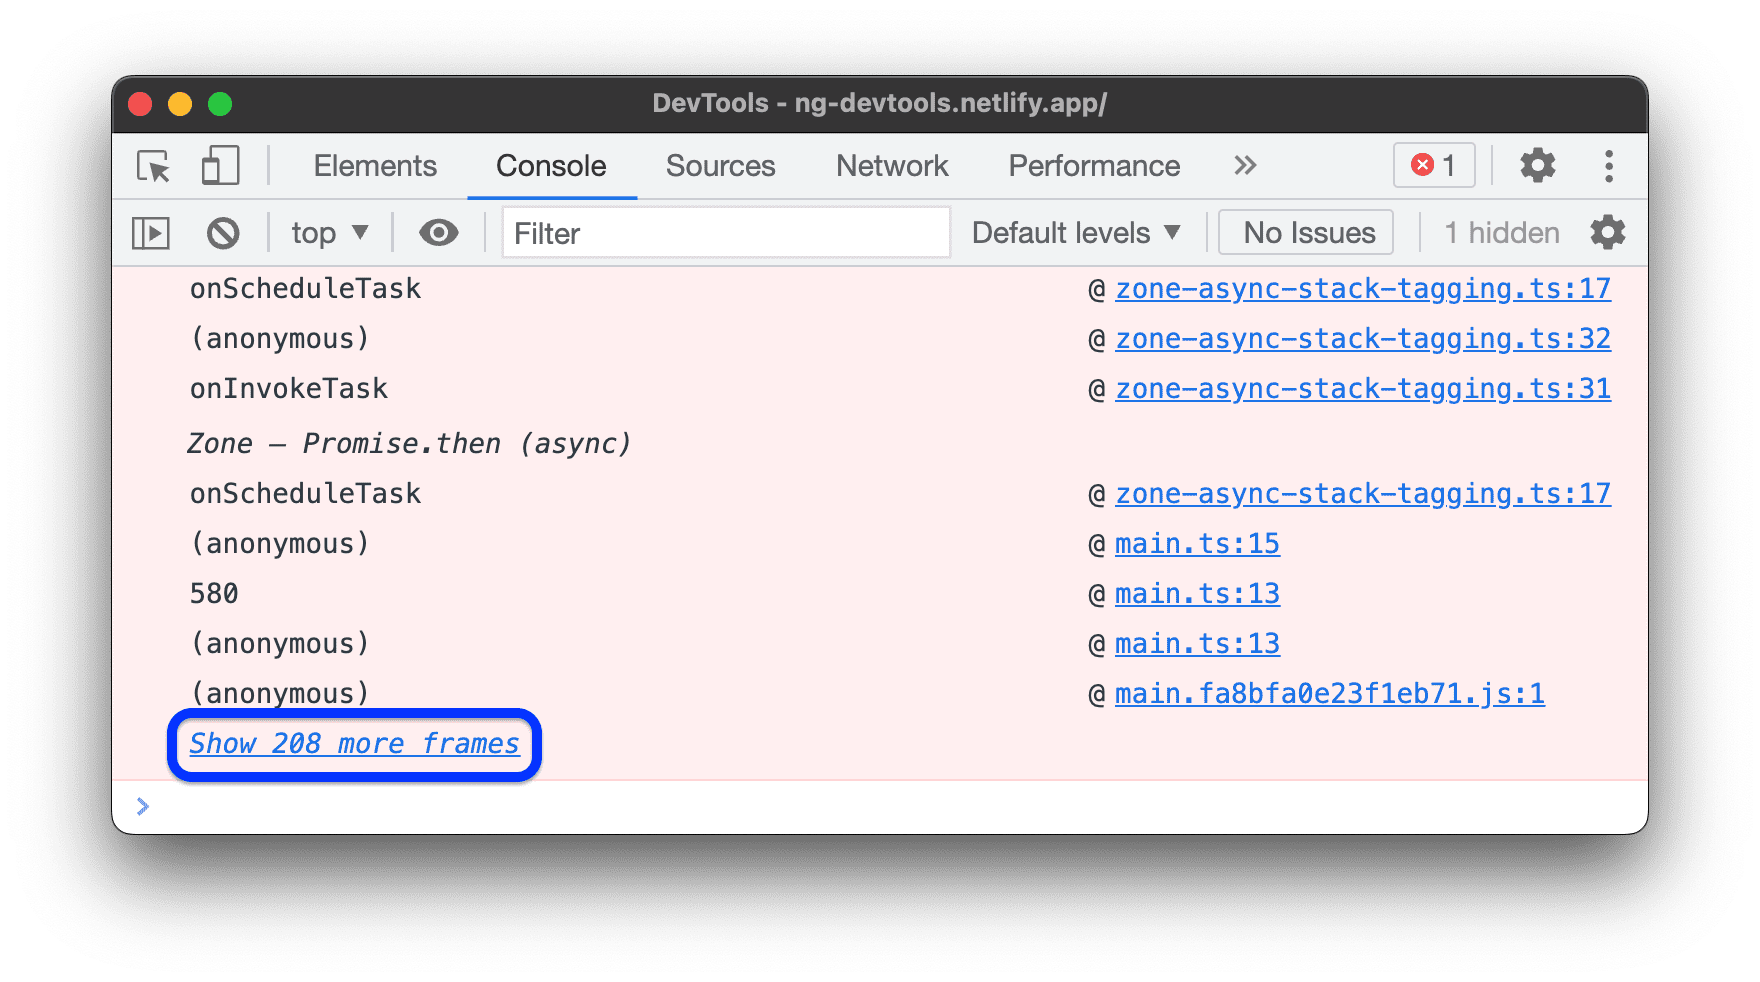
When source maps include the ignoreList field, by default, the Console hides from stack traces the third-party frames from sources generated by bundlers (for example, webpack) or frameworks (for example, Angular).
To view the full stack trace including third-party frames, click Show N more frames at the bottom of the stack trace.
To always view the full stack trace, disable the ![]() Settings > Ignore List > Automatically add known third-party scripts to ignore list setting.
Settings > Ignore List > Automatically add known third-party scripts to ignore list setting.

Log XHR and Fetch requests
Open Console Settings and enable Log XMLHttpRequests to log all XMLHttpRequest and
Fetch requests to the Console as they happen.

The top message in the example above shows the Console's default grouping behavior. The example below shows how the same log looks after disabling message grouping.

Persist messages across page loads
By default the Console clears whenever you load a new page. To persist messages across page loads, Open Console Settings and then enable the Preserve Log checkbox.
Hide network messages
By default the browser logs network messages to the Console. For example, the top message in the following example represents a 404.

To hide network messages:
- Open Console Settings.
- Enable the Hide Network checkbox.
Show or hide CORS errors
The Console can show CORS errors if network requests fail due to Cross-Origin Resource Sharing (CORS).
To show or hide CORS errors:
- Open Console Settings.
- Check or clear the Show CORS errors in the console checkbox.

If the console is set to show CORS errors and you encounter them, you can click the following buttons next to errors:
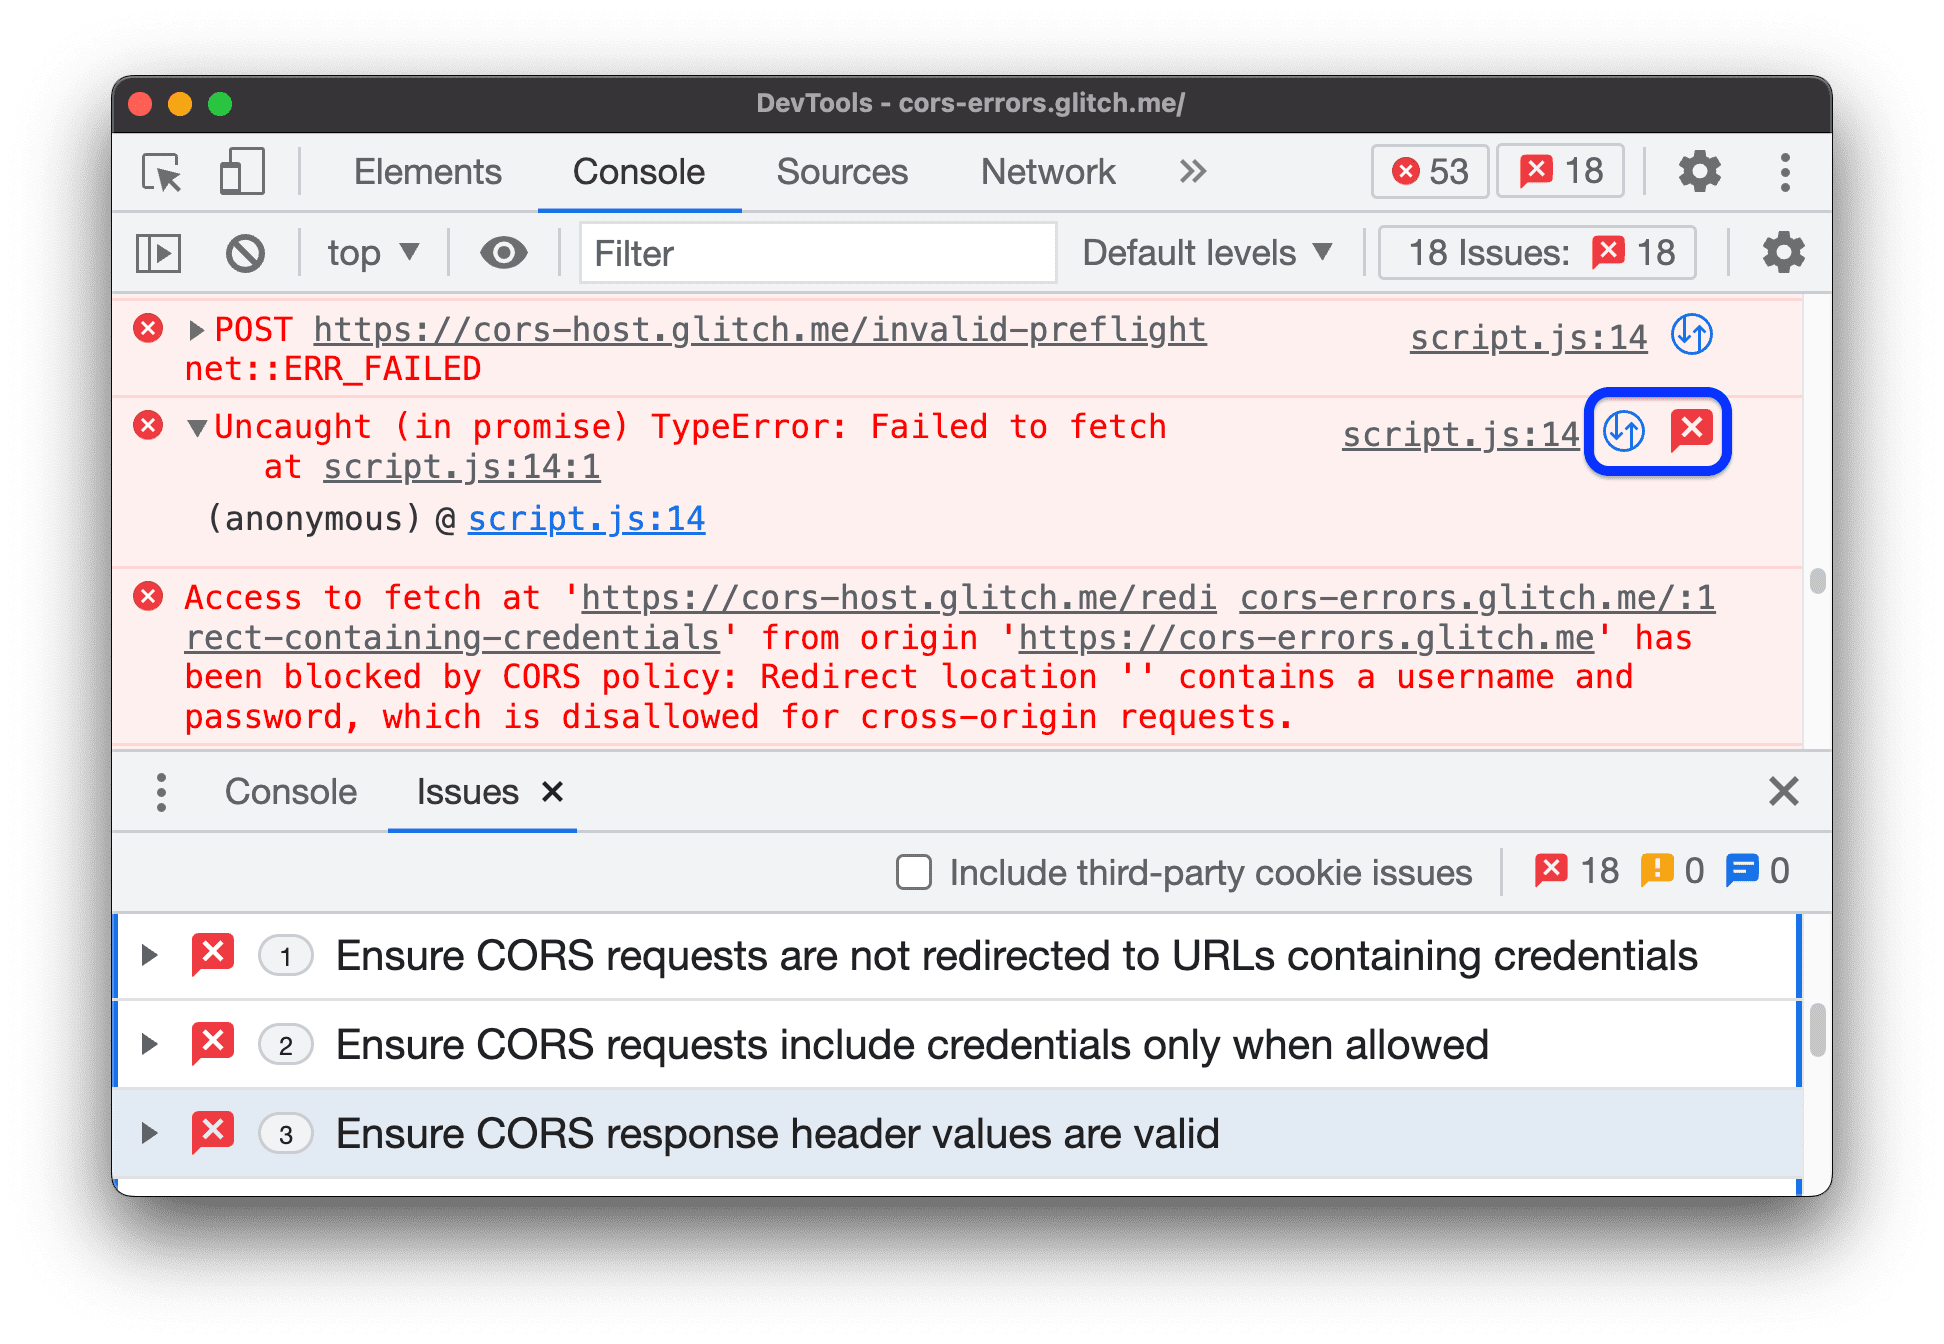
 to open the request with a CORS-related
 TypeErrorin the Network panel. to get a potential solution on the Issues tab.
Filter messages
There are many ways to filter out messages in the Console.
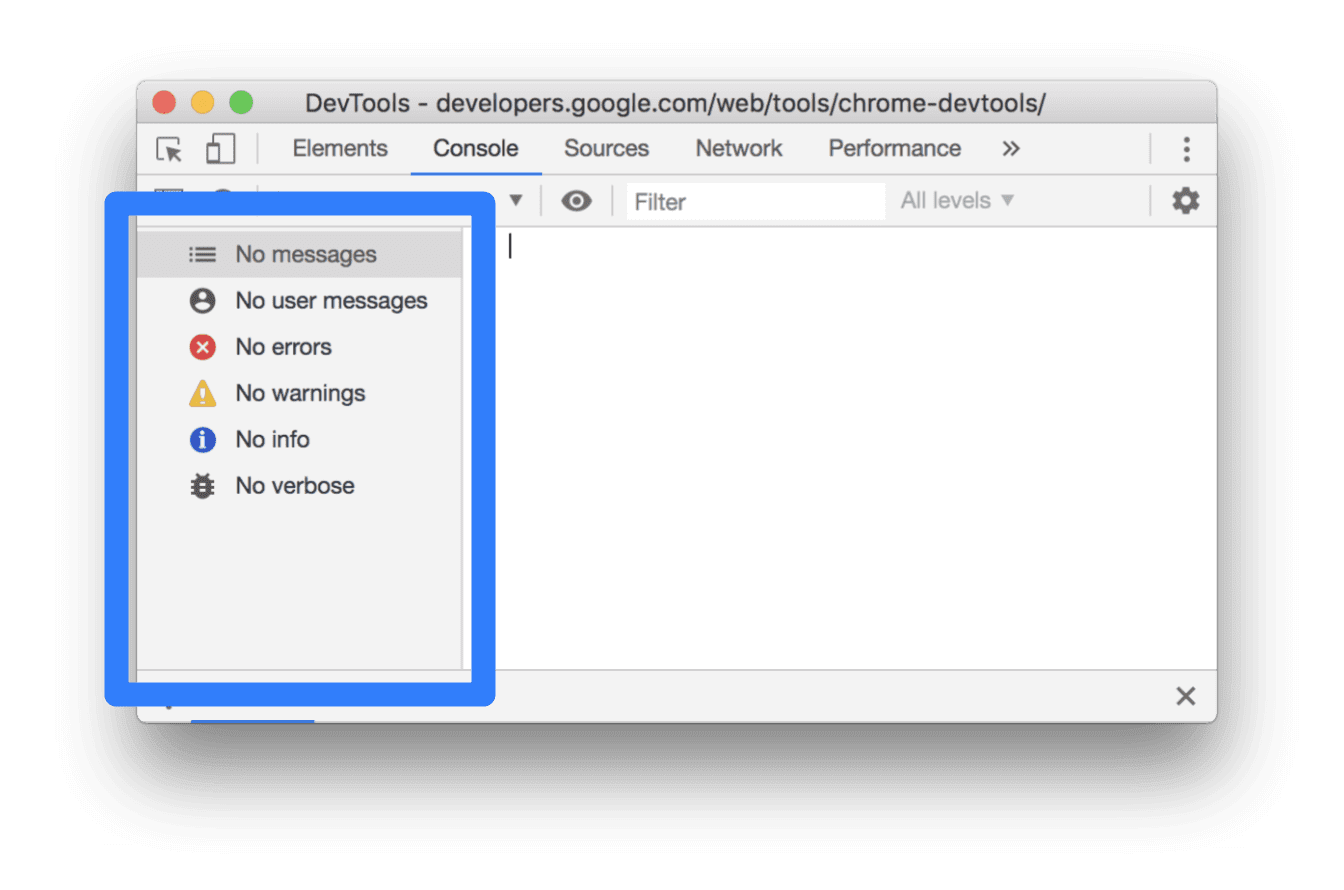
Filter out browser messages
Open the Console Sidebar and click User Messages to only show messages that came from the page's JavaScript.

Filter by log level
DevTools assigns most of console.* methods severity levels.
There are four levels:
VerboseInfoWarningError
For example, console.log() is in the Info group, whereas
console.error() is in the Error group. The Console API Reference describes the severity
level of each applicable method.
Every message that the browser logs to the Console has a severity
level too. You can hide any level of messages that you're not interested in. For example, if you're
only interested in Error messages, you can hide the other 3 groups.
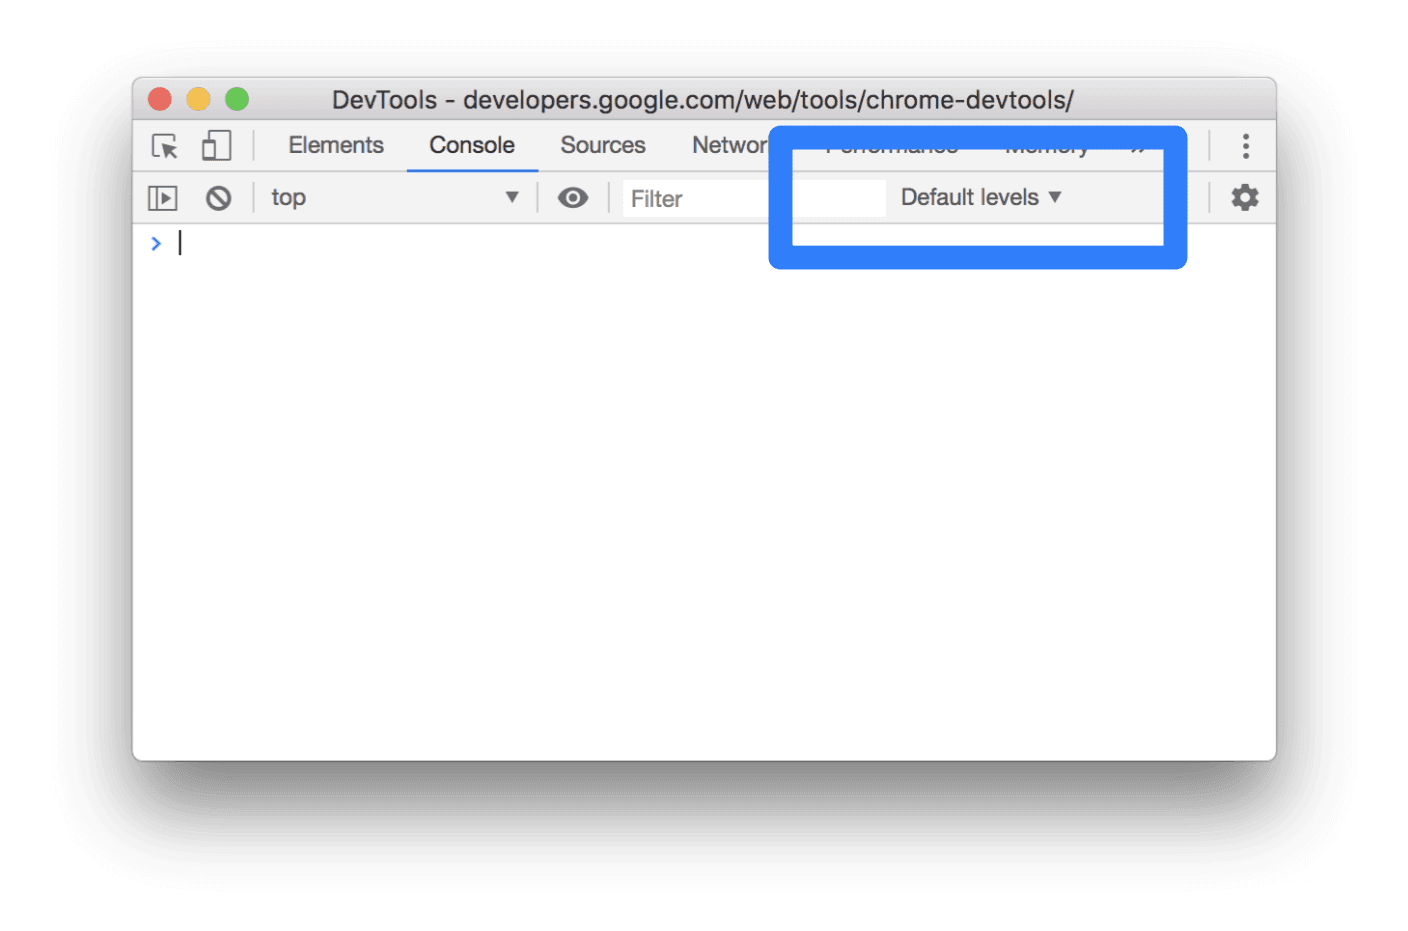
Click the Log Levels drop-down to enable or disable Verbose, Info, Warning or Error
messages.
You can also filter by log level by ![]() opening the Console Sidebar and then clicking Errors,
Warnings, Info, or Verbose.
opening the Console Sidebar and then clicking Errors,
Warnings, Info, or Verbose.

Filter messages by URL
Type url: followed by a URL to only view messages that came from that URL. After you type url:
DevTools shows all relevant URLs.

Domains also work. For example, if https://example.com/a.js and
https://example.com/b.js are logging messages, url:https://example.com enables you to focus on
the messages from these 2 scripts.
To hide all messages from a specified URL, type -url: followed by the URL, for example, https://b.wal.co. This is a negative URL filter.

You can also show messages from a single URL by opening the Console Sidebar, expanding the User Messages section, and then clicking the URL of the script containing the messages you want to focus on.

Filter out messages from different contexts
Suppose that you've got an ad on your page. The ad is embedded in an <iframe> and is generating a
lot of messages in your Console. Because this ad is in a different JavaScript context, one way
to hide its messages is to open Console Settings and enable the Selected Context Only
checkbox.
Filter out messages that don't match a regular expression pattern
Type a regular expression such as /[foo]\s[bar]/ in the Filter text box to filter out any
messages that don't match that pattern. Spaces are not supported, use \s instead. DevTools checks if the pattern is found in the message text
or the script that caused the message to be logged.
For example, the following filters out all messages that don't match /[gm][ta][mi]/.
![Filtering out any messages that don't match /[gm][ta][mi]/.](/static/docs/devtools/console/reference/image/filtering-any-messages-82d76b2bac549.png)
Search for text in logs
To search for text in log messages:
- To open a built-in search bar, press Command+F (Mac) or Ctrl+F (Windows, Linux).
- In the bar, type your query. In this example the query is
legacy.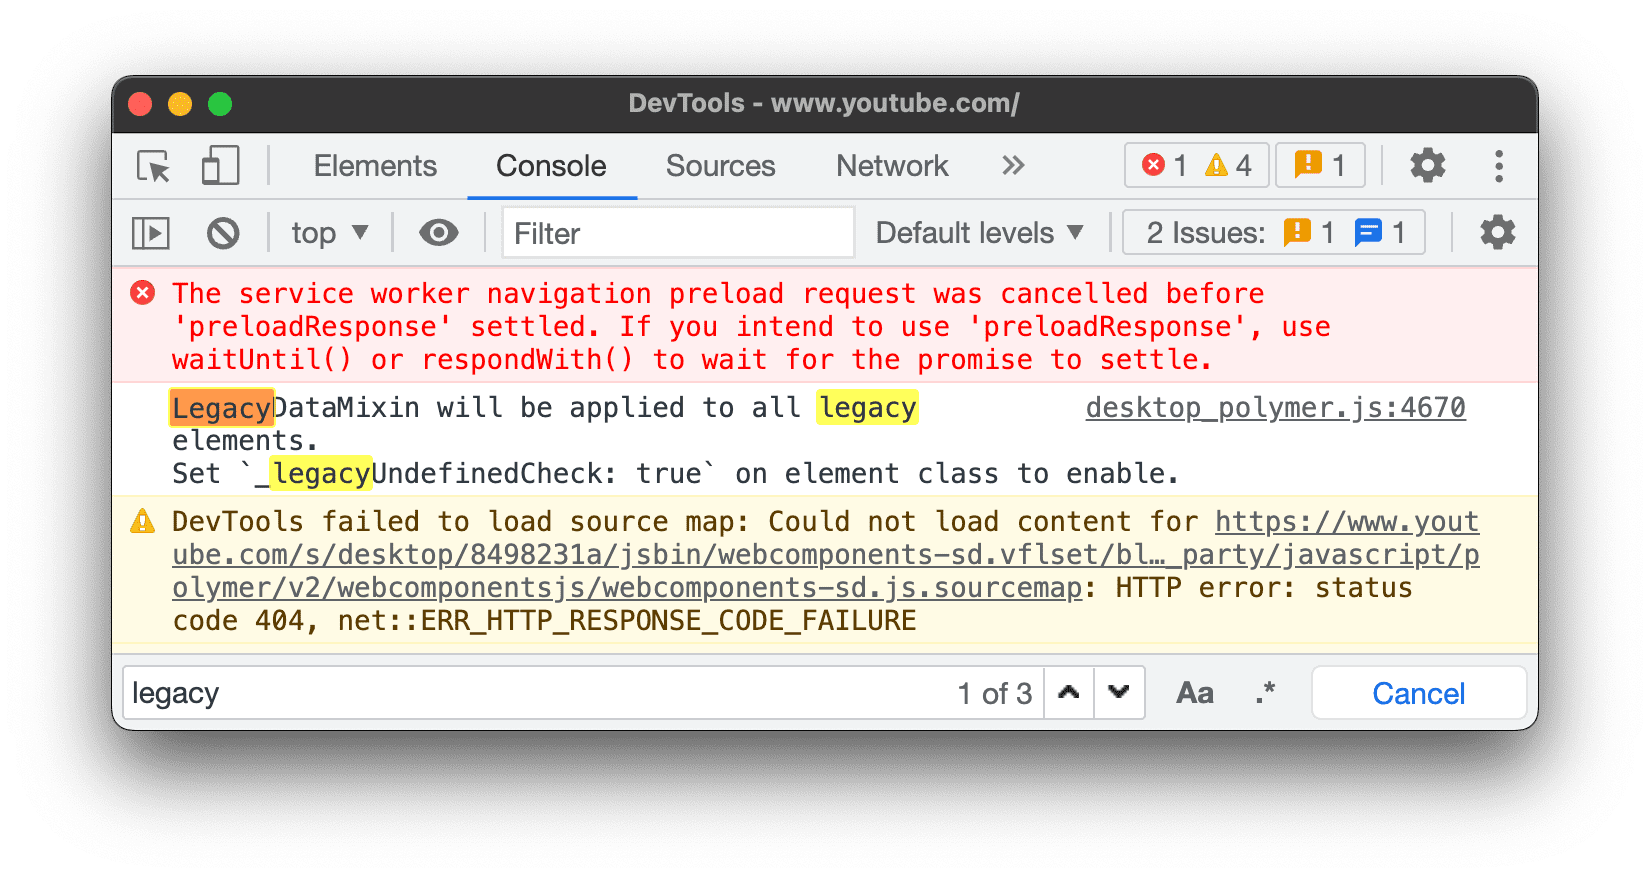 Optionally, you can:
- Click
 Match Case to make your query case-sensitive.
 - Click
 Use Regular Expression to search using a RegEx expression.
- Click
- Press Enter. To jump to previous or next search result, press the up or down button.
Run JavaScript
This section contains features related to running JavaScript in the Console. See Run JavaScript for a hands-on walkthrough.
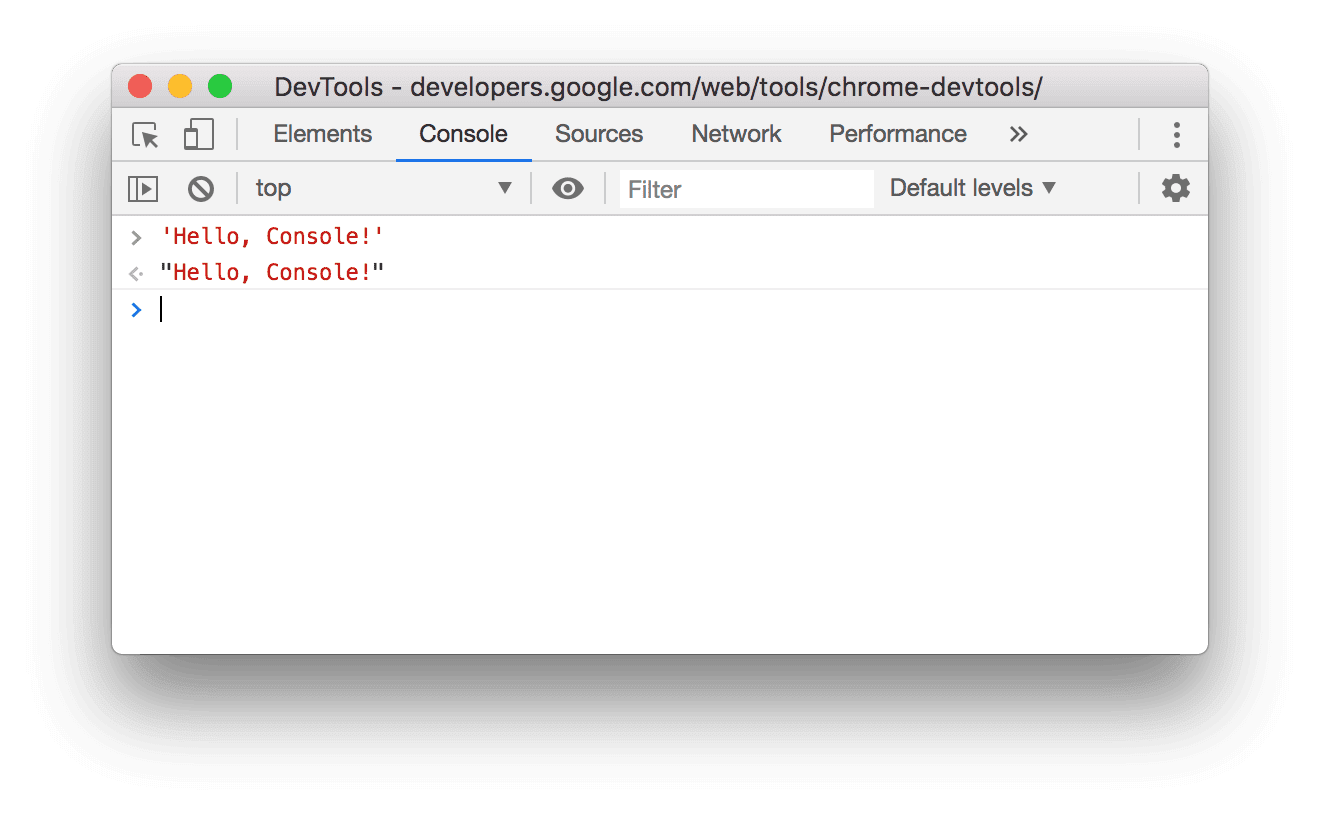
String copy options
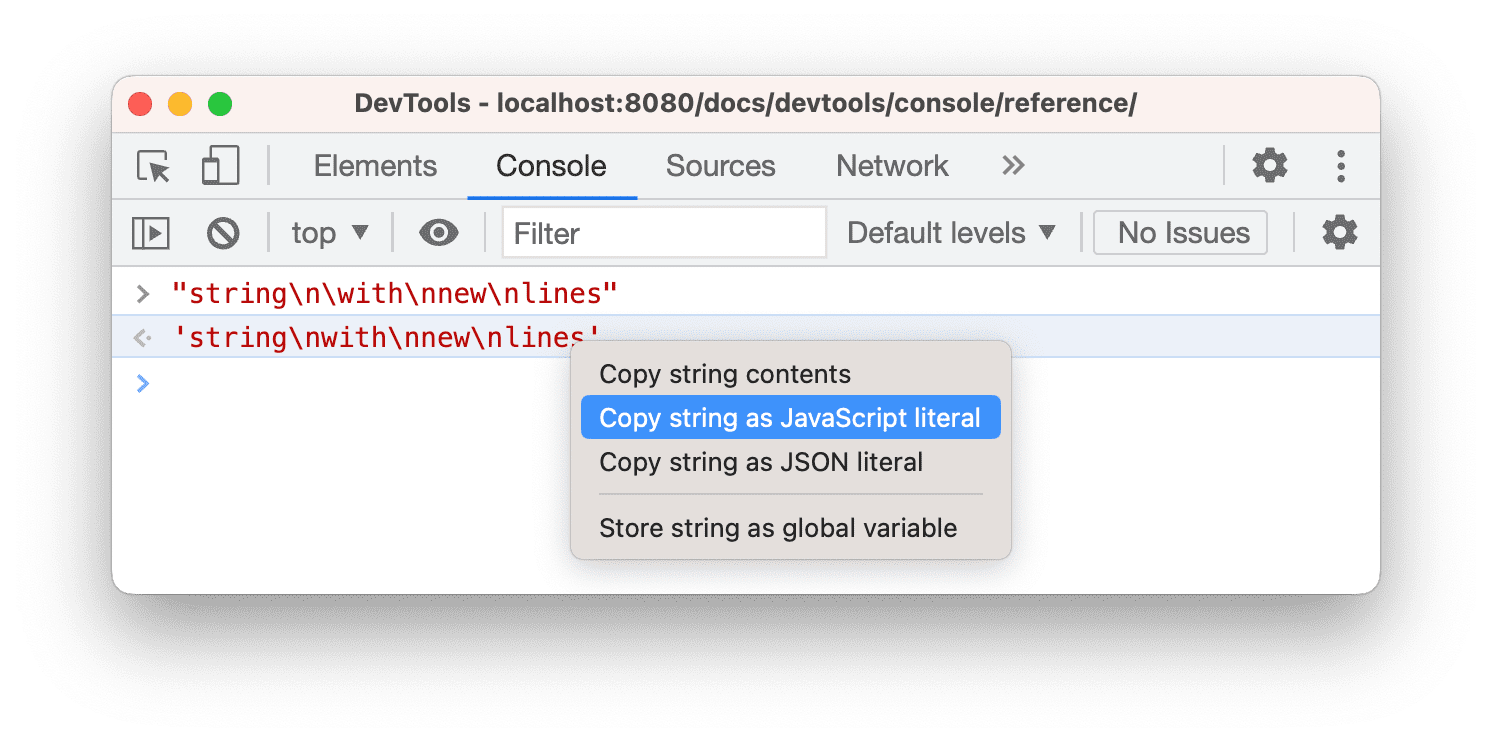
The console outputs strings as valid JavaScript literals by default. Right-click an output and choose between three copy options:
- Copy as JavaScript literal. Escapes appropriate special characters and wraps the string in either single quotes, double quotes, or backticks depending on the content.
- Copy string contents. Copies the exact raw string to the clipboard, including new lines and other special characters.
- Copy as JSON literal. Formats the string to valid JSON.
Re-run previous expressions and clear history
Press the Up Arrow key to cycle through the history of JavaScript expressions that you ran earlier in the Console. Press Enter to run that expression again.
To clear the console history, right-click an empty space in the Console and select Clear console history from the context menu.
Clear, copy, and save messages
To clear the Console window, do one of the following:
- Click block Clear console in the action bar at the top.
- Press Ctrl+L or Cmd+K.
- Right-click an empty space in the Console and select Clear console from the context menu.
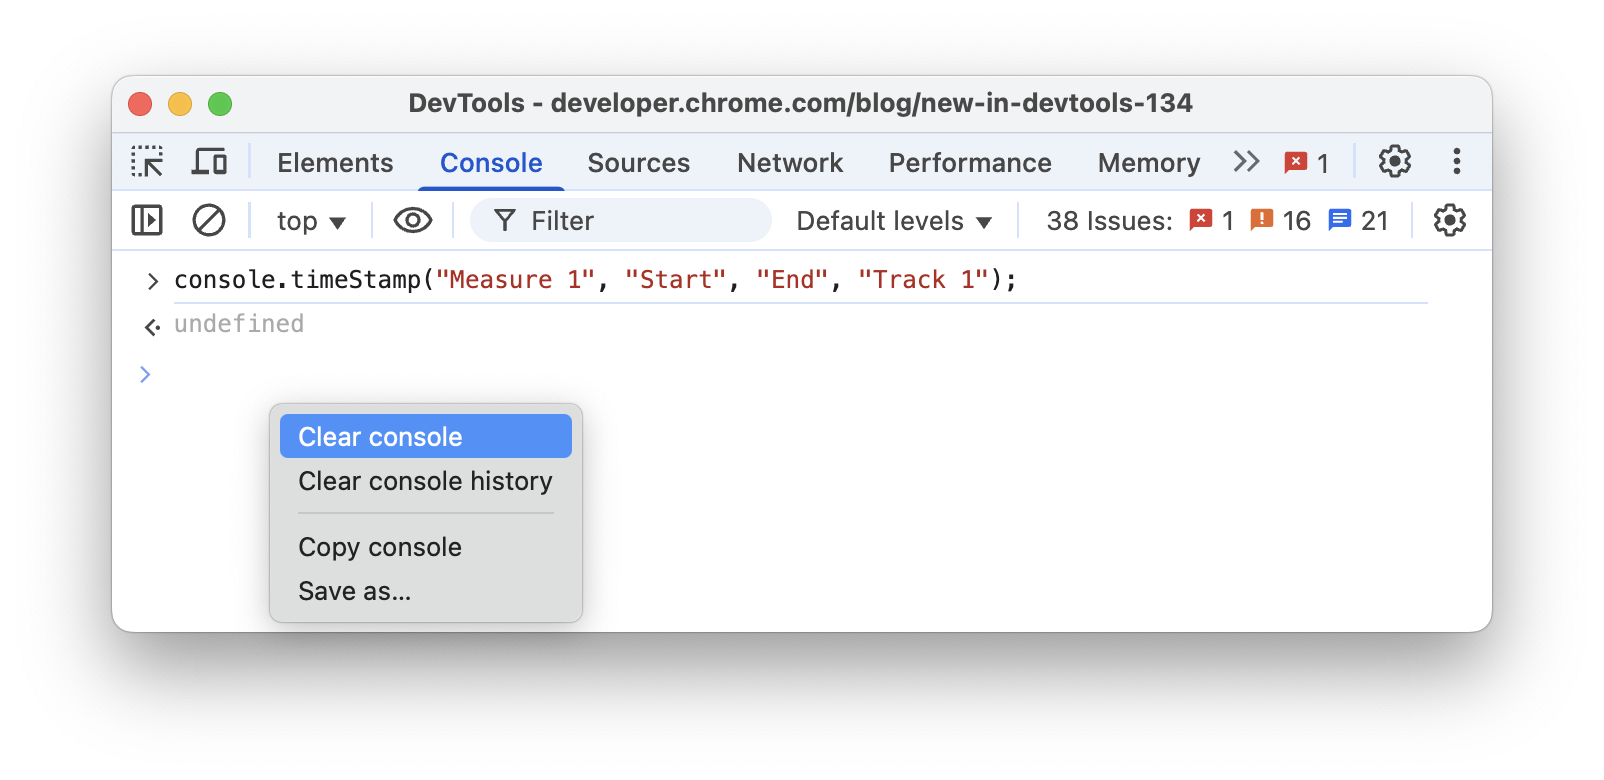
From the context menu, you can also:
- Copy console: Copy all current messages to clipboard, but not the history of previous commands.
- Save as...: Save all current messages to a plaintext
.logfile.
Watch an expression's value in real-time with Live Expressions
If you find yourself typing the same JavaScript expression in the Console repeatedly, you might find it easier to create a Live Expression. With Live Expressions, you type an expression once and then pin it to the top of your Console. The value of the expression updates in near real-time. See Watch JavaScript Expression Values In Real-Time With Live Expressions.
Disable Eager Evaluation
As you type JavaScript expressions in the Console, Eager Evaluation shows a preview of that expression's return value. Open Console Settings and disable the Eager Evaluation checkbox to turn off the return value previews.
Trigger user activation with evaluation
User activation is the state of a browsing session that depends on user actions. An "active" state means the user is currently interacting with the page or has interacted since page load.
To trigger user activation with any evaluation, open Console Settings and
check ![]() Treat code evaluation as user action.
Treat code evaluation as user action.
Disable autocomplete from history
As you type out an expression, the Console's autocomplete popup shows expressions that you ran
earlier. These expressions are prepended with the > character. In the following example, DevTools earlier evaluated document.querySelector('a') and document.querySelector('img').
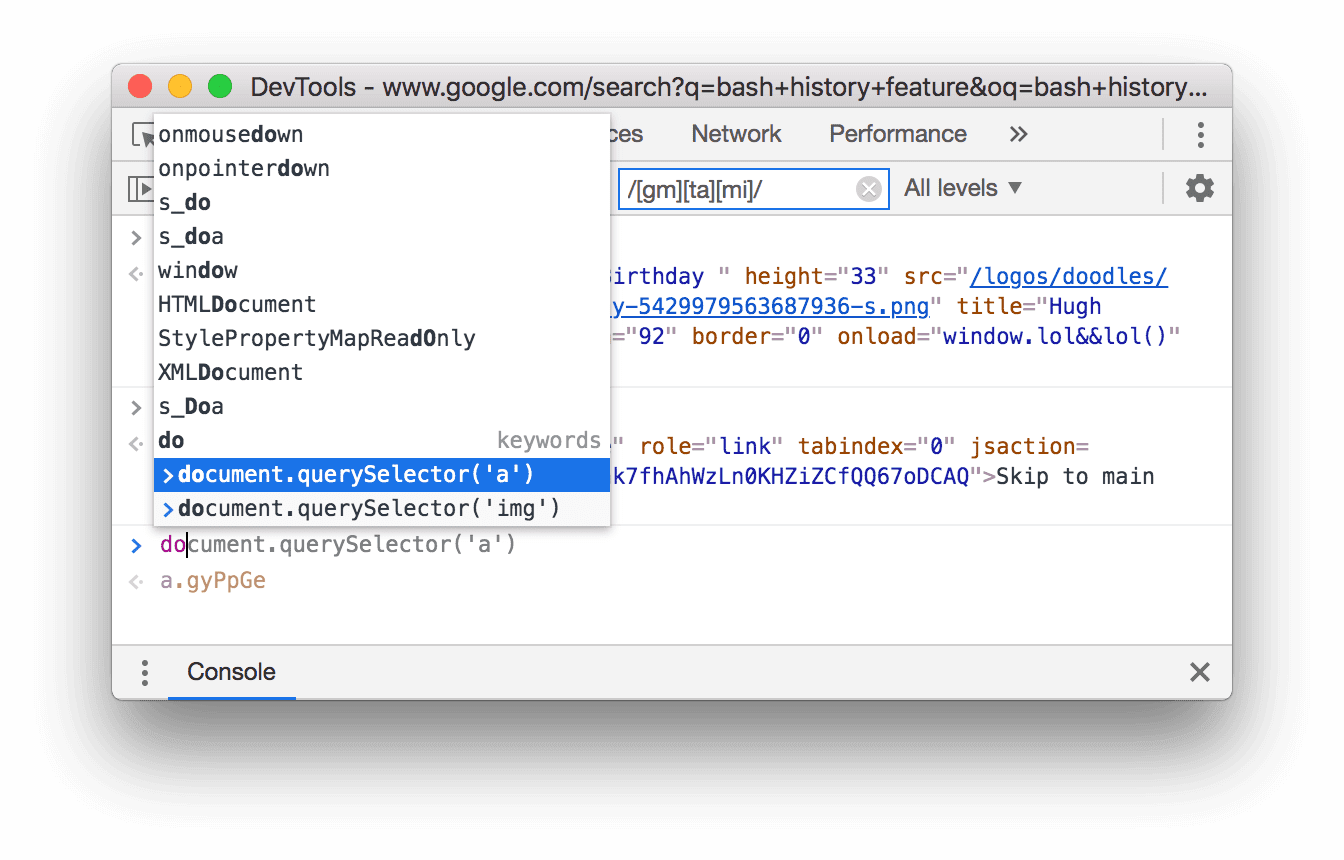
Open Console Settings and disable the Autocomplete From History checkbox to stop showing expressions from your history.
Select JavaScript context
By default the JavaScript Context drop-down is set to top, which represents the main document's browsing context.

Suppose you have an ad on your page embedded in an <iframe>. You want to run JavaScript in order
to tweak the ad's DOM. To do this, you first need to select the ad's browsing context from the
JavaScript Context drop-down.

Inspect object properties
The Console can display an interactive list of properties of a JavaScript object you specify.
To browse the list, type the object name into the Console and press Enter.
To inspect the properties of DOM objects, follow the steps in View the properties of DOM objects.
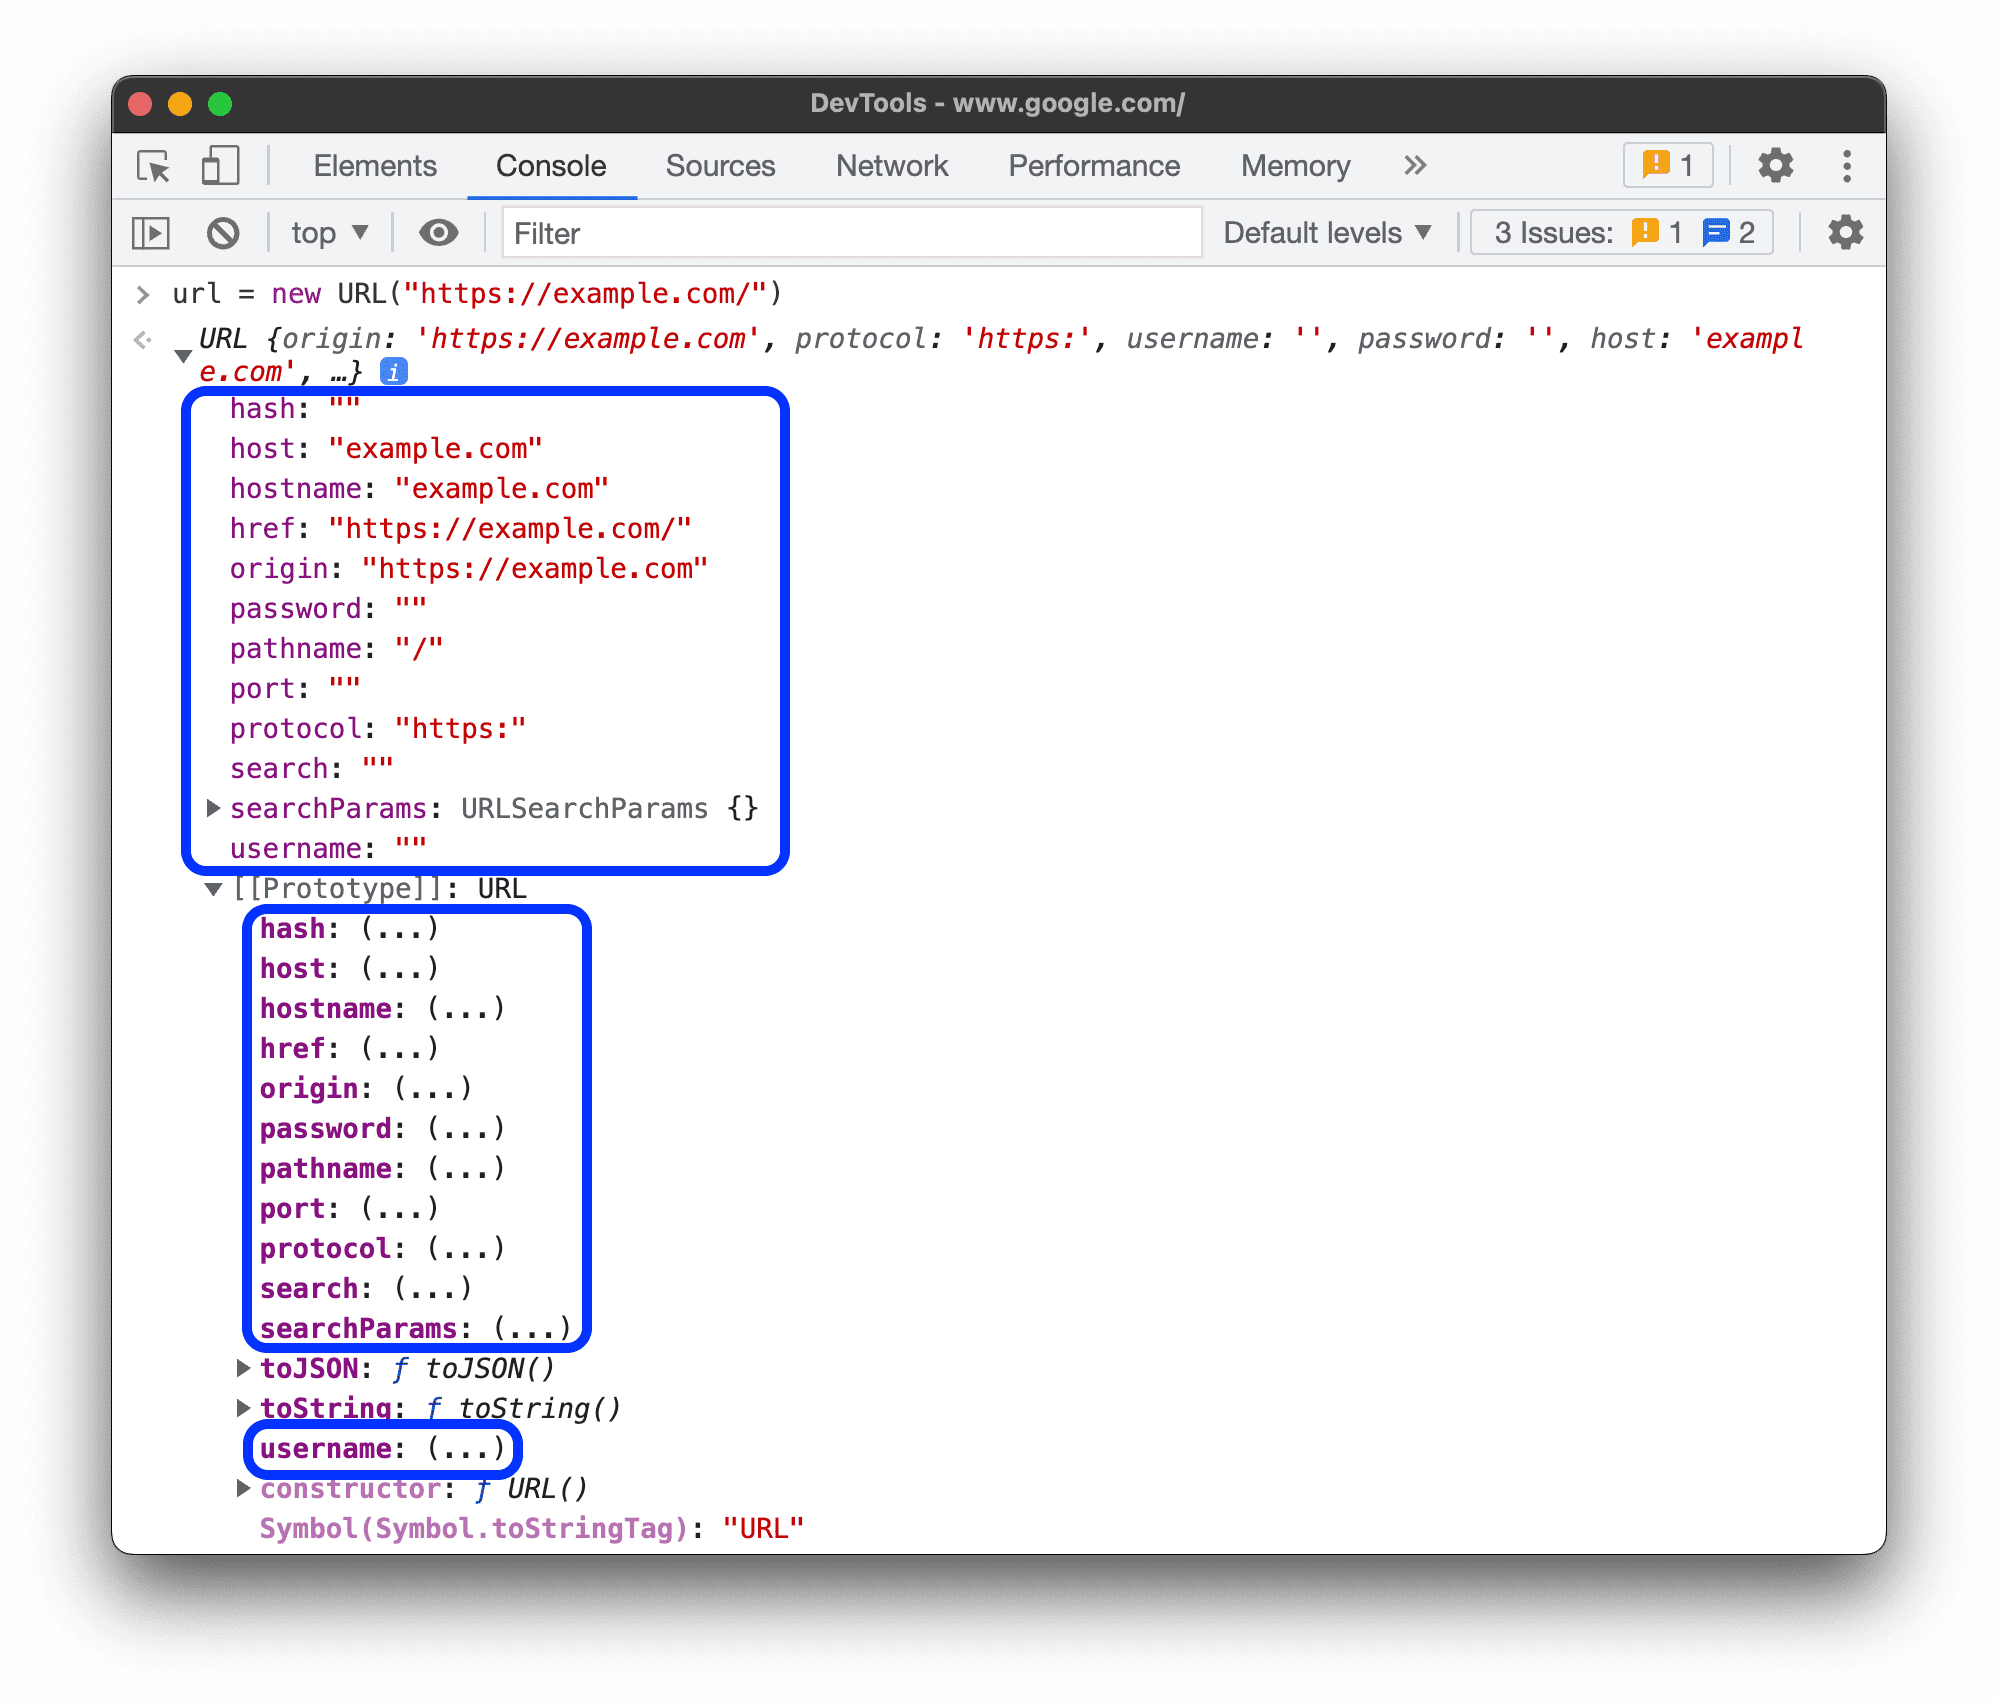
Spot own and inherited properties
The Console sorts own object properties first and highlights them in bold font.

Properties inherited from the prototype chain are in regular font. The Console displays them on the object itself by evaluating the corresponding native accessors of built-in objects.
Evaluate custom accessors
By default, DevTools doesn't evaluate accessors you create.
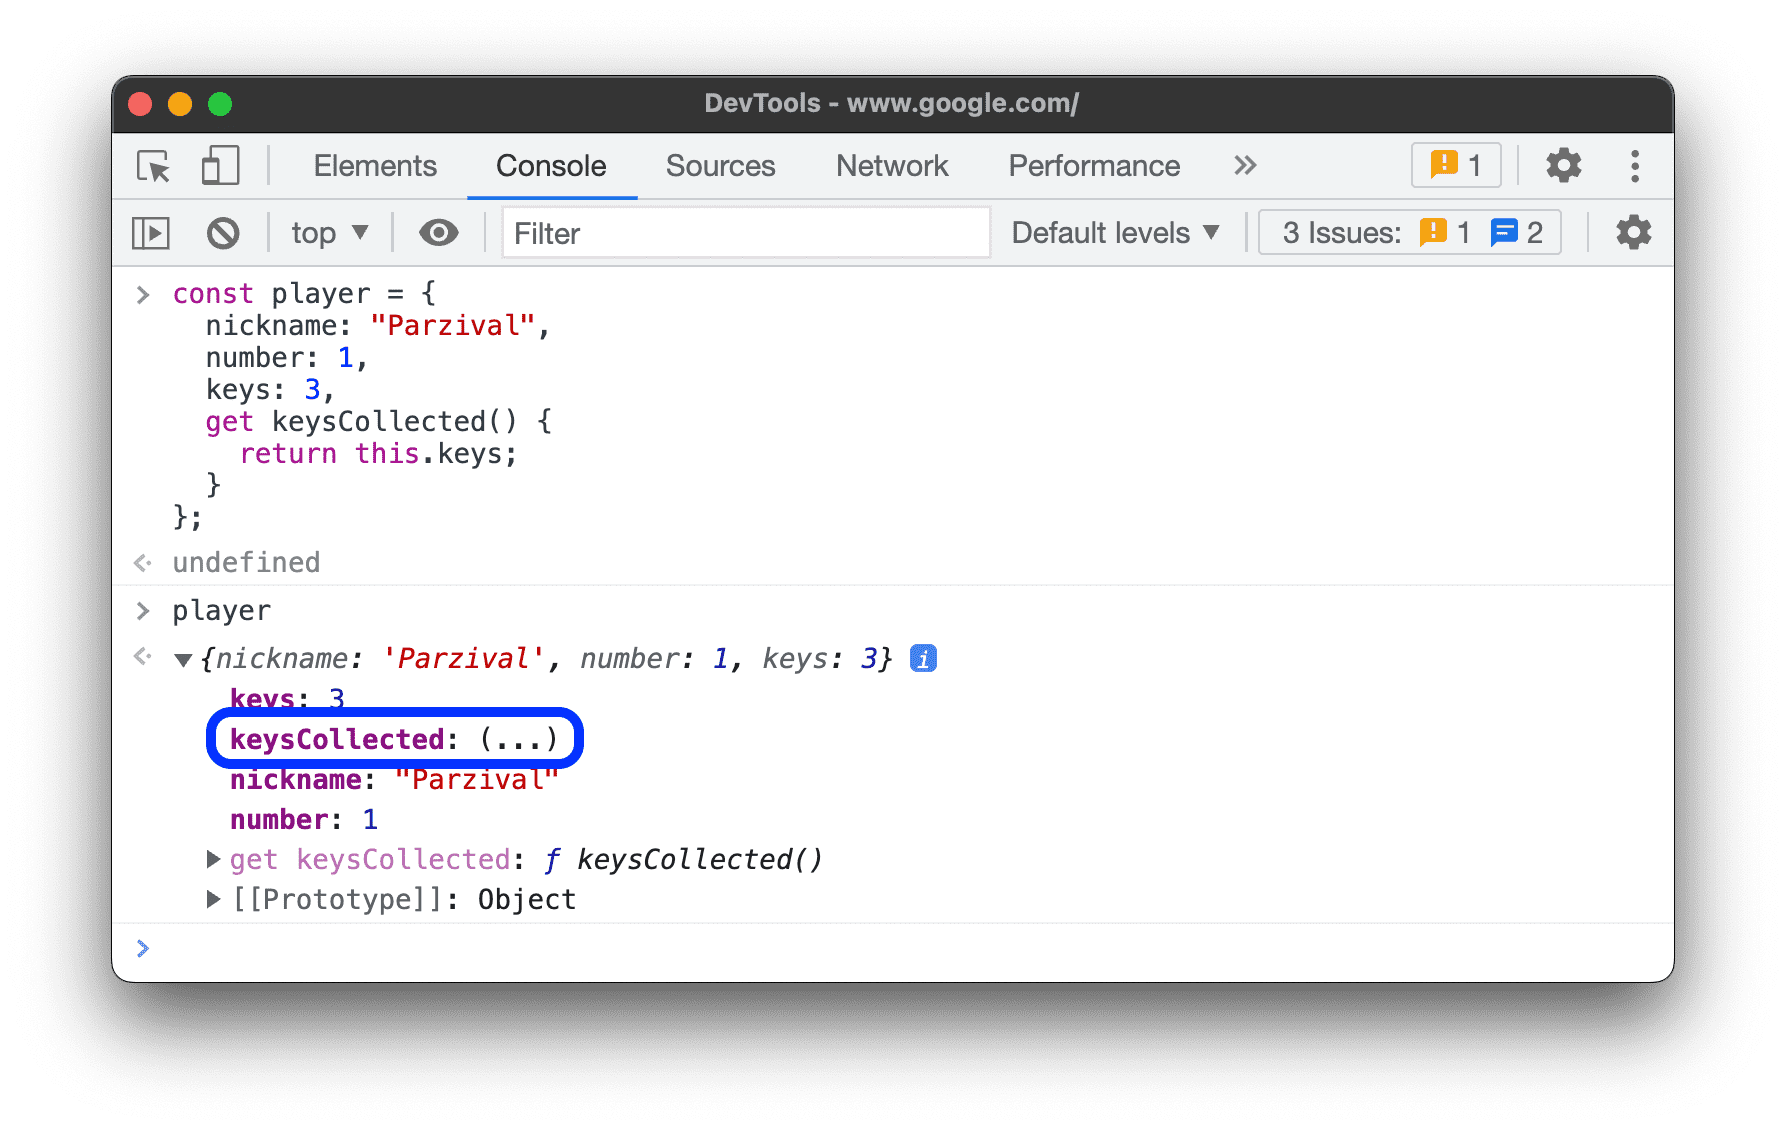 To evaluate a custom accessor on an object, click
 (...).

Spot enumerable and non-enumerable properties
Enumerable properties are bright in color. Non-enumerable properties are muted.
 Enumerable properties can be iterated over with the
 for … in loop or Object.keys() method.
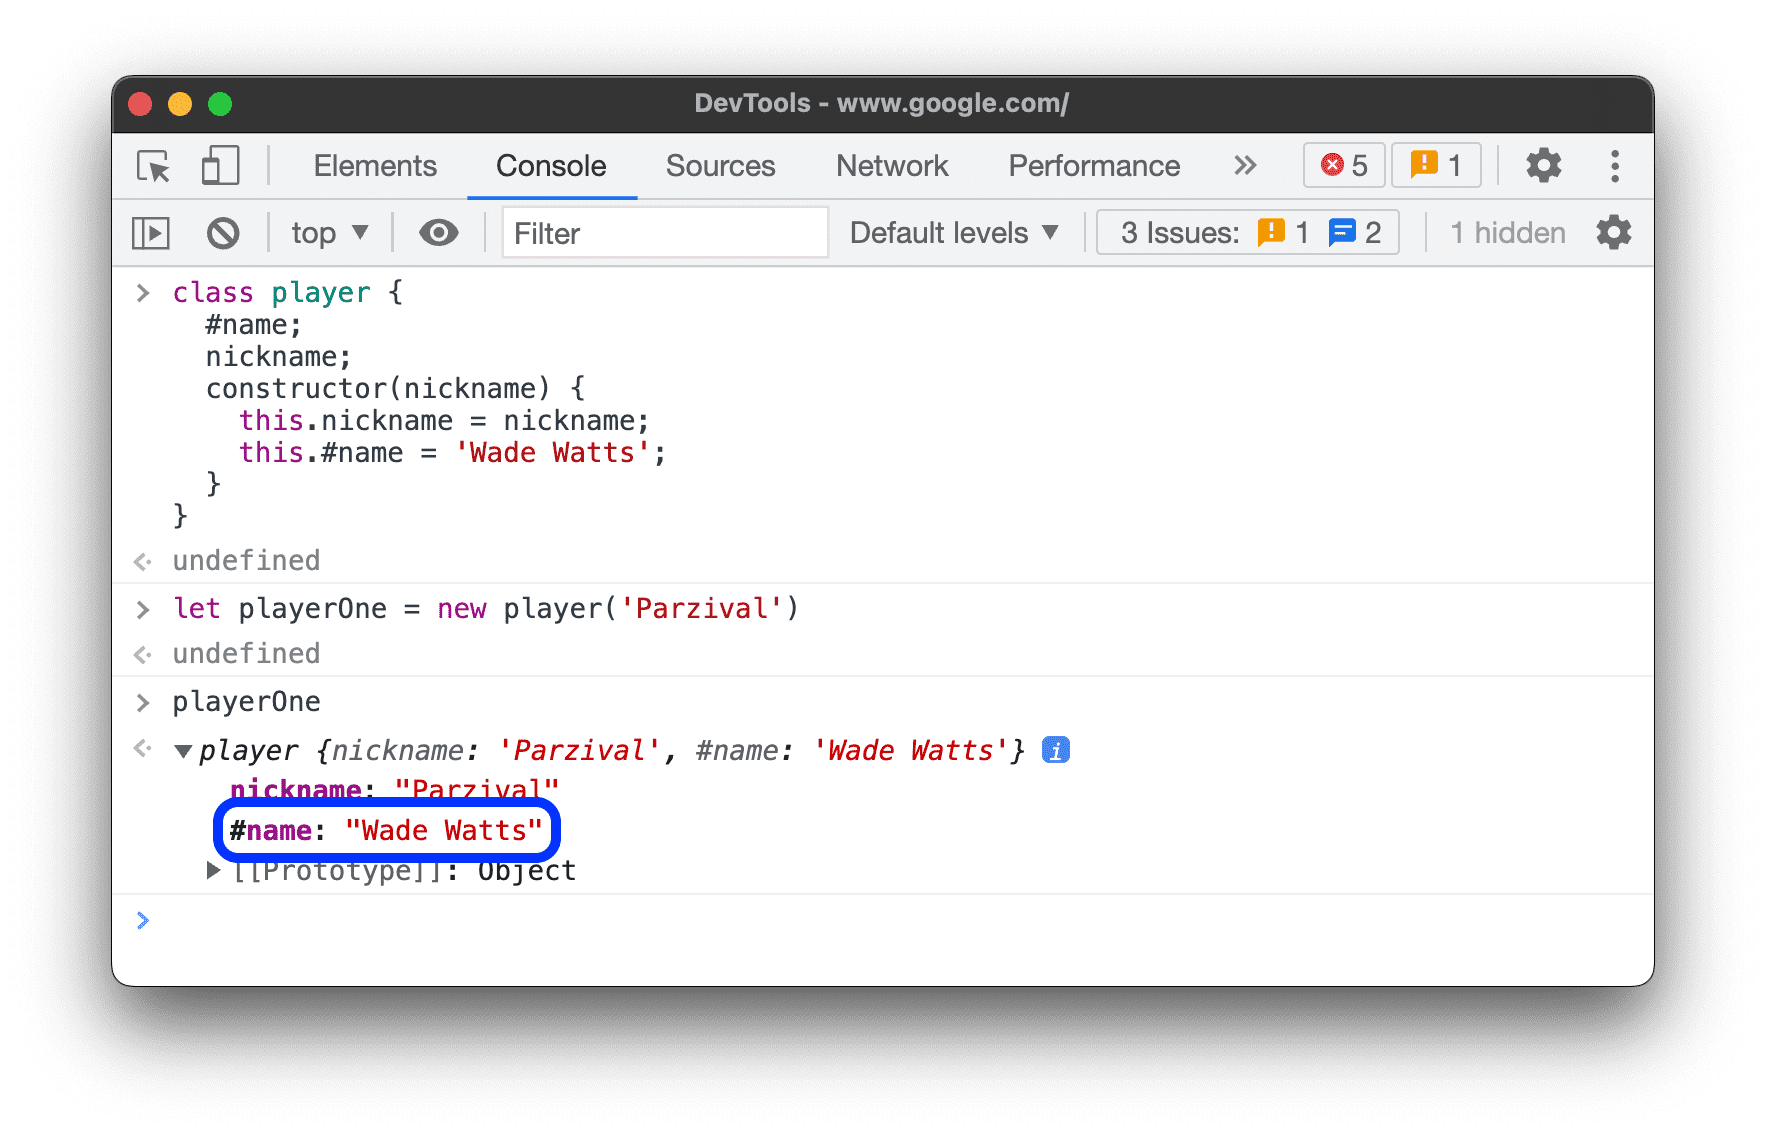
Spot private properties of class instances
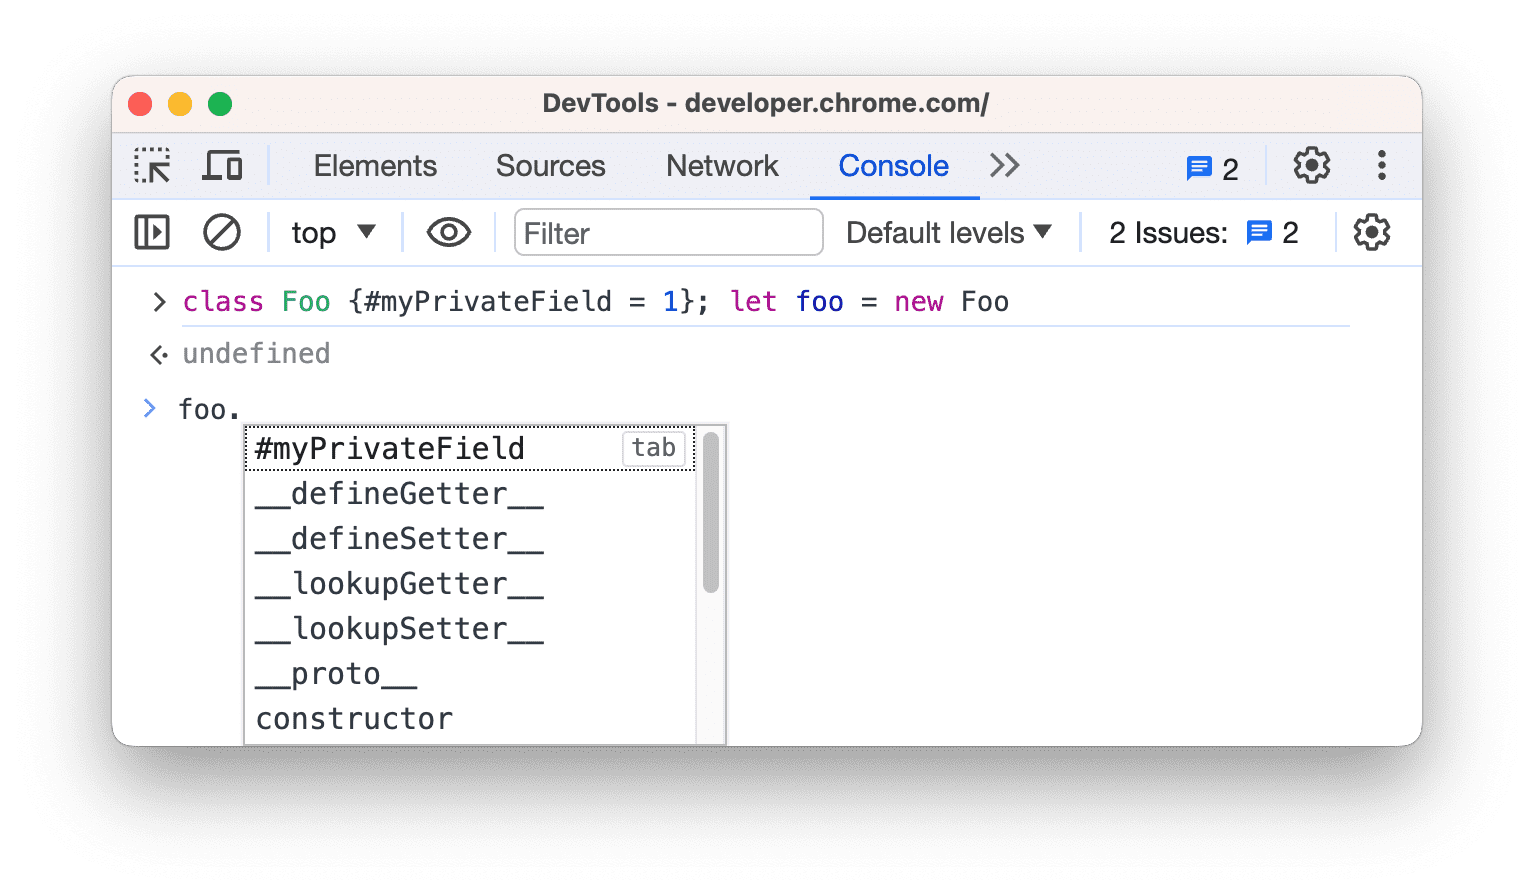
The Console designates private properties of class instances with a # prefix.
The Console can also autocomplete private properties even when you evaluate them ouside the class scope.
Inspect internal JavaScript properties
Borrowing the ECMAScript notation, the Console encloses some properties internal to JavaScript in double square brackets. You can't interact with such properties in your code. However, it might be useful to inspect them.
You might see the following internal properties on different objects:
- Any object has a
[[Prototype]].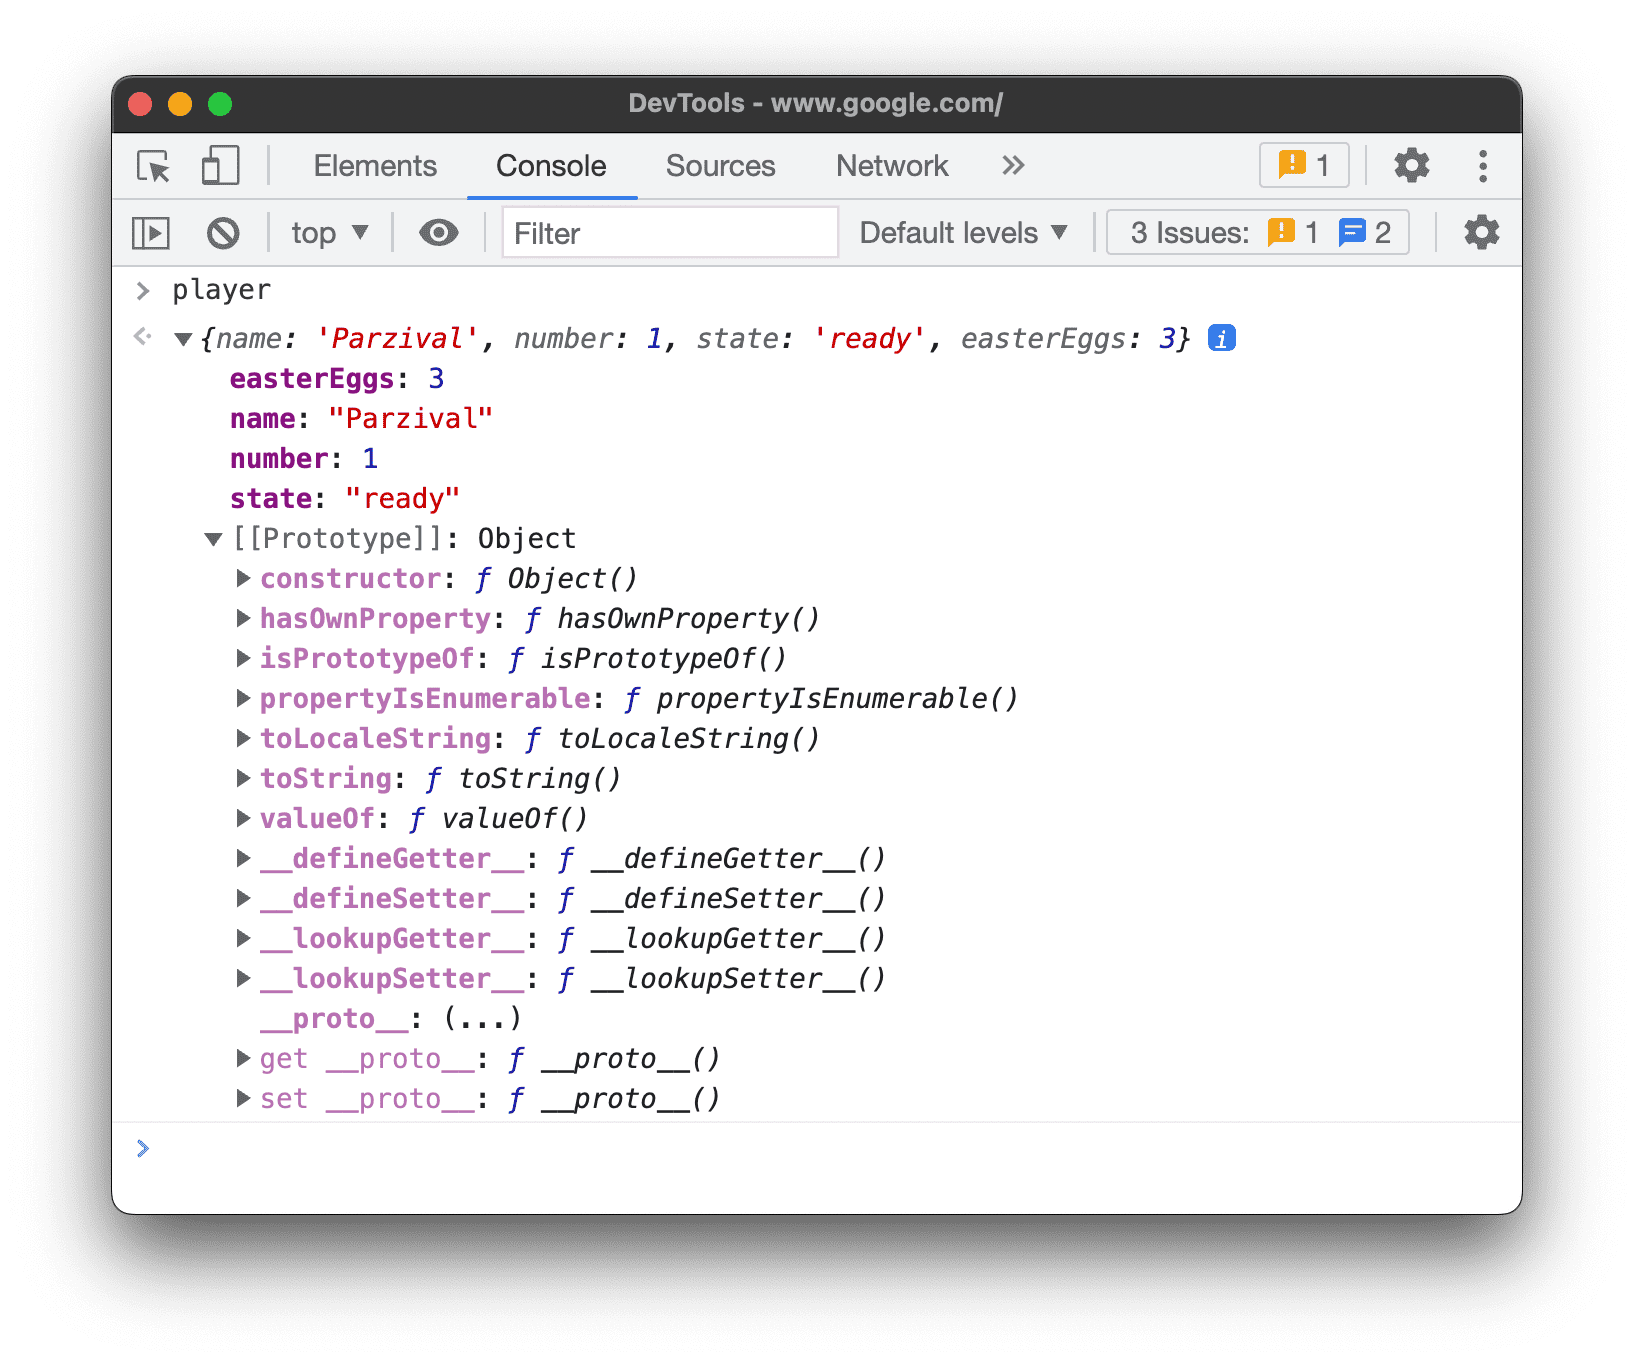
- Primitive wrappers have a
[[PrimitiveValue]]property.
ArrayBufferobjects have the following properties:- In addition to
ArrayBuffer-specific properties,WebAssembly.Memoryobjects have a[[WebAssemblyMemory]]property.
- Keyed collections (maps and sets) have an
[[Entries]]property that contains their keyed entries.
Promiseobjects have the following properties:[[PromiseState]]: pending, fulfilled, or rejected[[PromiseResult]]:undefinedif pending,<value>if fulfilled,<reason>if rejected
Proxyobjects have the following properties:[[Handler]]object,[[Target]]object, and[[isRevoked]](switched off or not).

Inspect functions
In JavaScript, functions are also objects with properties. However, if you type a function name into the Console, DevTools calls it instead of displaying its properties.
To view function properties internal to JavaScript, use the console.dir() command.

Functions have the following properties:
[[FunctionLocation]]. A link to the line with the function definition in a source file.[[Scopes]]. Lists values and expressions the function has access to. To inspect function scopes during debugging, see View and edit local, closure, and global properties.- Bound functions have the following properties:
[[TargetFunction]]. The target ofbind().[[BoundThis]]. The value ofthis.[[BoundArgs]]. An array of function arguments.
- Generator functions are marked with a
[[IsGenerator]]: trueproperty.
- Generators return iterator objects and they have following properties:
[[GeneratorLocation]]. A link to a line with the generator definition in a source file.[[GeneratorState]]:suspended,closed, orrunning.[[GeneratorFunction]]. The generator that returned the object.[[GeneratorReceiver]]. An object that receives the value.
Clear the Console
You can use any of the following workflows to clear the Console:
- Click Clear Console
 .
. - Right-click a message and then select Clear Console.
- Type
clear()in the Console and then press Enter. - Call
console.clear()from your webpage's JavaScript. - Press Control+L while the Console is in focus.