

Use the CSS Overview panel to better understand your page's CSS and identify potential improvements.
Overview
The CSS overview panel creates a report of your website's CSS statistics. This report collects data on all CSS occurrences and even unused declarations. The CSS overview panel helps you investigate occurrences further with page highlighting or by linking directly to the affected code in the Elements panel.
See how to Run and re-run a CSS Overview report and Understand the CSS Overview report.
Open the CSS Overview panel
- Open any web page, such as this page.
- Open DevTools.
Select
 Customize and control DevTools > More tools > CSS Overview.
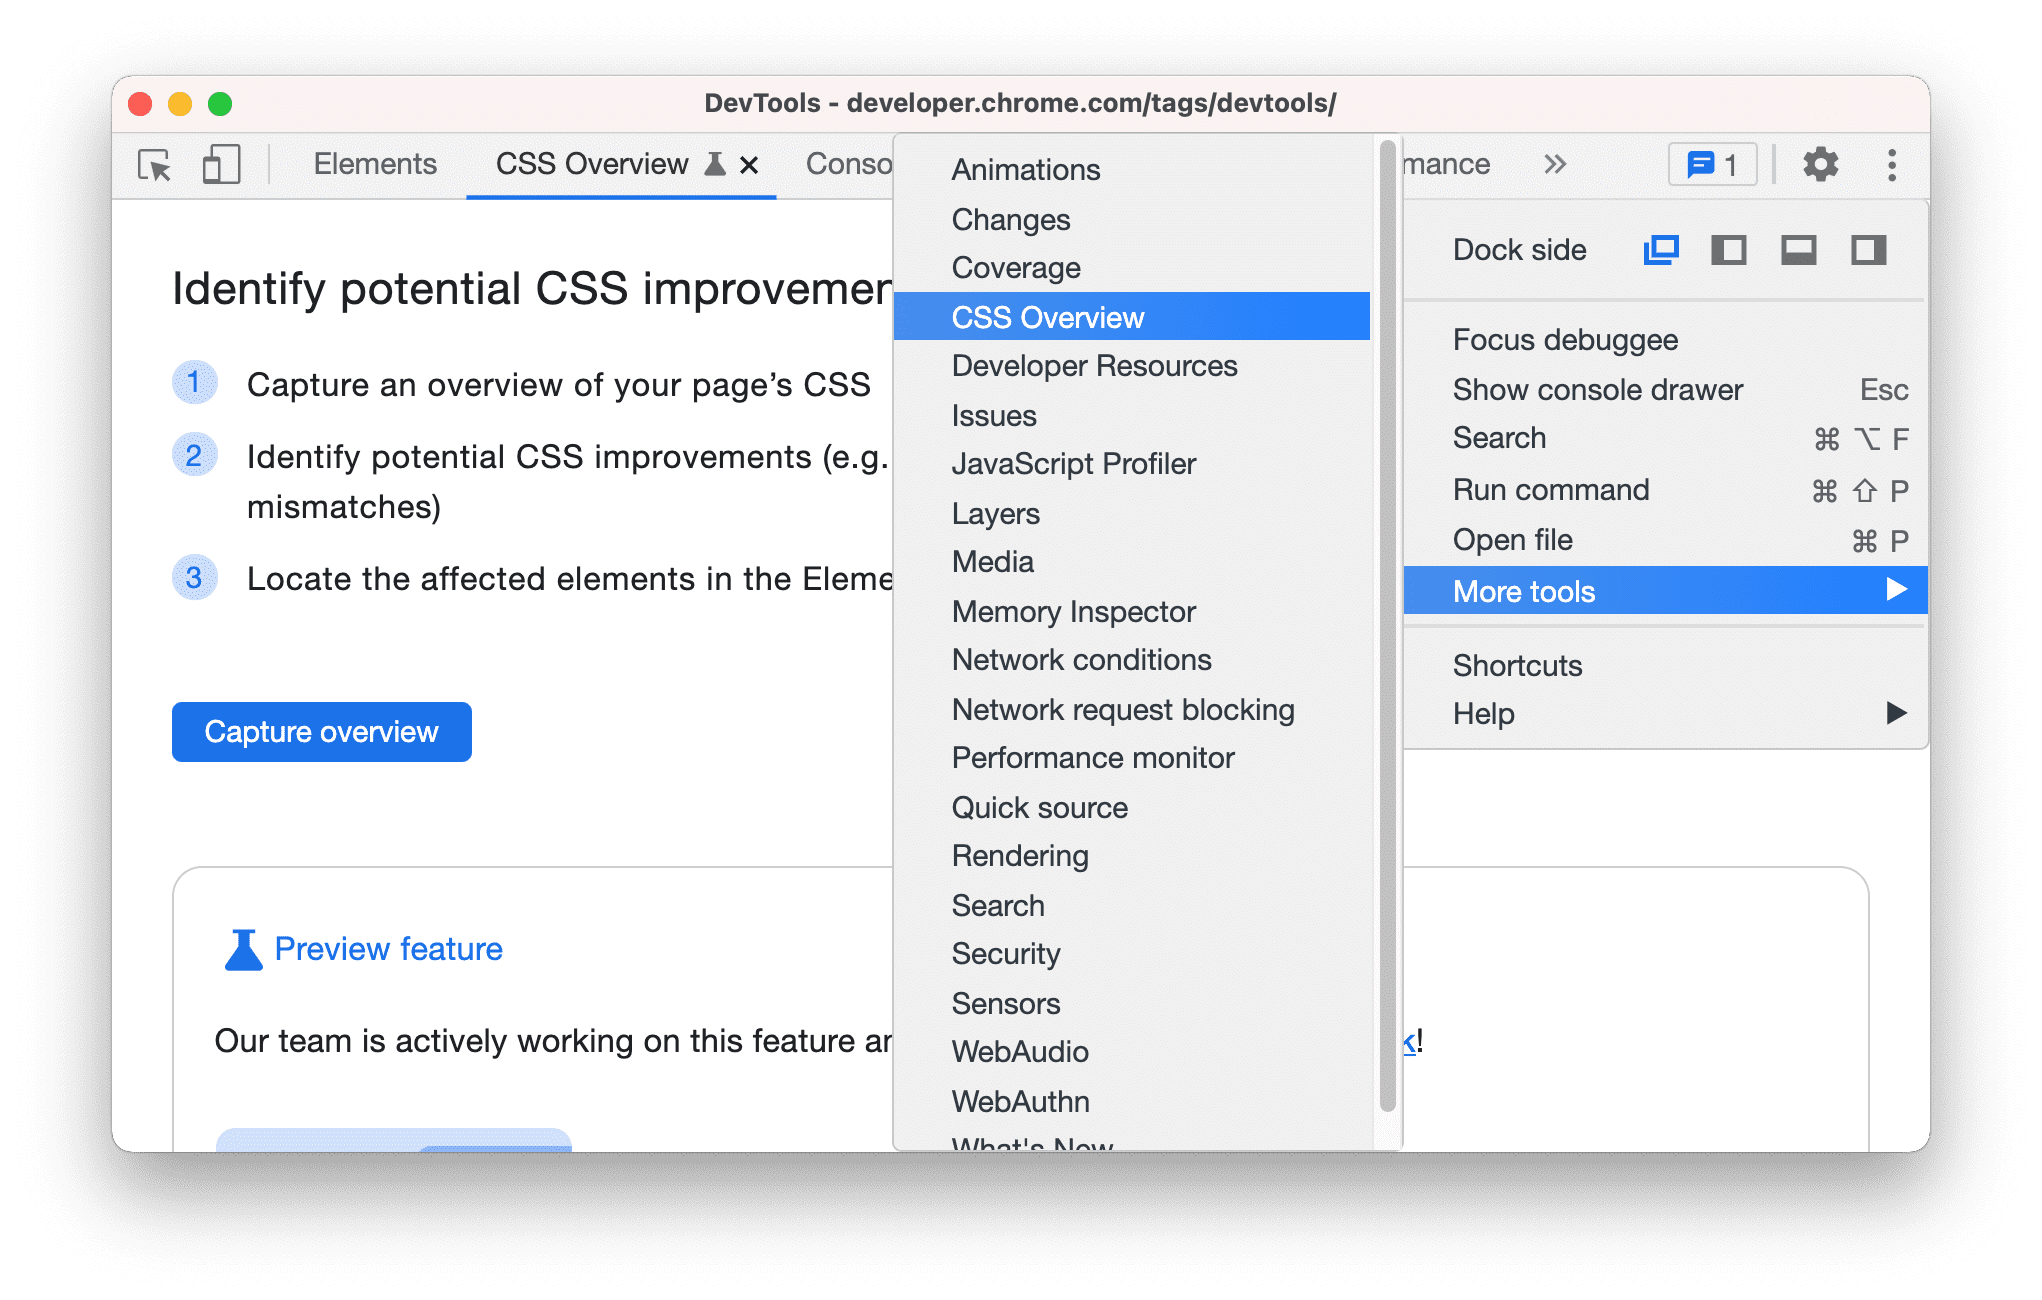
Alternatively, use the Command Menu to open the CSS Overview panel.

Run and re-run a CSS Overview report
Click the Capture overview button to generate a CSS Overview report of your page.

To re-run a CSS Overview, click the
 Clear overview icon and repeat the first step.
Understand the CSS Overview report
The report consists of five sections:
- Overview summary. A high level summary of your page's CSS.

Colors. All the colors on your page. The colors are grouped by types, such as background colors, text colors, etc. This sections also shows you texts that have low contrast issues.

Each color is clickable. For example, suppose the
#DADCE0border color doesn't match the color scheme of your site. To get a list of elements that use this color, click the color.
To highlight the element on the page, hover over the element in the list.

To open the element in the Elements panel, click the element in the list.
Font info. All the fonts on your page and their occurrences, grouped by different font size, font weight, and line height. Similar to the Colors section, to view the list of affected elements, click their occurrences.

Unused declarations. All the styles that have no effect, grouped by reason.

For example, the two declarations above are unused because the content determines the height and width of an inline element. To view the corresponding elements, click the occurrences.
Media queries. All the media queries defined on your page, sorted by number of occurrences in descending order. To view the list of affected elements, click their occurrences.
