


This tutorial teaches you the basic workflow for debugging any JavaScript issue in DevTools. Read on, or watch the video version of this tutorial.
Reproduce the bug
Finding a series of actions that consistently reproduces a bug is always the first step to debugging.
- Open this demo in a new tab.
- Enter
5in the Number 1 box. - Enter
1in the Number 2 box. - Click Add Number 1 and Number 2. The label below the button says
5 + 1 = 51. The result should be6. This is the bug you're going to fix.

In this example, the result of 5 + 1 is 51. It should be 6.
Get familiar with the Sources panel UI
DevTools provides a lot of different tools for different tasks, such as changing CSS, profiling page load performance, and monitoring network requests. The Sources panel is where you debug JavaScript.
Open DevTools and navigate to the Sources panel.

The Sources panel has three sections:

- The Page tab with the file tree. Every file that the page requests is listed here.
- The Code Editor section. After selecting a file in the Page tab, the contents of that file are displayed here.
The Debugger section. Various tools for inspecting the page's JavaScript.
If your DevTools window is wide, by default, the Debugger is to the right of the Code Editor. In this case, the Scope and Watch tabs join Breakpoints, Call stack, and others as collapsible sections.

Pause the code with a breakpoint
A common method for debugging a problem like this is to insert a lot of console.log() statements
into the code, in order to inspect values as the script executes. For example:
function updateLabel() {
  var addend1 = getNumber1();
  console.log('addend1:', addend1);
  var addend2 = getNumber2();
  console.log('addend2:', addend2);
  var sum = addend1 + addend2;
  console.log('sum:', sum);
  label.textContent = addend1 + ' + ' + addend2 + ' = ' + sum;
}
The console.log() method may get the job done, but breakpoints can get it done faster. A
breakpoint lets you pause your code in the middle of its execution, and examine all values at that
moment in time. Breakpoints have a few advantages over the console.log() method:
- With
console.log(), you need to manually open the source code, find the relevant code, insert theconsole.log()statements, and then reload the page in order to see the messages in the Console. With breakpoints, you can pause on the relevant code without even knowing how the code is structured. - In your
console.log()statements you need to explicitly specify each value that you want to inspect. With breakpoints, DevTools shows you the values of all variables at that moment in time. Sometimes there are variables affecting your code that you're not even aware of.
In short, breakpoints can help you find and fix bugs faster than the console.log() method.
If you take a step back and think about how the app works, you can make an educated guess that the
incorrect sum (5 + 1 = 51) gets computed in the click event listener that's associated to the
Add Number 1 and Number 2 button. Therefore, you probably want to pause the code around the time
that the click listener executes. Event Listener Breakpoints let you do exactly that:
- In the Debugger section, click Event Listener Breakpoints to expand the section. DevTools reveals a list of expandable event categories, such as Animation and Clipboard.
- Next to the Mouse event category, click Expand. DevTools reveals a list of mouse events, such as click and mousedown. Each event has a checkbox next to it.
Check the click checkbox. DevTools is now set up to automatically pause when any
clickevent listener executes.
Back on the demo, click Add Number 1 and Number 2 again. DevTools pauses the demo and highlights a line of code in the Sources panel. DevTools should be paused on this line of code:
function onClick() {If you're paused on a different line of code, press Resume Script Execution until you're paused on the correct line.
Event Listener Breakpoints are just one of many types of breakpoints available in DevTools. It's worth exploring all the different types, because each type ultimately helps you debug different scenarios as quickly as possible. See Pause Your Code With Breakpoints to learn when and how to use each type.
Step through the code
One common cause of bugs is when a script executes in the wrong order. Stepping through your code lets you walk through your code's execution, one line at a time, and figure out exactly where it's executing in a different order than you expected. Try it now:
On the Sources panel of DevTools, click Step into next function call to step through the execution of the
onClick()function, one line at a time. DevTools highlights the following line of code:if (inputsAreEmpty()) {Click Step over next function call.
DevTools executes
inputsAreEmpty()without stepping into it. Notice how DevTools skips a few lines of code. This is becauseinputsAreEmpty()evaluated to false, so theifstatement's block of code didn't execute.
That's the basic idea of stepping through code. If you look at the code in get-started.js, you can
see that the bug is probably somewhere in the updateLabel() function. Rather than stepping through
every line of code, you can use another type of breakpoint to pause the code closer to the probable
location of the bug.
Set a line-of-code breakpoint
Line-of-code breakpoints are the most common type of breakpoint. When you've got a specific line of code that you want to pause on, use a line-of-code breakpoint:
Look at the last line of code in
updateLabel():label.textContent = addend1 + ' + ' + addend2 + ' = ' + sum;To the left of the code you can see the line number of this particular line of code, which is 32. Click 32. DevTools puts a blue icon on top of 32. This means that there is a line-of-code breakpoint on this line. DevTools now always pauses before this line of code is executed.
Click Resume script execution. The script continues executing until it reaches line 32. On lines 29, 30, and 31, DevTools shows the values of
addend1,addend2, andsuminline next to their declarations.

In this example, DevTools pauses on the line-of-code breakpoint on line 32.
Check variable values
The values of addend1, addend2, and sum look suspicious. They're wrapped in quotes, which
means that they're strings. This is a good hypothesis for the explaining the cause of the bug. Now
it's time to gather more information. DevTools provides a lot of tools for examining variable
values.
Method 1: Inspect the Scope
When you're paused on a line of code, the Scope tab shows you what local and global variables are defined at this point in execution, along with the value of each variable. It also shows closure variables, when applicable. When you're not paused on a line of code, the Scope tab is empty.
Double-click a variable value to edit it.

Method 2: Watch expressions
The Watch tab lets you monitor the values of variables over time. Watch isn't just limited to variables. You can store any valid JavaScript expression in the Watch tab.
Try it now:
- Click the Watch tab.
- Click Add watch expression.
- Type
typeof sum. - Press Enter. DevTools shows
typeof sum: "string". The value to the right of the colon is the result of your expression.
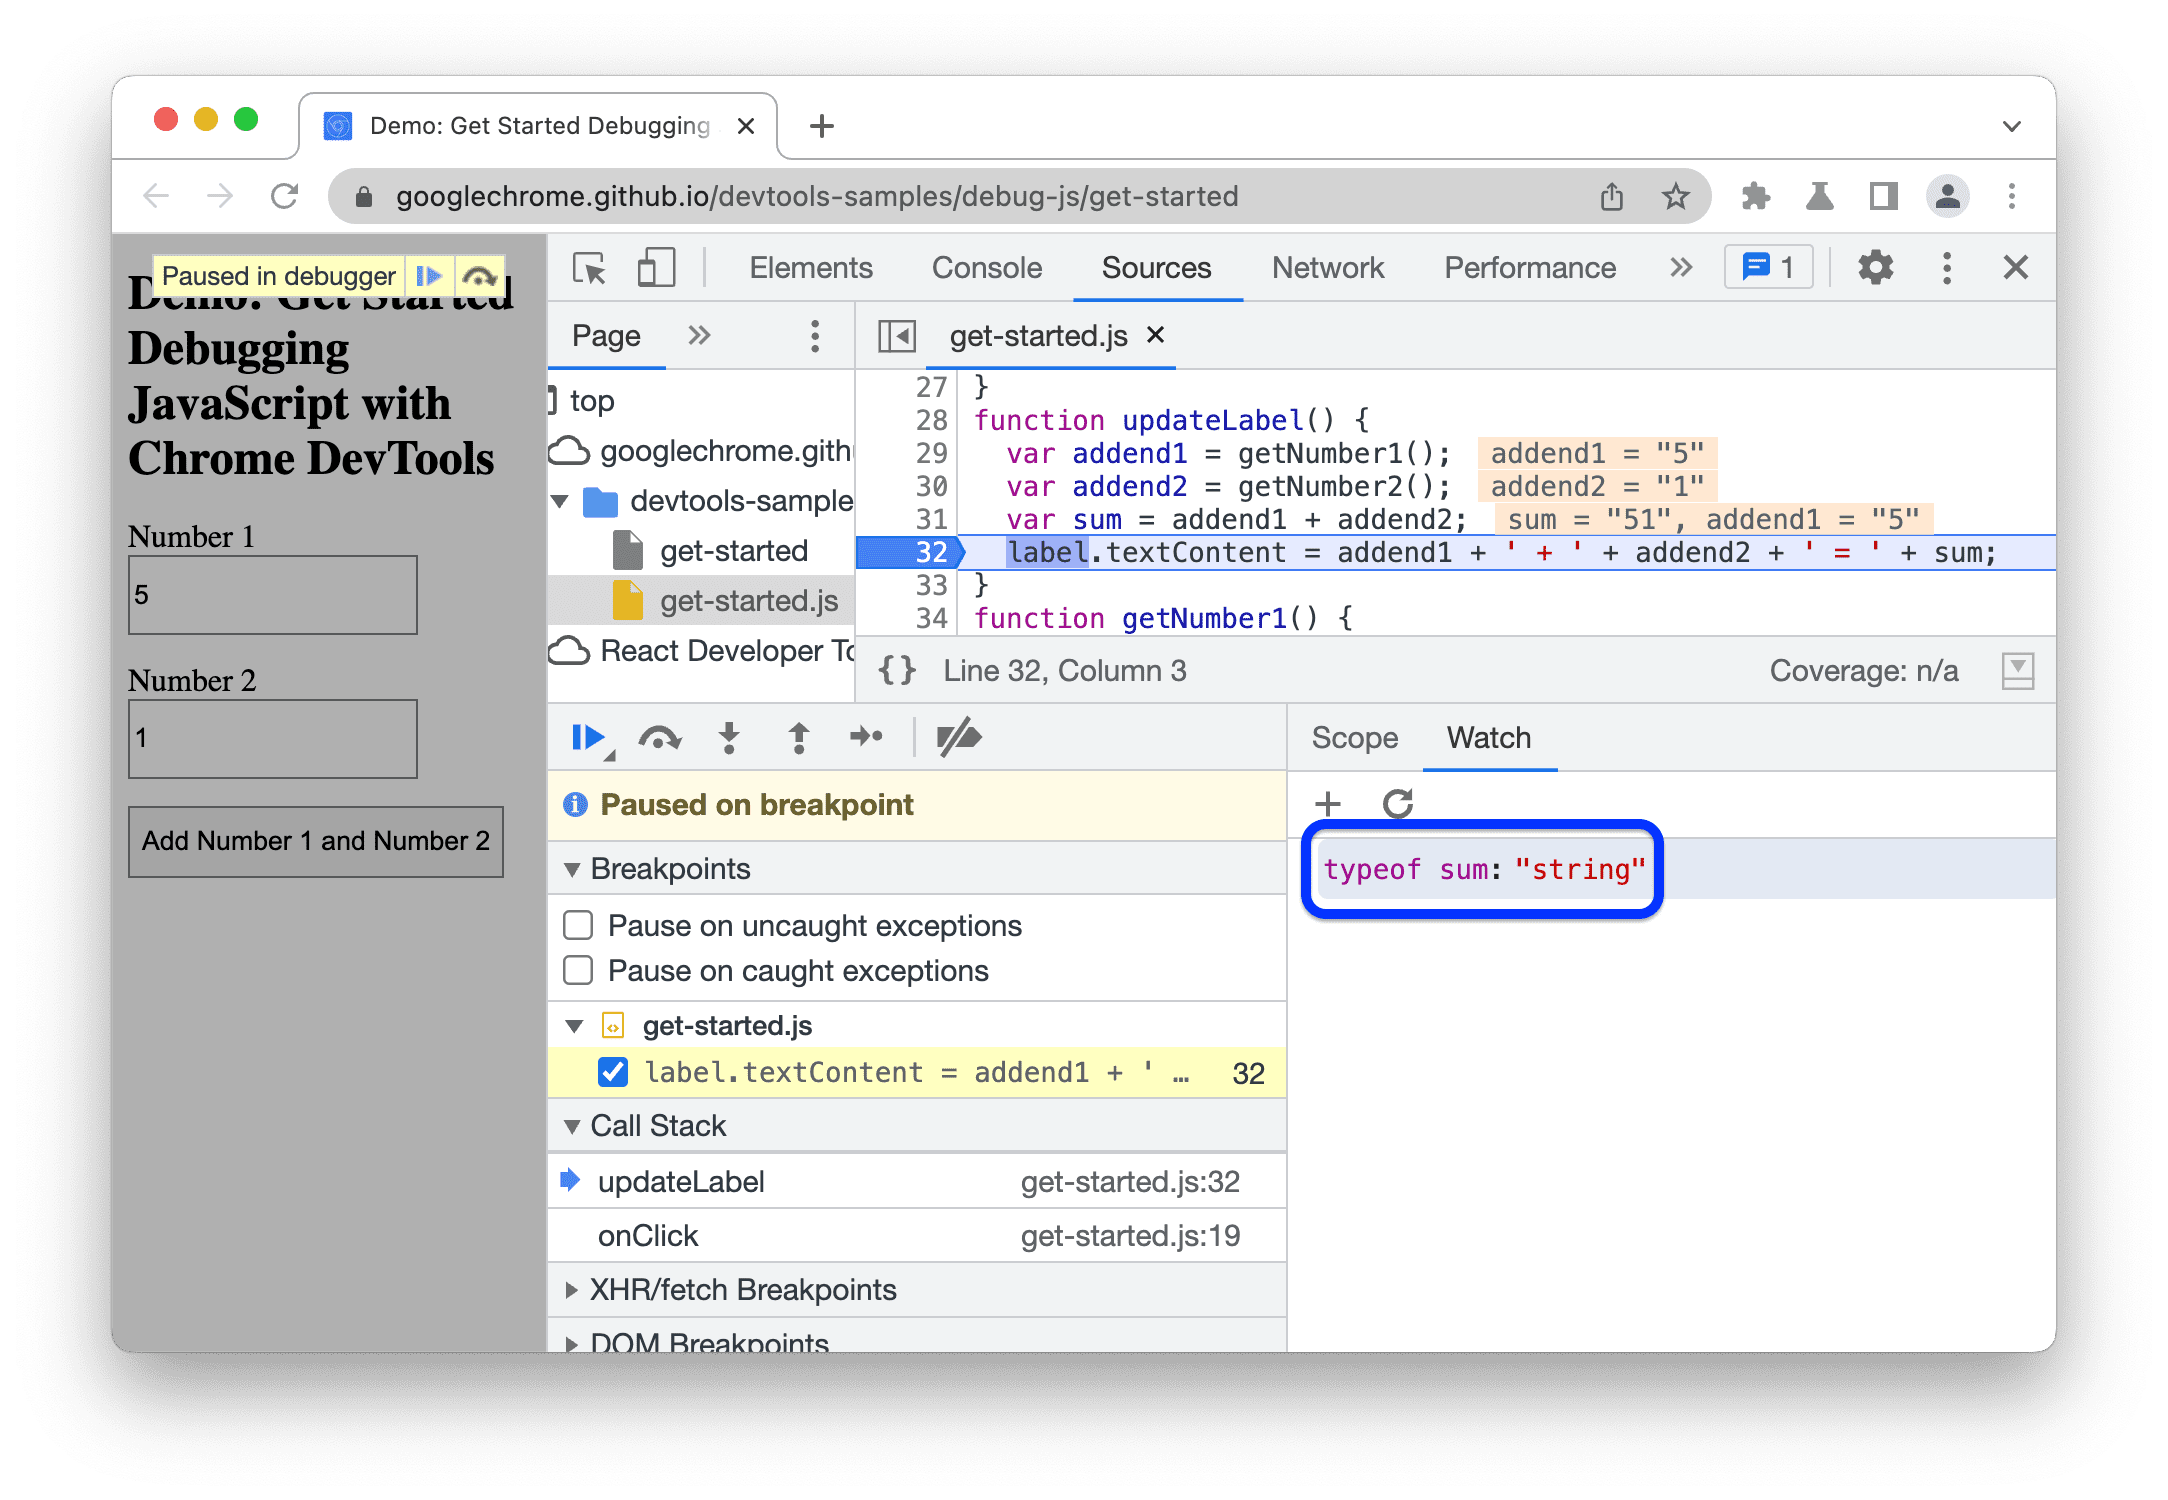
This screenshot shows the Watch tab (bottom-right) after creating the typeof sum watch
expression.
As suspected, sum is being evaluated as a string, when it should be a number. You've now confirmed
that this is the cause of the bug.
Method 3: The Console
In addition to viewing console.log() messages, you can also use the Console to evaluate arbitrary
JavaScript statements. In terms of debugging, you can use the Console to test out potential fixes
for bugs. Try it now:
- If you don't have the Console drawer open, press Escape to open it. It opens at the bottom of your DevTools window.
- In the Console, type
parseInt(addend1) + parseInt(addend2). This statement works because you are paused on a line of code whereaddend1andaddend2are in scope. - Press Enter. DevTools evaluates the statement and prints out
6, which is the result you expect the demo to produce.

This screenshot shows the Console drawer after evaluating parseInt(addend1) + parseInt(addend2).
Apply a fix
You've found a fix for the bug. All that's left is to try out your fix by editing the code and re-running the demo. You don't need to leave DevTools to apply the fix. You can edit JavaScript code directly within the DevTools UI. Try it now:
- Click Resume script execution.
- In the Code Editor, replace line 31,
var sum = addend1 + addend2, withvar sum = parseInt(addend1) + parseInt(addend2). - Press Command + S (Mac) or Control + S (Windows, Linux) to save your change.
- Click Deactivate breakpoints. Its color changes to blue to indicate that it's active. While this is set, DevTools ignores any breakpoints you've set.
- Try out the demo with different values. The demo now calculates correctly.
Next steps
This tutorial only showed you two ways to set breakpoints. DevTools offers many other ways, including:
- Conditional breakpoints that are only triggered when the condition that you provide is true.
- Breakpoints on caught or uncaught exceptions.
- XHR breakpoints that are triggered when the requested URL matches a substring that you provide.
See Pause Your Code With Breakpoints to learn when and how to use each type.
There's a couple of code stepping controls that weren't explained in this tutorial. See Step over line of code to learn more.