


There are many ways to open Chrome DevTools. Choose your favorite way from this comprehensive reference.
You can access DevTools using Chrome UI or keyboard:
- From drop-down menus in Chrome.
- With dedicated shortcuts that open Elements, Console, or the last panel you used.
Additionally, learn how to auto-open DevTools for every new tab.
Open DevTools from Chrome menus
If you prefer UI, you can access DevTools from drop-down menus in Chrome.
Open the Elements panel to inspect the DOM or CSS
To inspect, right-click an element on a page and select Inspect.
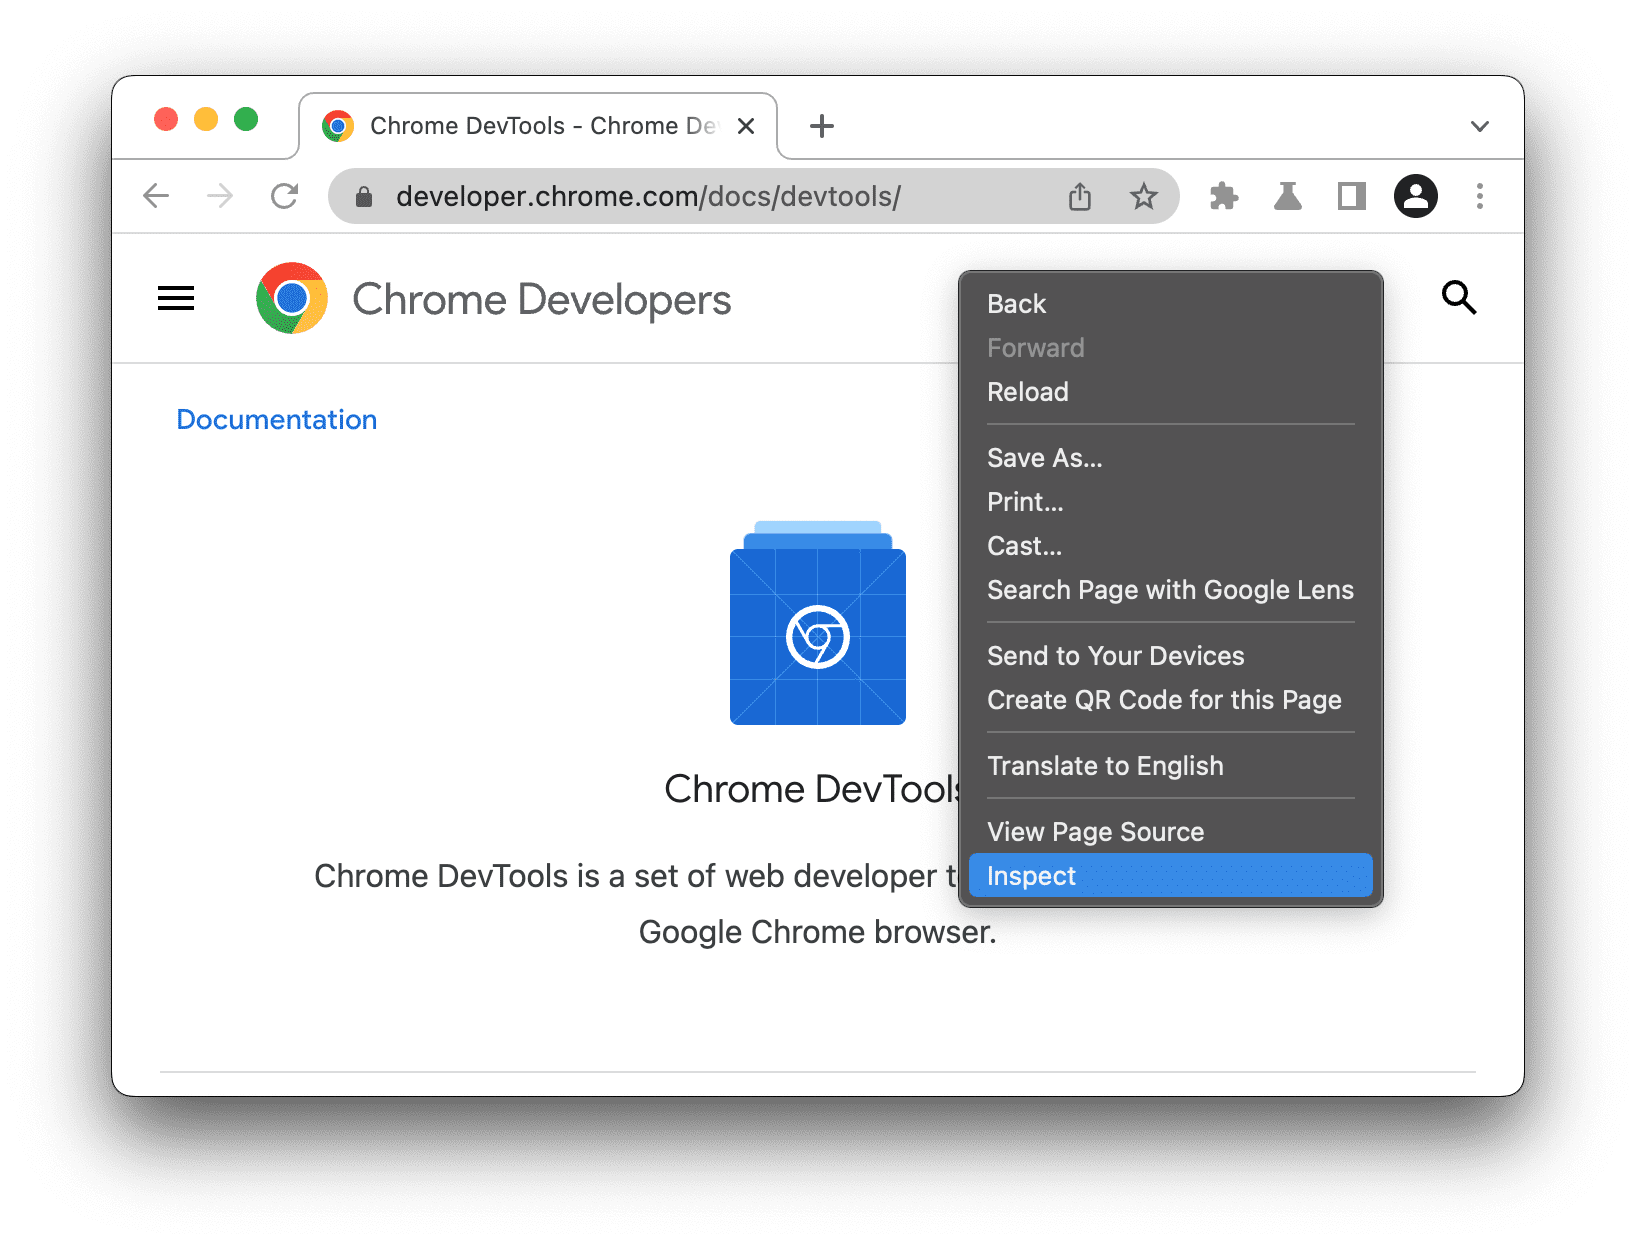
DevTools opens the Elements panel and selects the element in the DOM tree. In the Styles tab, you can see CSS rules applied to the selected element.

Open the last panel you used from Chrome's main menu
To open the last DevTools panel, click the button to the right of the address bar and select More Tools > Developer Tools.
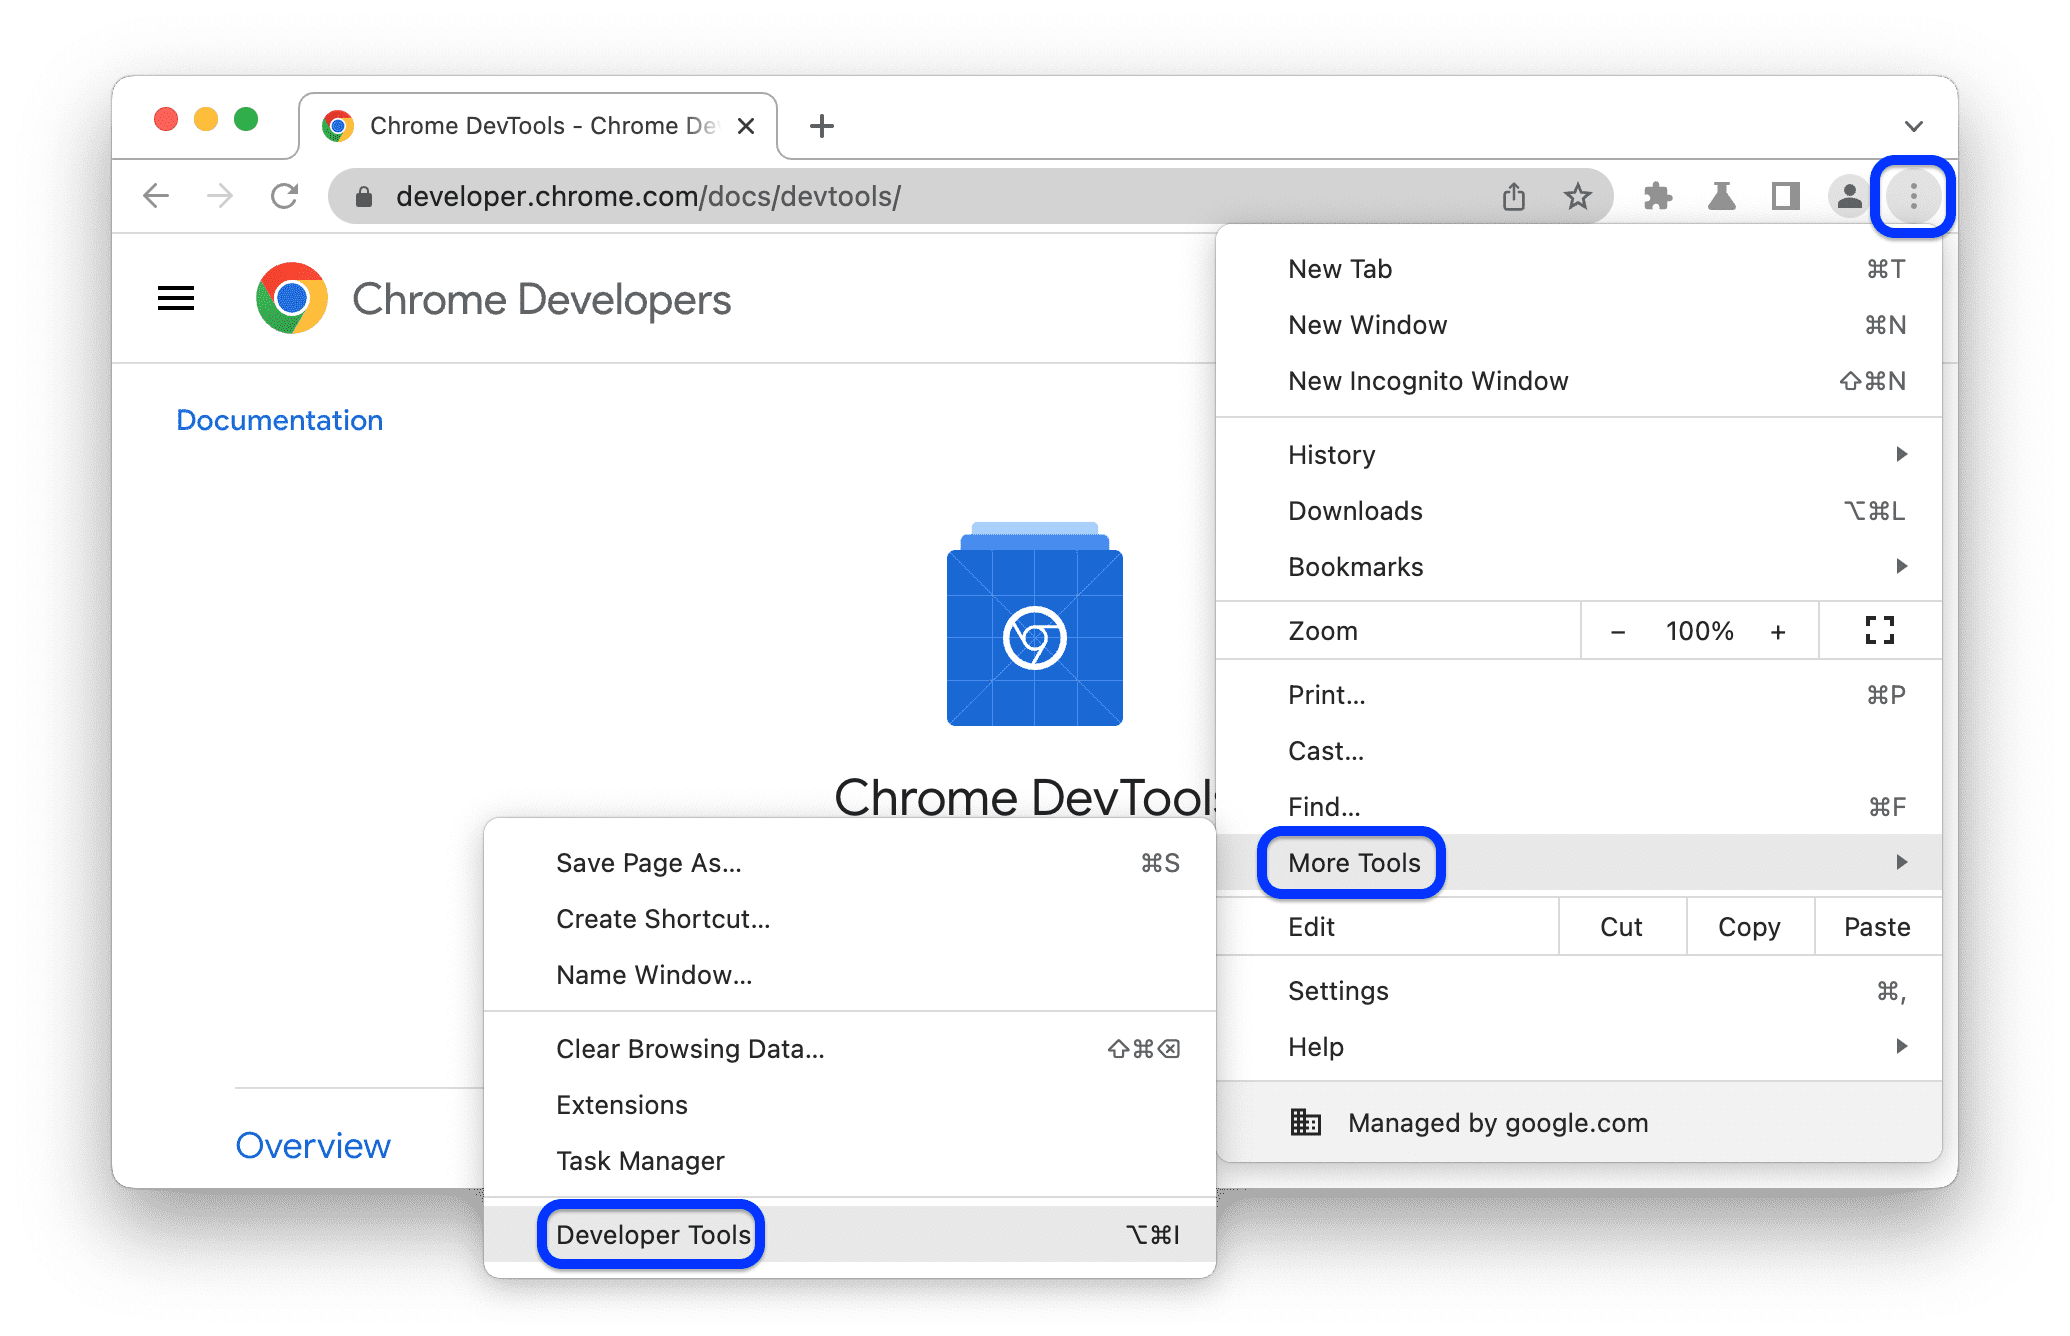
Alternatively, you can open the last panel with a shortcut. See the next section to learn more.
Open panels with shortcuts: Elements, Console, or your last panel
If you prefer keyboard, press a shortcut in Chrome depending on your operating system:
| OS | Elements | Console | Your last panel |
|---|---|---|---|
| Windows or Linux | Ctrl + Shift + C | Ctrl + Shift + J | F12Ctrl + Shift + I |
| Mac | Cmd + Option + C | Cmd + Option + J | Fn + F12Cmd + Option + I |
Here's an easy way to memorize the shortcuts:
- C stands for CSS.
- J for JavaScript.
- I designates your choice.
The C shortcut opens the Elements panel in inspector mode. This mode shows you helpful tooltips when you hover over elements on a page. You can also click any element to view its CSS in the Elements > Styles tab.

For the full list of DevTools shortcuts, see Keyboard shortcuts.
With DevTools open, reload the page with or without cache
With DevTools open, you can reload your page in three ways. In the main action bar of the Chrome window, long-press the Reload button and choose one of the options:
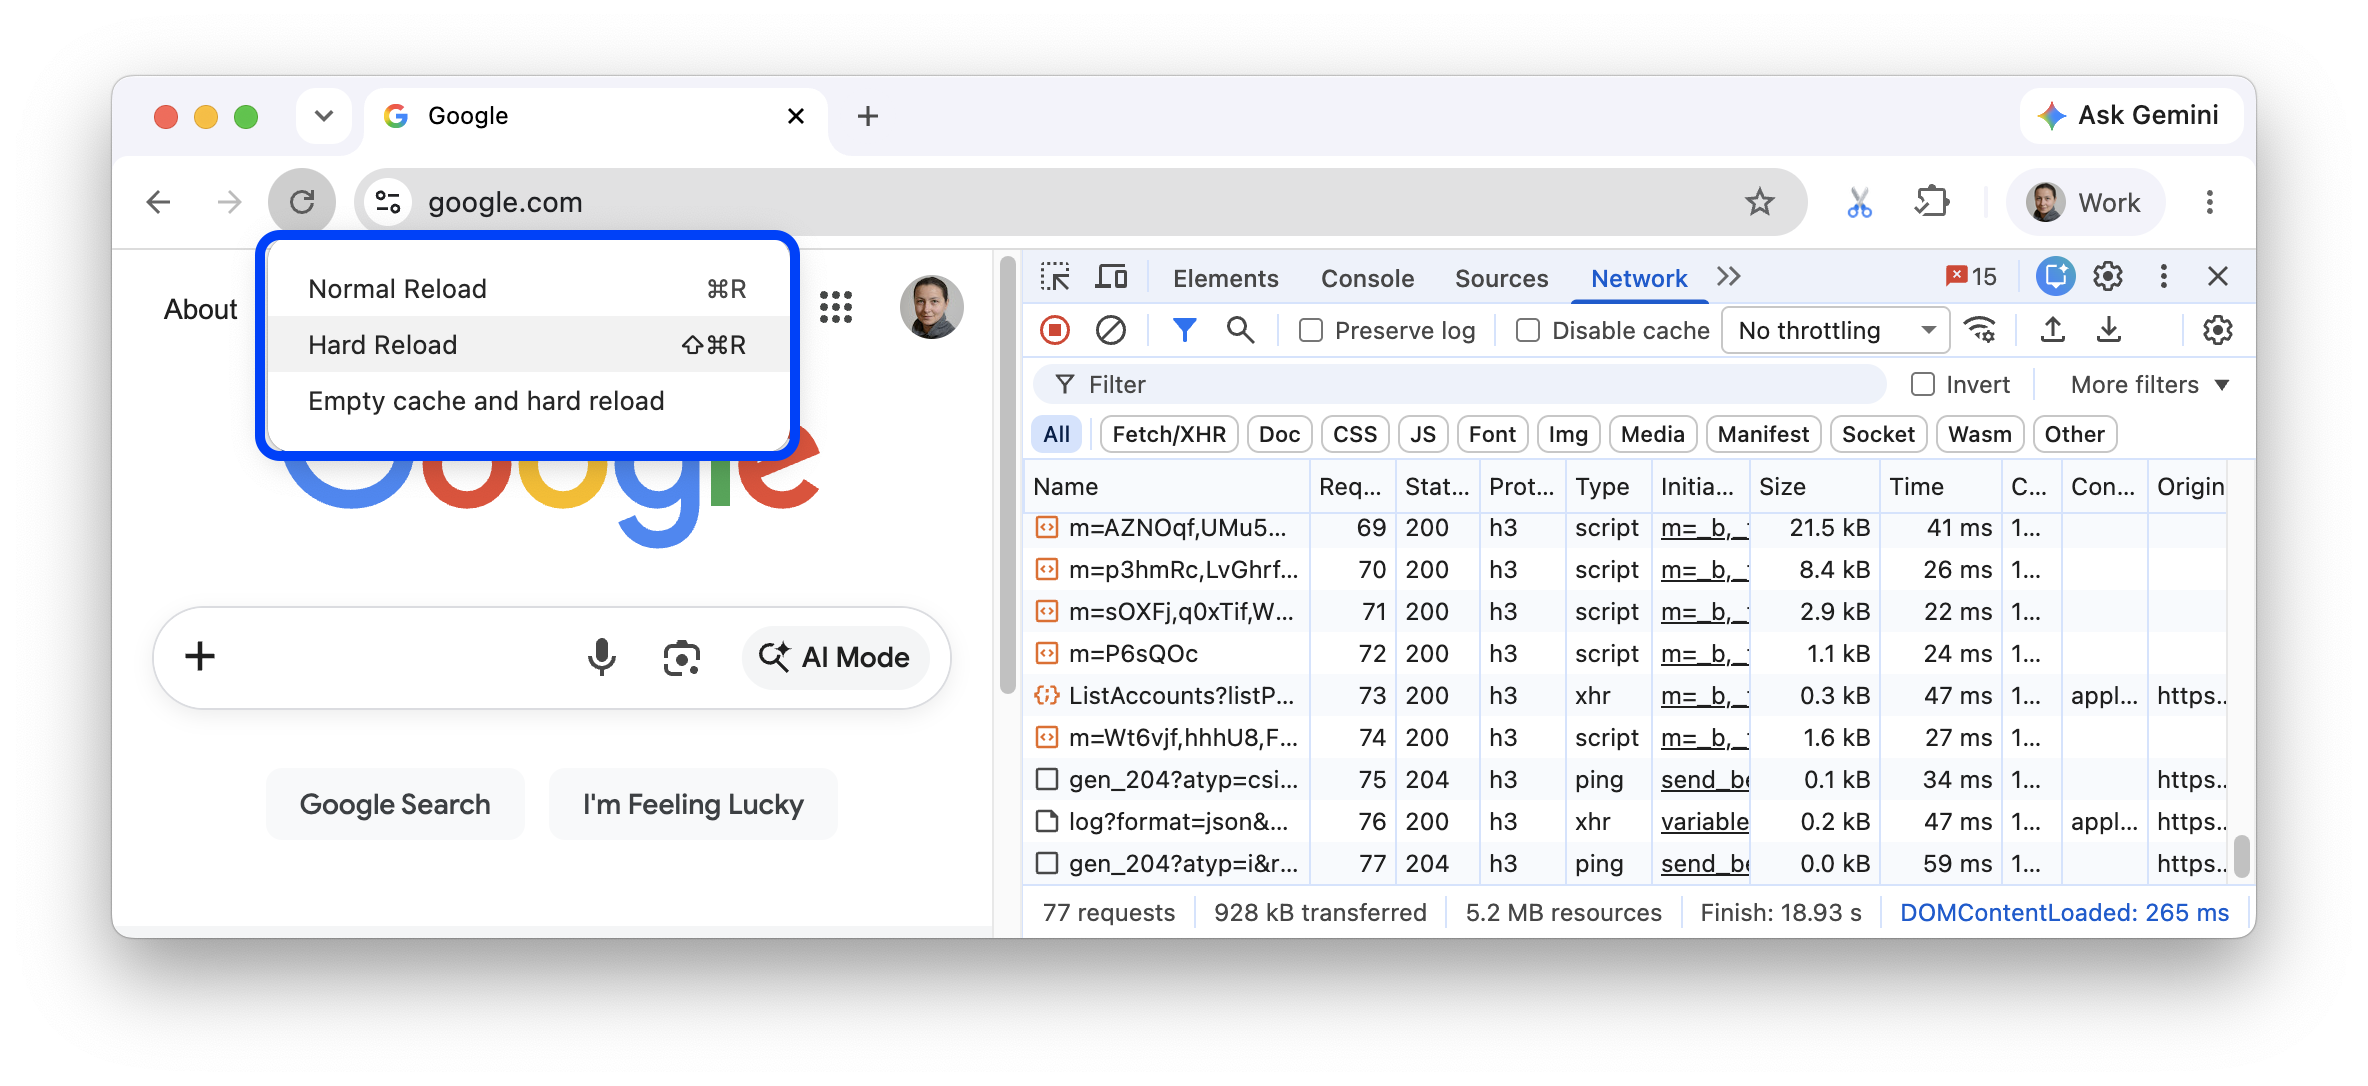
Normal Reload. Uses cache to speed up reload time.
Shortcut: Cmd+R (macOS) or Ctrl+R (Windows/Linux).
Hard Reload. Bypasses cache but doesn't empty it.
Shortcut: Cmd+Shift+R (macOS) or Ctrl+Shift+R (Windows/Linux).
Empty cache and hard reload. Empties cache for all sites before reloading.
Auto-open DevTools on every new tab
Run Chrome from the command line and pass the --auto-open-devtools-for-tabs flag:
Quit any running Chrome instance.
Run your favorite terminal or command line application.
Depending on your operating system, run the following command:
macOS:
open -a "Google Chrome" --args --auto-open-devtools-for-tabsWindows:
start chrome --auto-open-devtools-for-tabsLinux:
google-chrome --auto-open-devtools-for-tabs
DevTools will automatically open for every new tab until you close Chrome.
What's next?
Next, watch the following video to learn some useful shortcuts and settings for quicker DevTools navigation.
For a more hands-on learning experience, see how to customize DevTools.