
Chrome DevTools is a set of web developer tools built directly into the Google Chrome browser. DevTools can help you edit pages on-the-fly and diagnose problems quickly, which ultimately helps you build better websites, faster.
Check out the video for live demonstrations of core DevTools workflows, including debugging CSS, prototyping CSS, debugging JavaScript, and analyzing load performance.
Open DevTools
There are many ways to open DevTools, because different users want quick access to different parts of the DevTools UI.
- To work with the DOM or CSS, right-click an element on the page and select Inspect to jump into the Elements panel. Or press Command+Option+C (Mac) or Control+Shift+C (Windows, Linux, ChromeOS).
- To see logged messages or run JavaScript, press Command+Option+J (Mac) or Control+Shift+J (Windows, Linux, ChromeOS) to jump straight into the Console panel.
See Open Chrome DevTools for more details and workflows.
Get started
If you're a more experienced web developer, here are the recommended starting points for learning how DevTools can improve your productivity:
- View and change the DOM
- View and change CSS
- Debug JavaScript
- View messages and run JavaScript in the Console
- Optimize website speed
- Inspect network activity
Discover DevTools
The DevTools UI can be a little overwhelming... there are so many tabs! But, if you take some time to get familiar with each tab to understand what's possible, you may discover that DevTools can seriously boost your productivity.
Device Mode

Simulate mobile devices.
Elements panel

View and change the DOM and CSS.
- Get started with viewing and changing the DOM
- Get started with viewing and changing CSS
- Edit CSS
- Edit the DOM
- Find invalid, overridden, inactive, and other CSS
- Identify potential CSS improvements
- Emulate light/dark themes, contrast, and other CSS media features
- Find unused CSS
- Inspect animations
Console panel

View messages and run JavaScript from the Console.
Sources panel

Debug JavaScript, persist changes made in DevTools across page reloads, save and run snippets of JavaScript, and save changes that you make in DevTools to local sources.
- Get started with debugging JavaScript
- Pause your code with breakpoints
- Edit and save files in a workspace
- Run snippets of JavaScript
- JavaScript debugging reference
- Override web content and HTTP response headers locally
Network panel

View and debug network activity.
Recorder panel

Record, replay, and measure user flows.
- Record, replay, and measure user flows
- Customize the Recorder with extensions
- Recorder features reference
Performance panel

Find ways to improve load and runtime performance.
Memory panel

Find and fix memory issues that affect page performance, for example, memory leaks.
Application panel
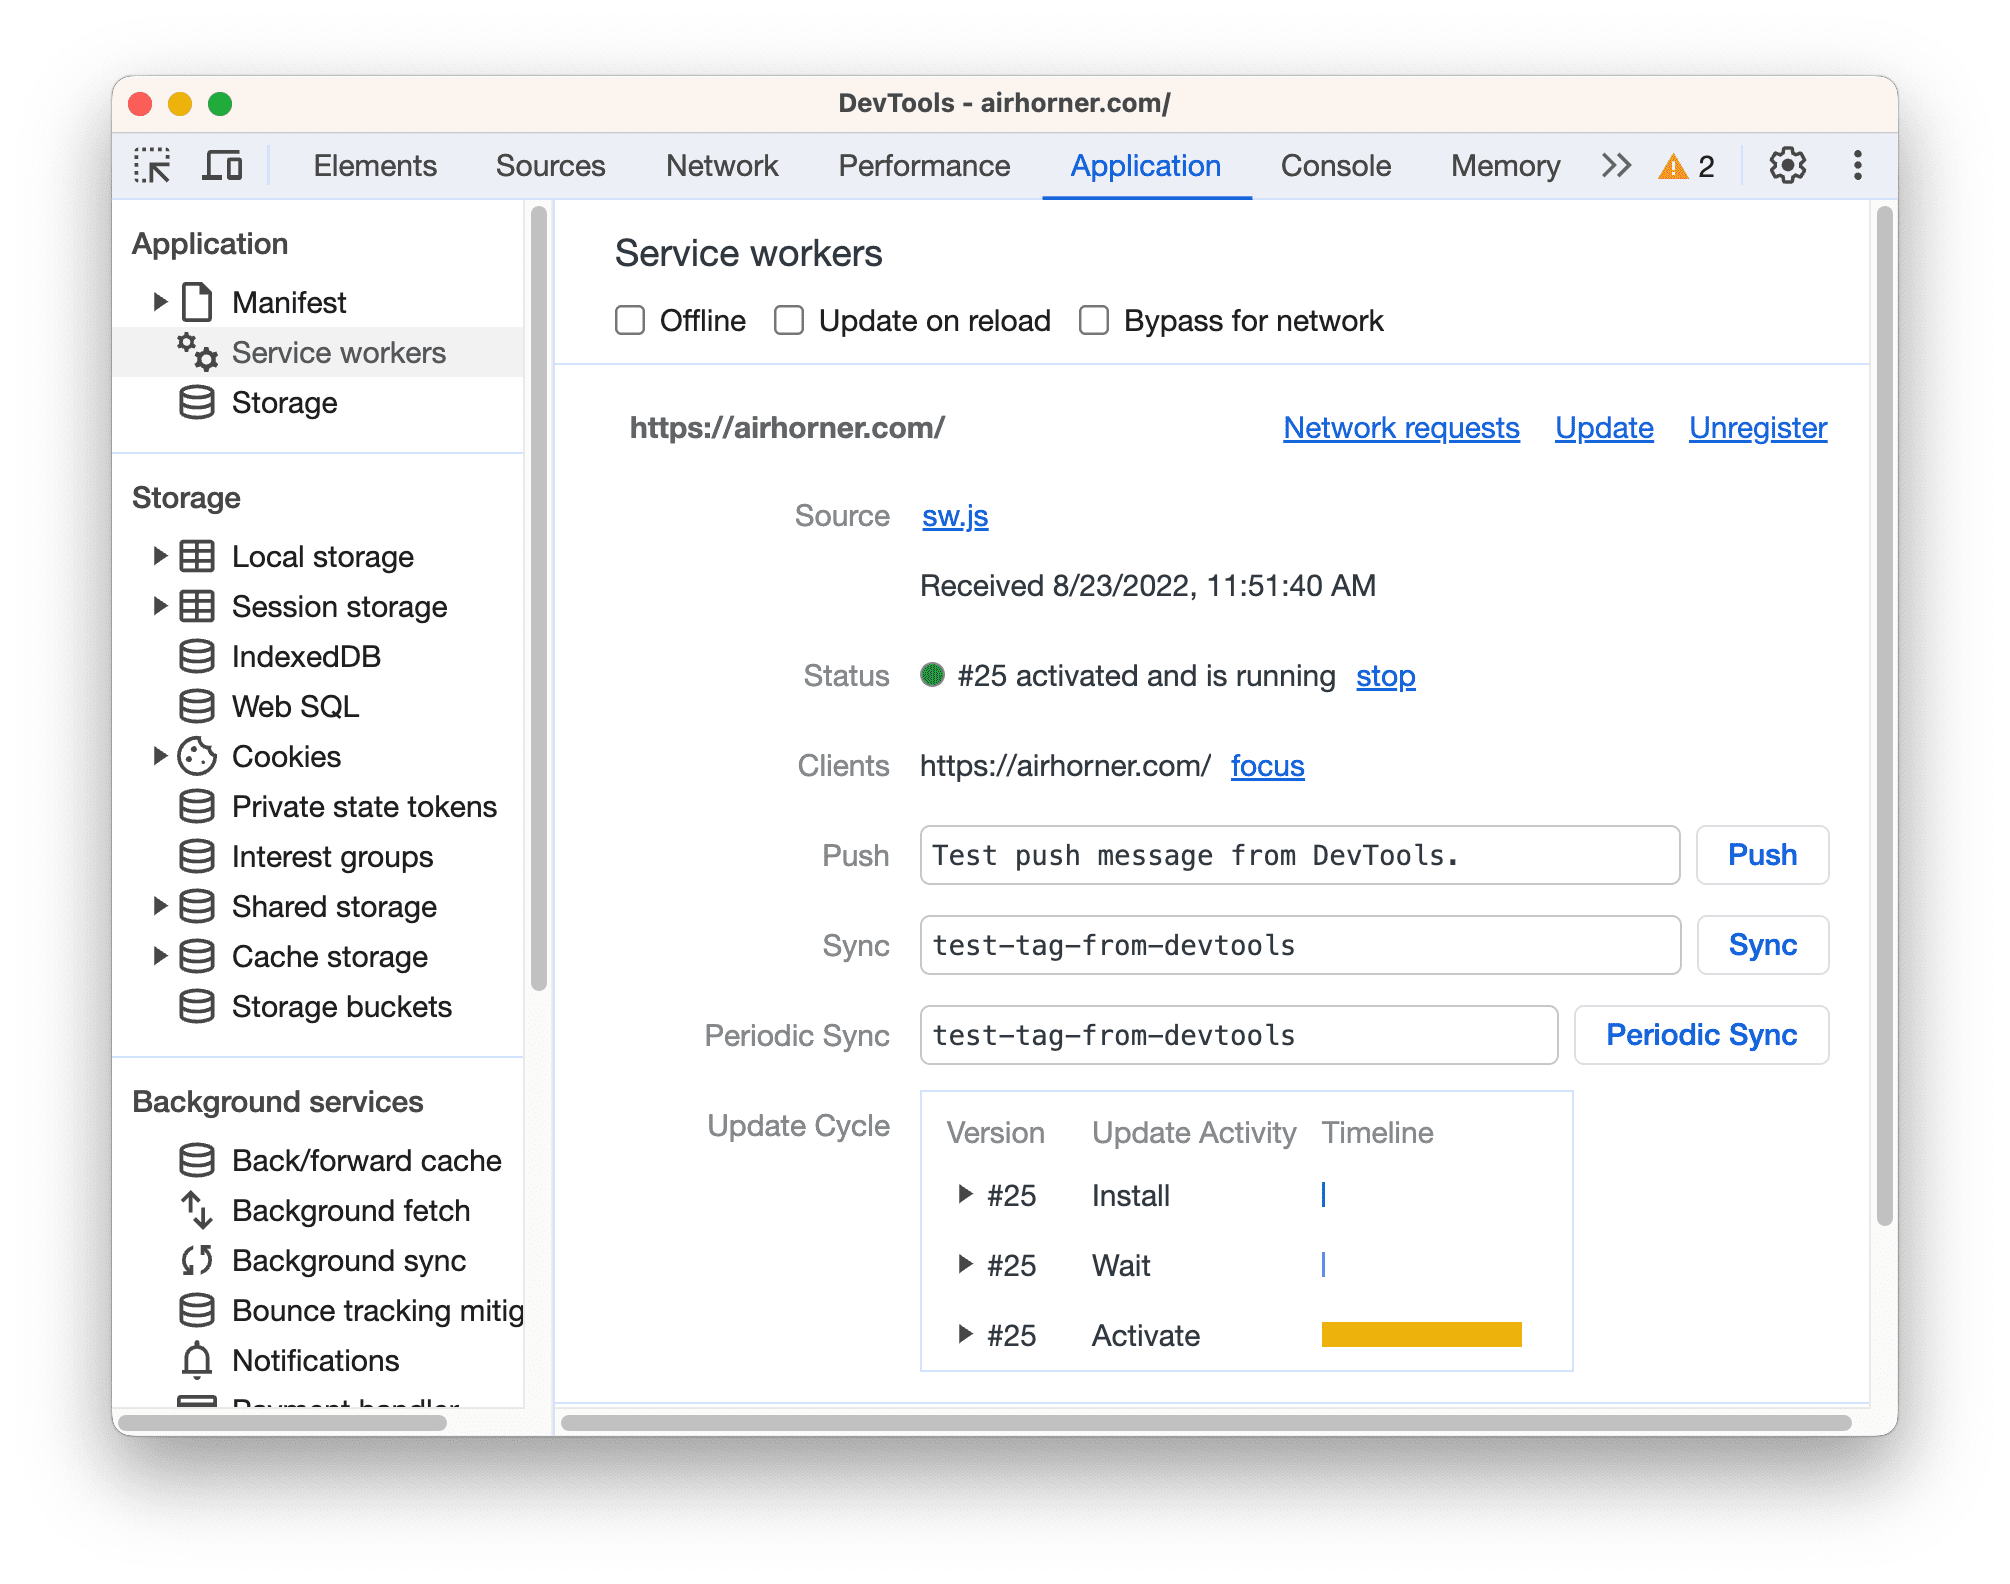
Inspect all resources that are loaded, including IndexedDB or Web SQL databases, local and session storage, cookies, Application Cache, images, fonts, and stylesheets.
- Debug Progressive Web Apps
- View and edit local storage
- View, add, edit, and delete cookies
- View origin trial information
Security panel

Debug mixed content issues, certificate problems, and more.
Community
File bug reports and feature requests in Crbug, which is the engineering team's bug tracker.
If you want to alert us to a bug or feature request but don't have much time, you're welcome to send a tweet to @ChromeDevTools. We reply and send announcements from the account regularly.
For help with using DevTools, Stack Overflow is the best channel.
To file bugs or feature requests on the DevTools docs, open a GitHub issue.
DevTools also has a Slack channel, but the team doesn't monitor it consistently.