


Use the Application panel to inspect, modify, and debug web app manifests, service workers, and service worker caches.
Progressive Web Apps (PWAs) are modern, high quality applications built using web technology. PWAs offer similar capabilities to iOS, Android, and desktop apps. They are:
- Reliable even in unstable network conditions.
- Installable to launch surfaces of operating systems, such as the Applications folder on Mac OS X, the Start menu on Windows, and the home screen on Android and iOS.
- Show up in activity switchers, device search engines such as Spotlight, and in content sharing sheets.
This guide only discusses the Progressive Web App features of the Application panel. If you're looking for help on the other panes, check out the last section of this guide, Other Application panel guides.
Summary
- Use the Manifest tab to inspect your web app manifest.
- Use the Service Workers tab for a whole range of service-worker-related tasks, like unregistering or updating a service, emulating push events, going offline, or stopping a service worker.
- View your service worker cache from the Cache Storage tab.
- Unregister a service worker and clear all storage and caches with a single button click from the Clear storage tab.
Web app manifest
If you want your users to be able to add your app to their the Applications folder on Mac OS X, the Start menu on Windows, and the home screen on Android and iOS, you need a web app manifest. The manifest defines how the app appears on the home screen, where to direct the user when launching from home screen, and what the app looks like on launch.
Once you've got your manifest set up, you can use the Manifest tab of the Application panel to inspect it.
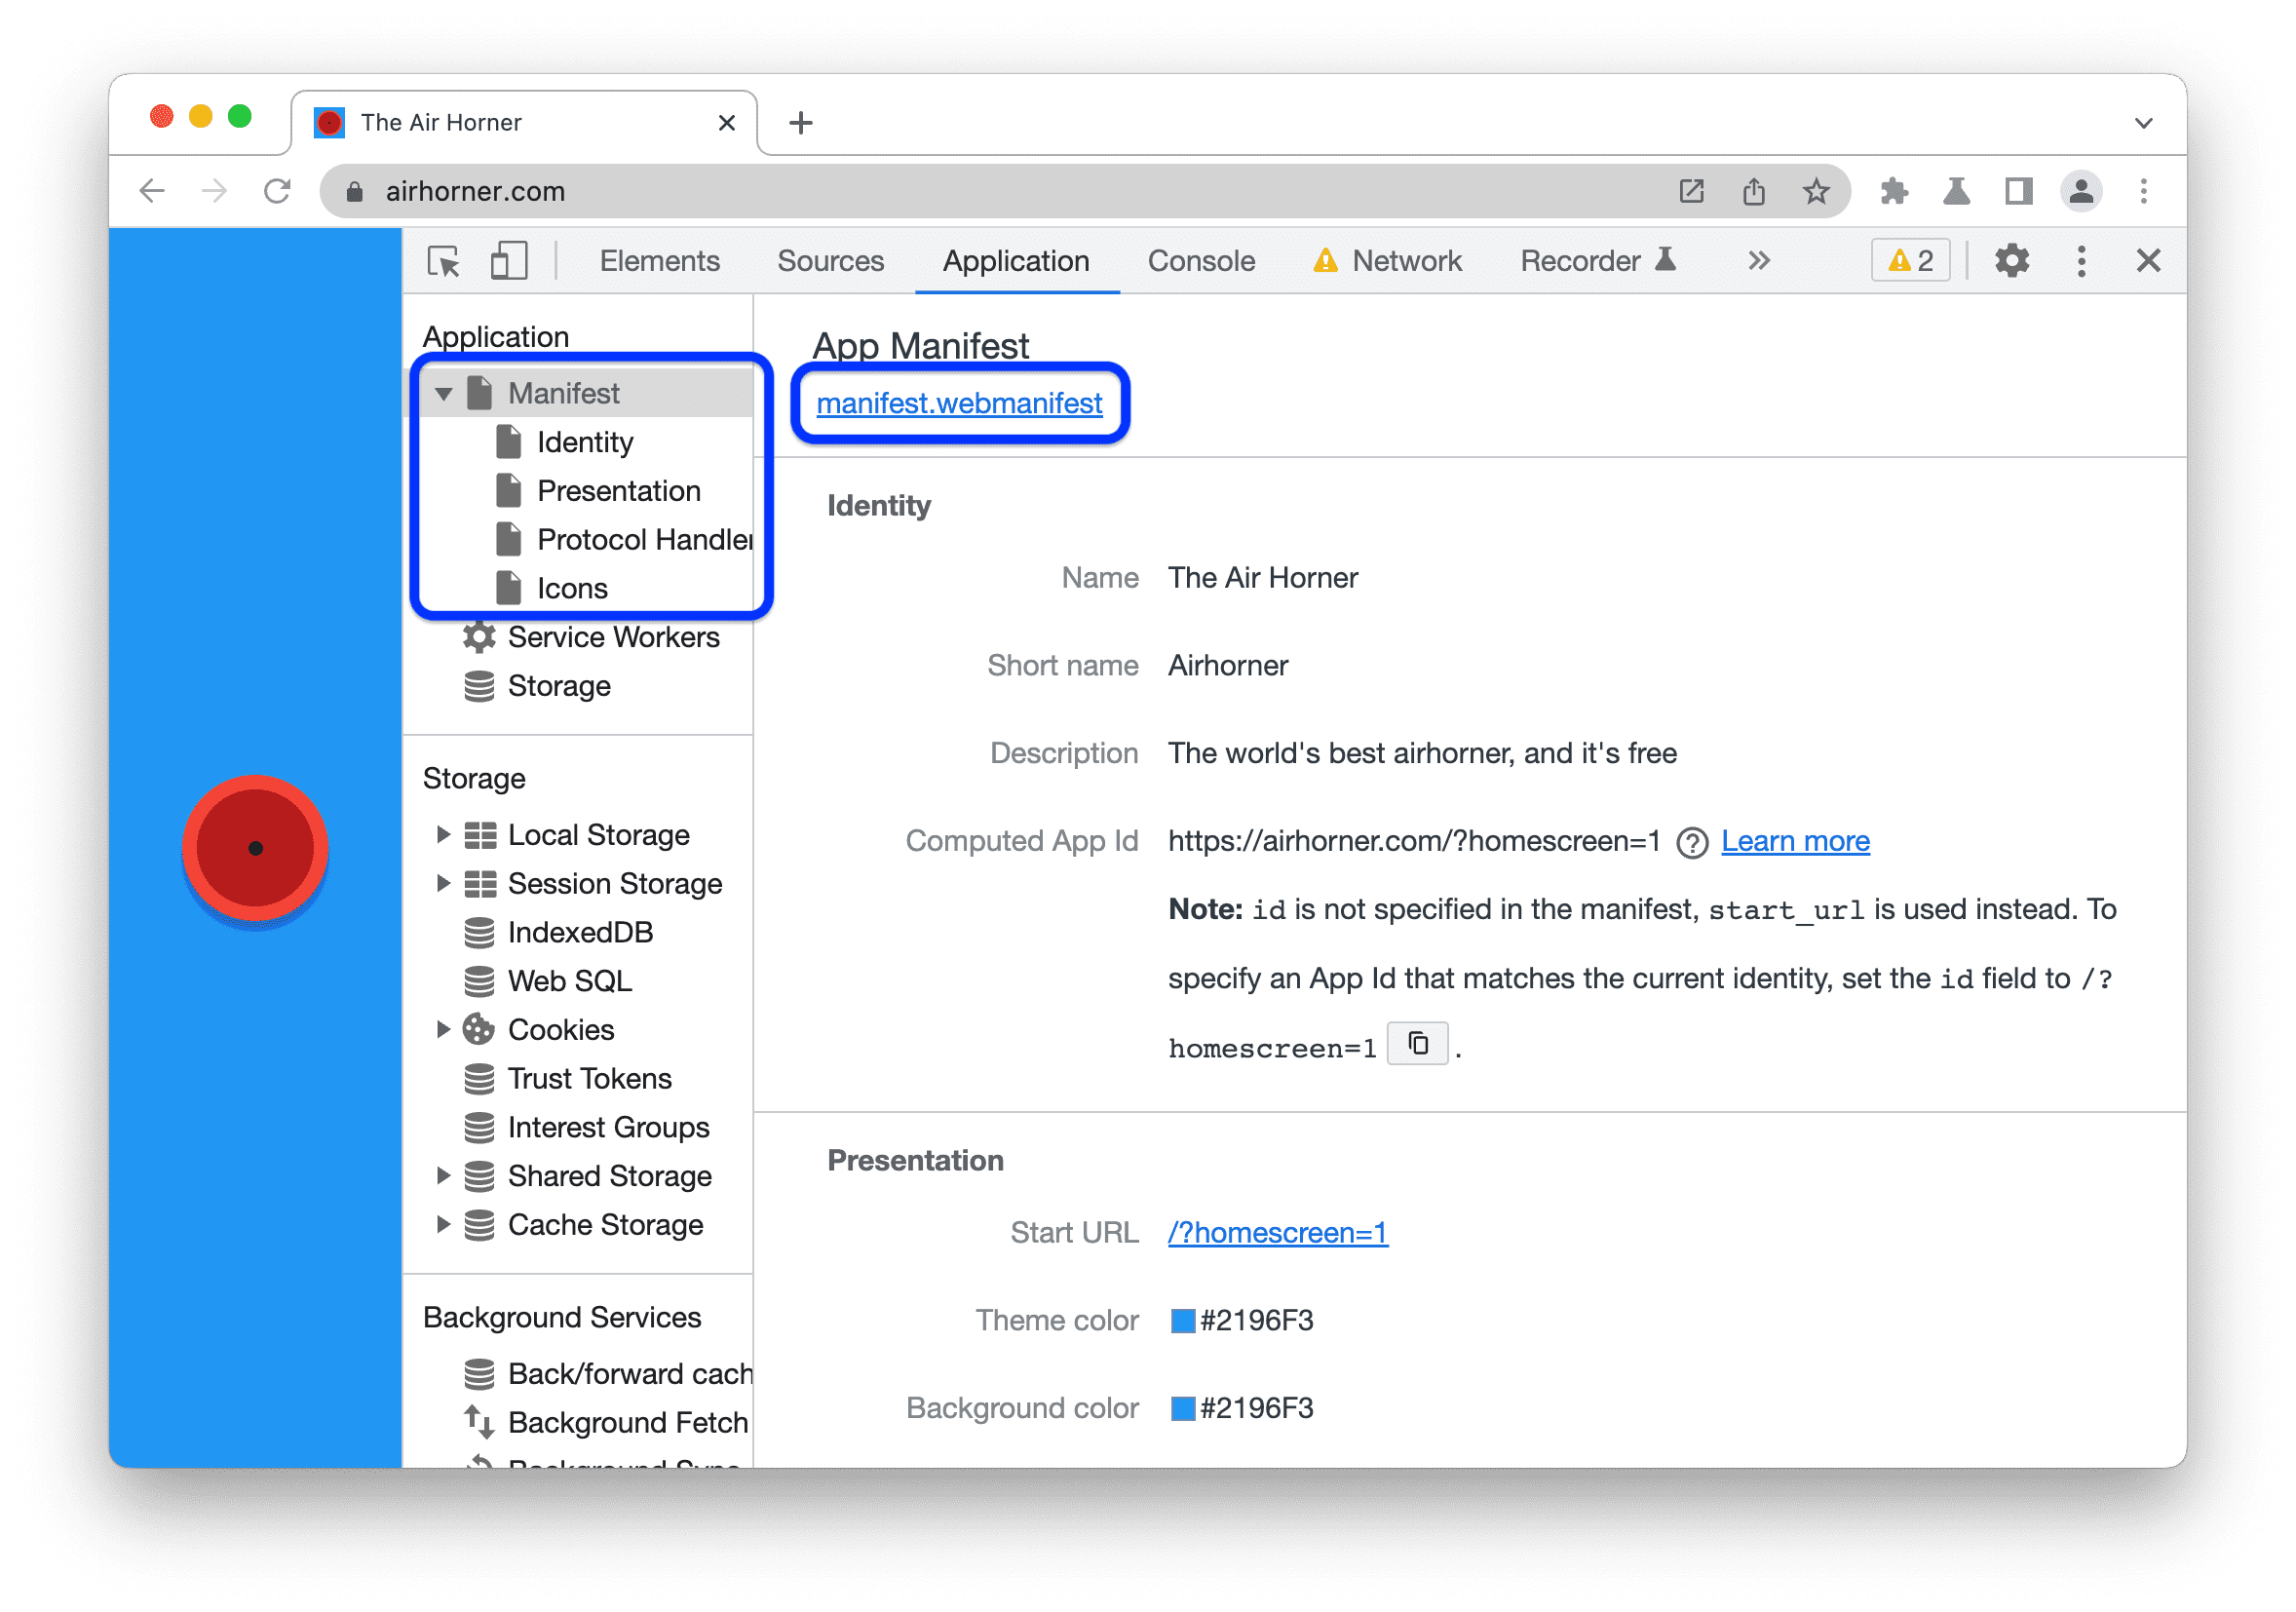
- To look at the manifest source, click the link below App Manifest label
(
manifest.webmanifestin the screenshot above). - The Identity and Presentation sections just display fields from the manifest source in a more user-friendly way.
- The Protocol Handlers section lets you to test the URL protocol handler registration of your PWA with a click of a button. To learn more, see Test URL protocol handler registration.
- The Icons section displays every icon that you've specified and lets you check their masks.
- The Shortcut #N set of sections displays information on all your shortcut objects.
- The Screenshot #N set of section displays the screenshots for a richer installation UI of your app.
In addition, if DevTools encounters an error, such as an icon that cannot be loaded, the Manifest tab displays an Installability section describing the error.

View and check maskable icons
The Icons section of the Manifest tab displays all the icons of your application. In this section, you can also check safe areas for maskable icons, the format of icons that adapt to platforms.
To trim the icons so that only the minimum safe area is visible, check ![]() Show only the minimum safe area for maskable icons.
Show only the minimum safe area for maskable icons.
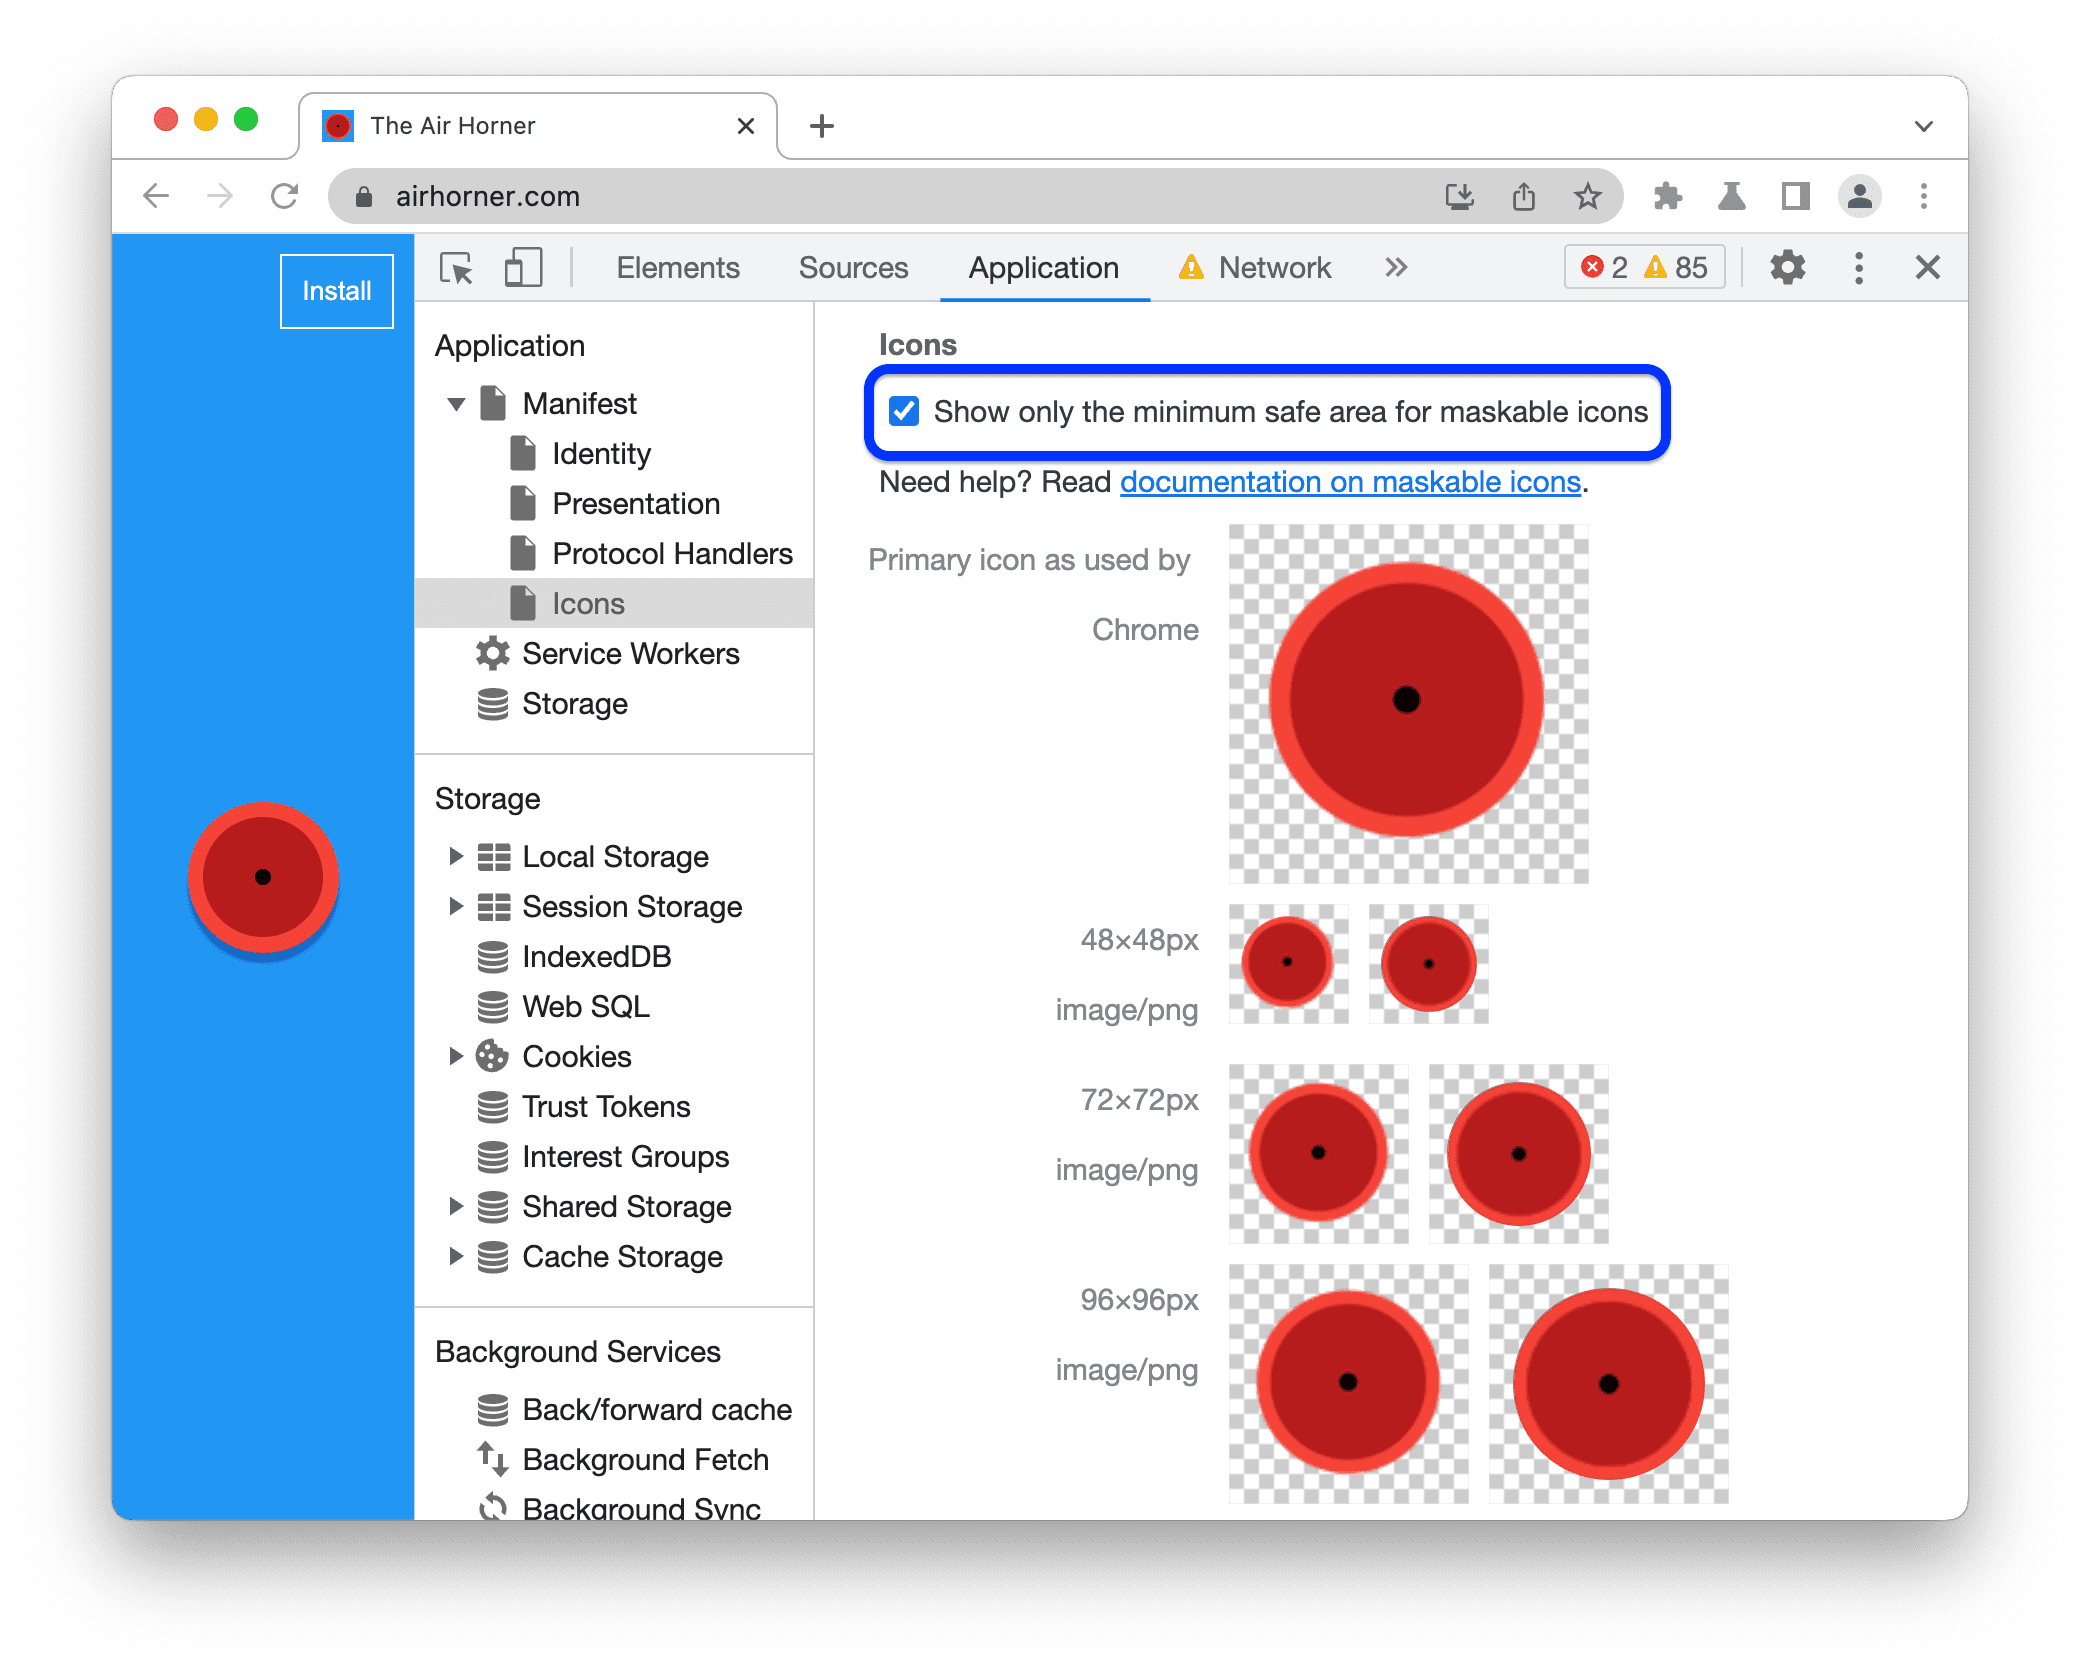
If your entire logo is visible in the safe area, you're good to go.
Trigger installation
Chrome makes it possible for you to enable and promote the installation of your PWA directly within its user interface. Learn How to provide your own in-app installation experience.
To trigger the installation flow of your PWA:
- Open the PWA's landing page in Chrome.
On the right side of the address bar at the top, click
 Install.
Follow the on-screen instructions.
The Install app feature cannot simulate the workflow for mobile devices. Notice how the desktop Chrome browser displays the installation button in the address bar, even though DevTools is in Device Mode. However, if you can successfully add your app to your desktop, then it'll work for mobile, too.
If you want to test out the genuine mobile experience, you can connect a real mobile device to
DevTools via remote debugging. To trigger the installation on the connected mobile device, open the ![]() three-dot menu and click
three-dot menu and click ![]() Install app.
Install app.
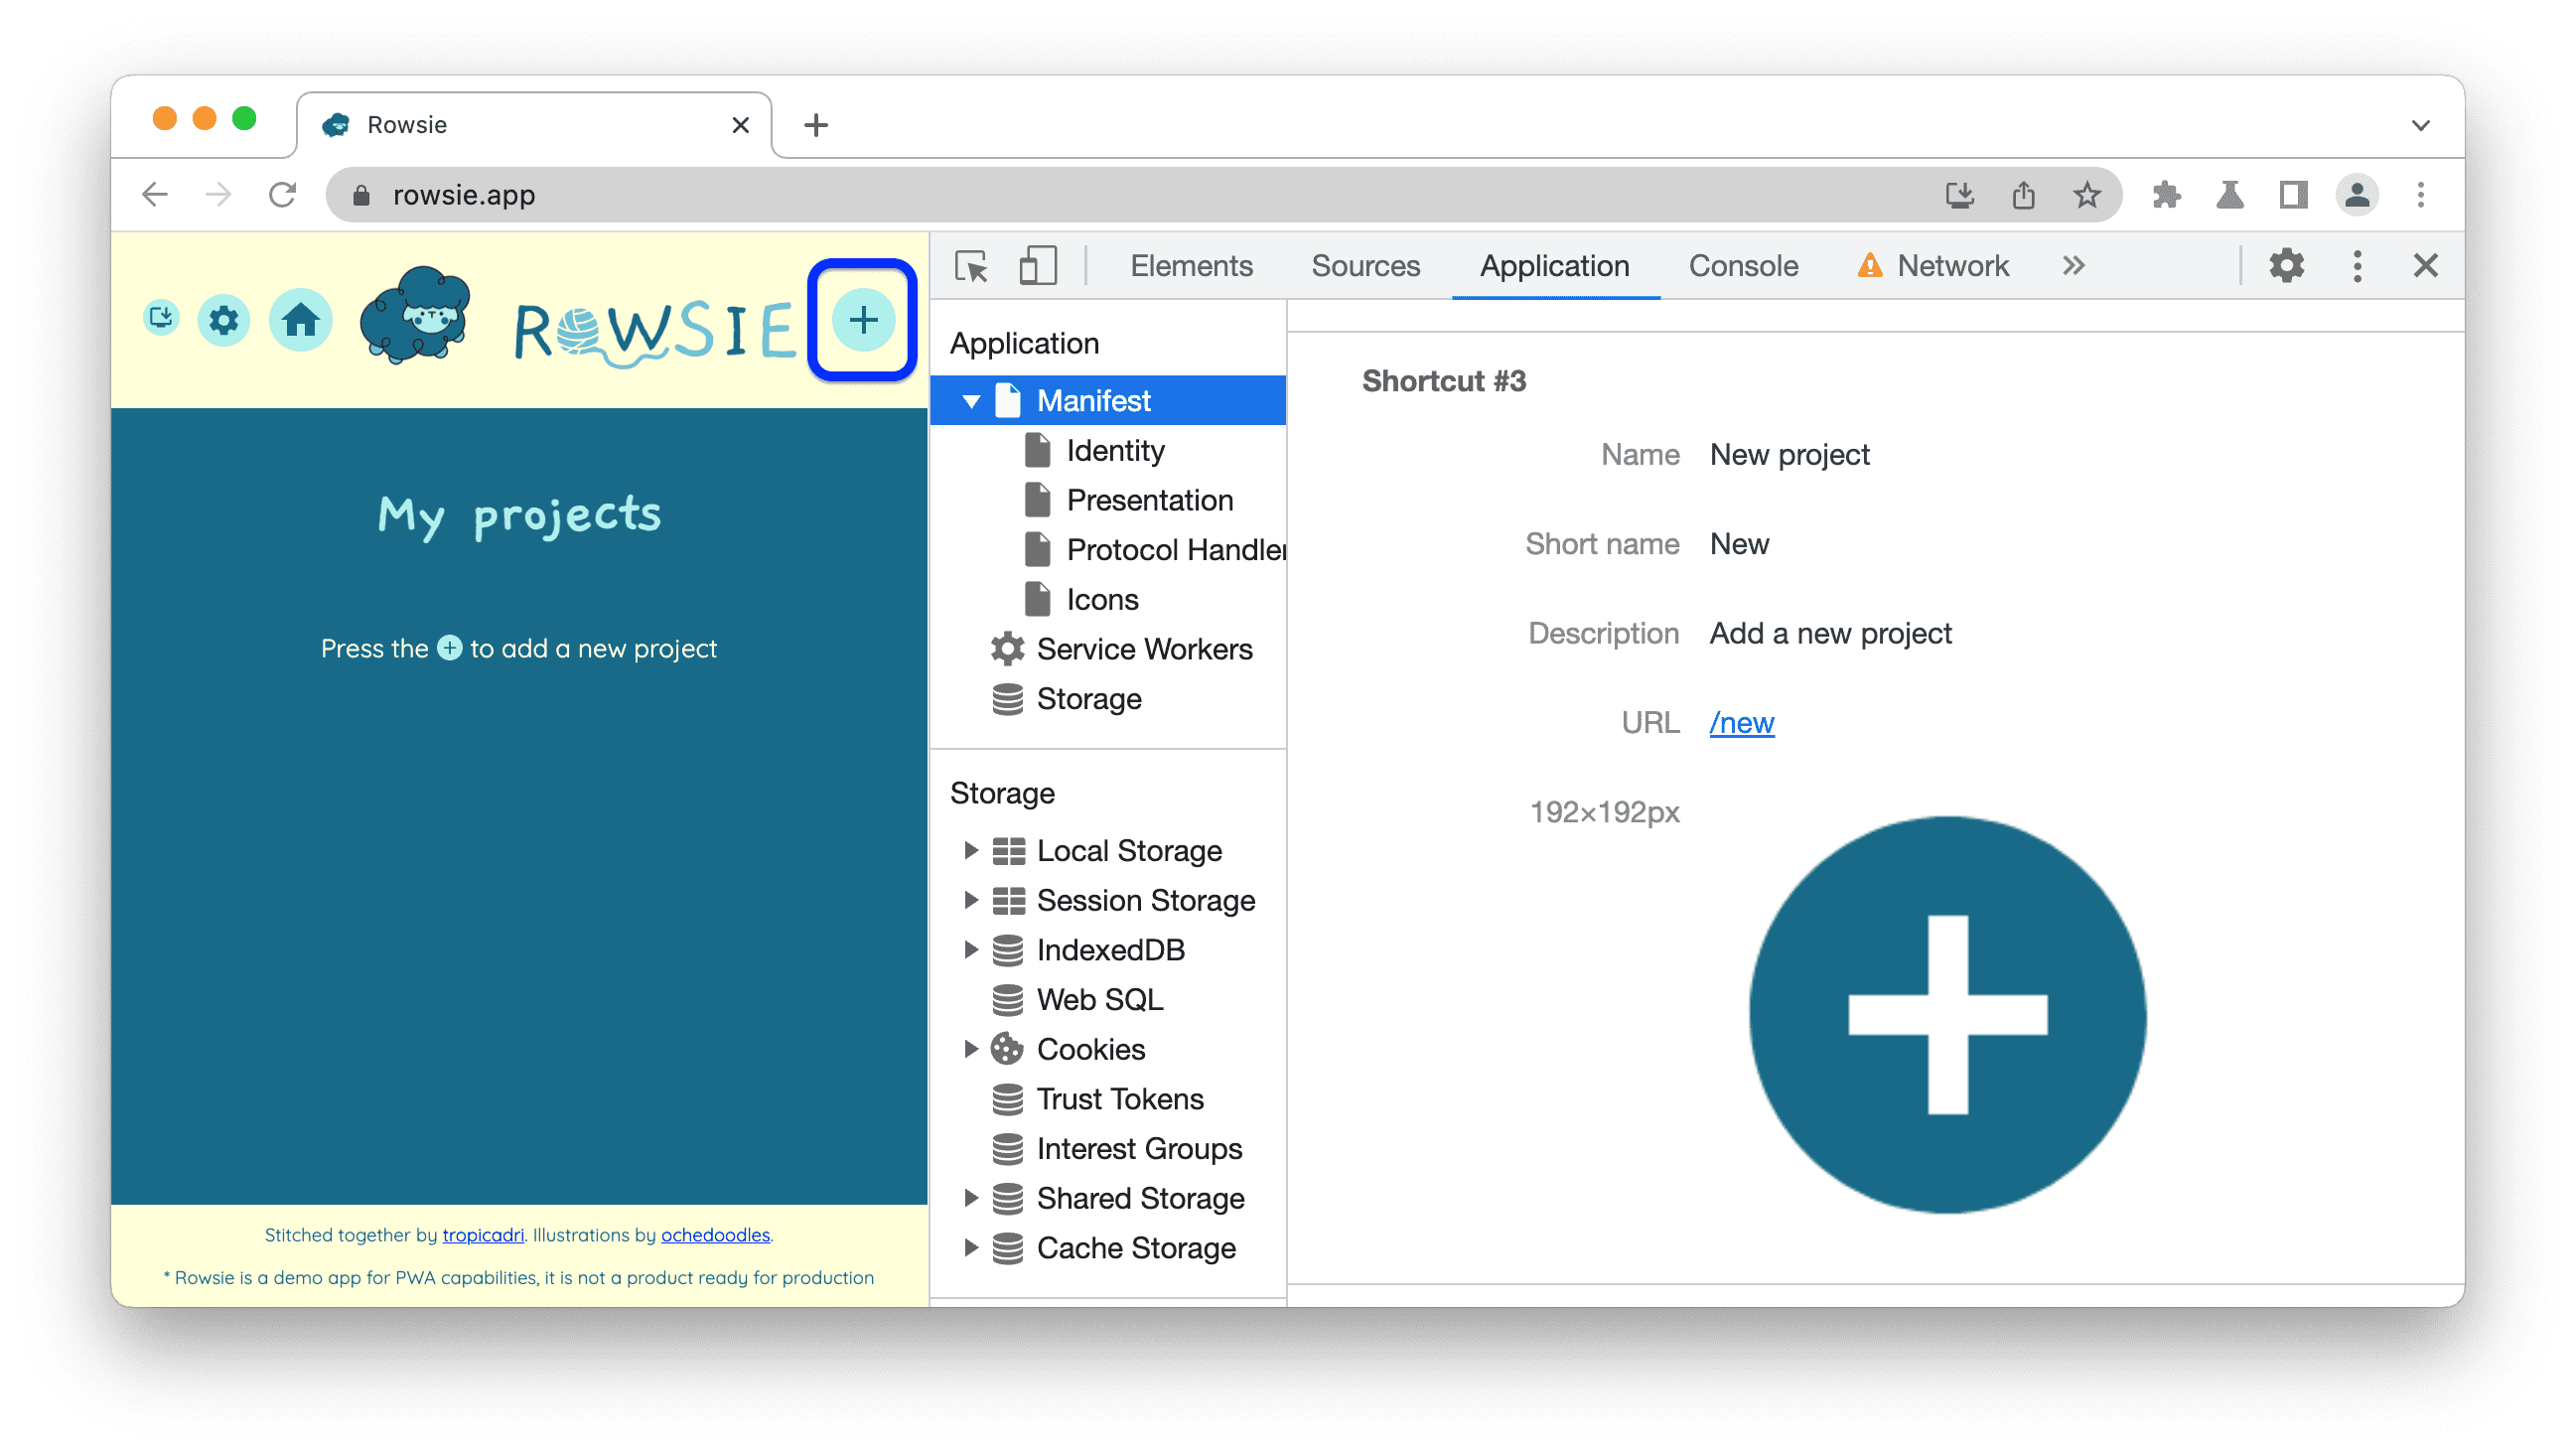
Inspect shortcuts
App shortcuts let you to provide quick access to a handful of common actions that users need frequently.
To inspect the shortcuts you defined in your manifest file, scroll to the Shortcut #N sections of the Manifest tab.
Inspect screenshots for a richer installation UI
When you add a description and a set of screenshots to your manifest file, your app gets a richer installation dialog.
To inspect the screenshots, scroll to the Screenshot #N sections of the Manifest tab.

Test URL protocol handler registration
PWAs can handle links that use a specific protocol for a more integrated experience. To learn how to create a handler, see URL protocol handler registration for PWAs.
To test your handler:
- Open DevTools on the landing page of your PWA. For example, check out this demo PWA.
- From the demo page, install the PWA and reload the app after the installation. The browser has now registered the PWA as a handler for the
web+coffeeprotocol. - In the Application > Manifest > Protocol Handler section, enter the URL you want the handler to test and click Test protocol.
 In this example, the handler can process
 americano,chai, andlatte-macchiato. - When Chrome asks you if it can open the app, confirm by clicking Open Protocol Handler.

- In the next dialog, allow the app to handle
web+coffeelinks.
If the handler successfully processes the link, you'll see an image of a coffee cup opened in the app.
Service workers
Service workers are a fundamental technology in the future web platform. They are scripts that the browser runs in the background, separate from a web page. These scripts enable you to access features that don't need a web page or user interaction, like push notifications, background sync, and offline experiences.
Related Guides:
The Service Workers tab in the Application panel is the main place in DevTools to inspect and debug service workers.

- If a service worker is installed to the currently open page, then you'll see it listed on this
tab. For example, in the screenshot above there's a service worker installed for the scope of
https://airhorner.com/. - The
 Offline checkbox puts DevTools into offline mode. This is equivalent to the offline mode
available from the Network panel, or the
Offline checkbox puts DevTools into offline mode. This is equivalent to the offline mode
available from the Network panel, or the Go offlineoption in the Command Menu. - The
 Update on reload checkbox forces the service worker to update on every page load.
 - The
 Bypass for network checkbox bypasses the service worker and forces the browser to go to
the network for requested resources.
Bypass for network checkbox bypasses the service worker and forces the browser to go to
the network for requested resources. - The Network requests link takes you to the Network panel with a list of intercepted requests related to the service worker (
is:service-worker-interceptedfilter). - The Update link performs a one-time update of the specified service worker.
- The Push button emulates a push notification without a payload (also known as a tickle).
- The Sync button emulates a background sync event.
- The Unregister link unregisters the specified service worker. Check out Clear storage for a way to unregister a service worker and wipe storage and caches with a single button click.
- The Source line tells you when the currently running service worker was installed. The link is the name of the service worker's source file. Clicking on the link sends you to the service worker's source.
- The Status line tells you the status of the service worker. The number on this line (
#16in the screenshot) indicates how many times the service worker has been updated. If you enable the Update on reload checkbox you'll notice that the number increments on every page load.
Next to the status you'll see a start link (if the service worker is stopped) or a stop
link (if the service worker is running). Service workers are designed to be stopped and started
by the browser at any time. Explicitly stopping your service worker using the stop link can
simulate that. Stopping your service worker is a great way to test how your code behaves when the
service worker starts back up again. It frequently reveals bugs due to faulty assumptions about
persistent global state.
Update on reload checkbox you'll notice that the number increments on every page load.
Next to the status you'll see a start link (if the service worker is stopped) or a stop
link (if the service worker is running). Service workers are designed to be stopped and started
by the browser at any time. Explicitly stopping your service worker using the stop link can
simulate that. Stopping your service worker is a great way to test how your code behaves when the
service worker starts back up again. It frequently reveals bugs due to faulty assumptions about
persistent global state. - The Clients line tells you the origin that the service worker is scoped to. The focus button is mostly useful when you have multiple registered service workers. If you click on the focus button next to a service worker that is running in a different tab, Chrome focuses on that tab.
The Update Cycle table shows you the service worker's activities and their elapsed times, such as install, wait, and activate. To see the exact timestamp of each activity, click the
 Expand buttons.
For more information, see The service worker lifecycle.
If the service worker causes any errors, the Service Workers tab shows an ![]() Error icon with the number of errors next to the Source line.
The link with the number takes you to the Console with all the logged errors.
Error icon with the number of errors next to the Source line.
The link with the number takes you to the Console with all the logged errors.

To see information on all service workers, click See all registrations at the bottom of the Service Workers tab. This link takes to chrome://serviceworker-internals/?devtools where you can further debug your service workers.

Service worker caches
The Cache Storage tab provides a read-only list of resources that have been cached using the (service worker) Cache API.

Note that the first time you open a cache and add a resource to it, DevTools might not detect the change. Reload the page and you should see the cache.
If you've got two or more caches open, you'll see them listed below the Cache Storage drop-down.

Quota usage
Some responses within the Cache Storage tab may be flagged as being "opaque". This refers to a response retrieved from a different origin, like from a CDN or remote API, when CORS is not enabled.
In order to avoid leakage of cross-domain information, there's significant padding added to the size
of an opaque response used for calculating storage quota limits (i.e. whether a QuotaExceeded
exception is thrown) and reported by the navigator.storage API.
The details of this padding vary from browser to browser, but for Google Chrome, this means that the minimum size that any single cached opaque response contributes to the overall storage usage is approximately 7 megabytes. You should keep this in mind when determining how many opaque responses you want to cache, since you could easily exceeded storage quota limitations much sooner than you'd otherwise expect based on the actual size of the opaque resources.
Related Guides:
Clear storage
The Clear Storage tab is a very useful feature when developing progressive web apps. This tab lets you unregister service workers and clear all caches and storage with a single button click. Check out the section below to learn more.
Related Guides:
Other Application panel guides
Check out the guides below for more help on the other panes of the Application panel.
Related Guides: