


Use the Issues panel to find solutions to problems detected by the browser, such as cookie issues and mixed content.
Overview
By collecting and grouping common problems, the Issues panel reduces notification fatigue and clutter in the Console.
As of now, the Issues panel reports:
- Cookie problems
- Mixed content
- COEP issues
- CORS errors
- Quirks mode issues
- (Preview) Low-contrast issues
- Trusted Web Activity issues
- Stylesheet loading issues
- Invalid
@propertyCSS rules - Content Security Policy violations
- Autocomplete attribute issues
Future versions of Chrome will support more issue types.
Open the Issues panel
- Visit a page with issues to fix.
- Open DevTools.
Click the Open Issues button next to
 Settings in the right corner of the action bar at the top. Depending on issue severity, the button can have a red
  , yellow
  , or blue
  icon.
icon.
Alternatively, select Issues from the
 More tools menu.
Once you're on the Issues panel, you might want to reload the page to catch even more issues, this time occurring during page load.

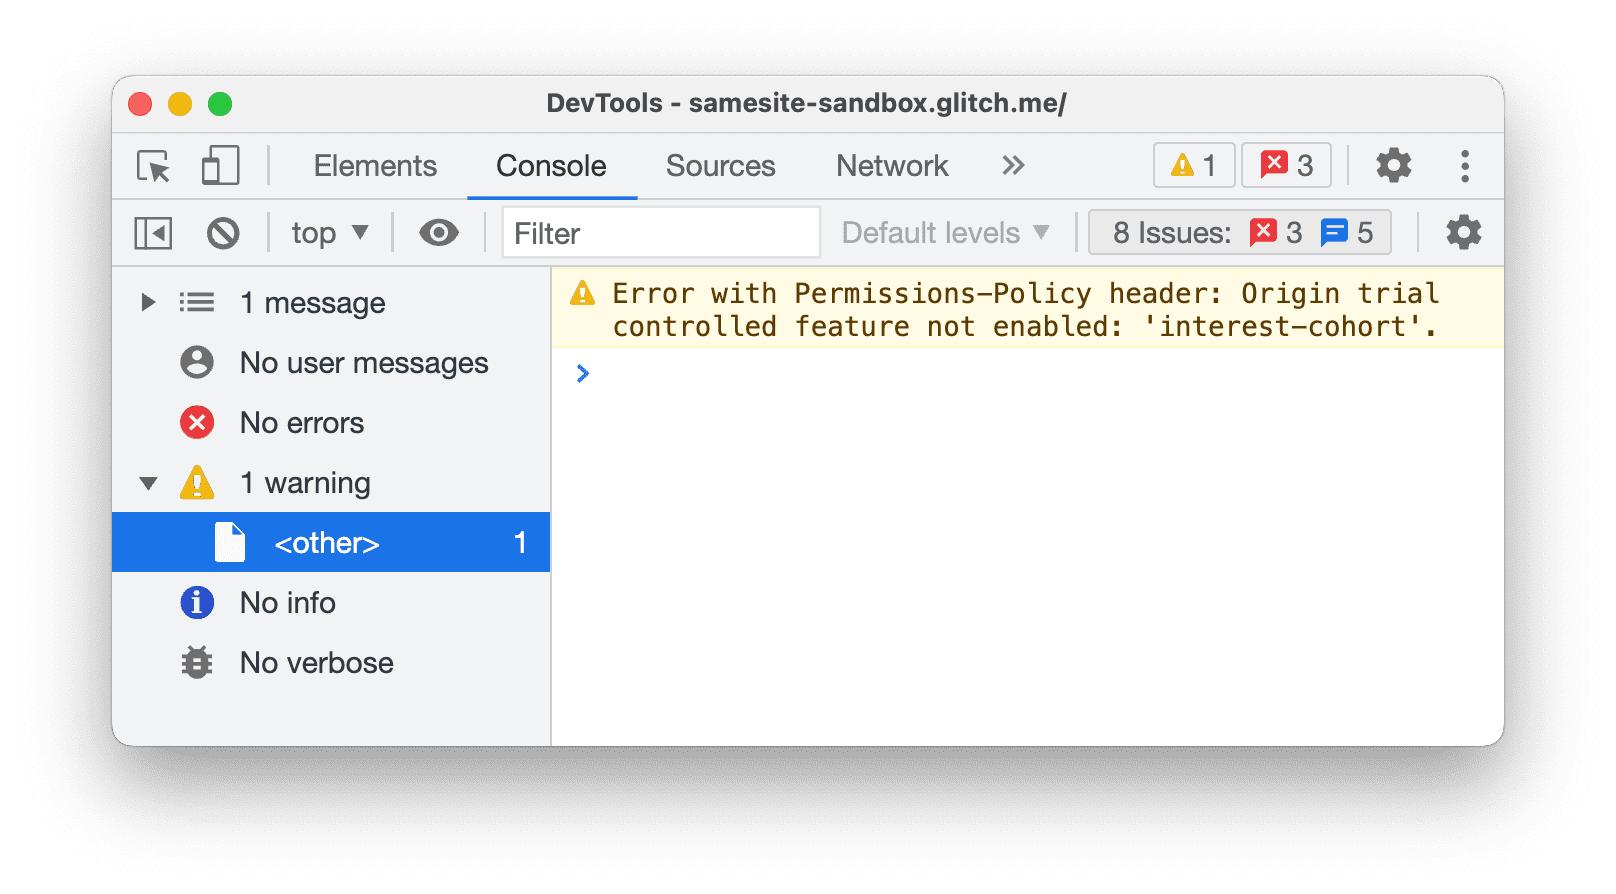
The Console might also show you issues reported by the browser. However, you'll notice that such issues (like the cookie warning in the screenshot below) are hard to understand. It's not clear what you need to do to fix it.
On the other hand, the Issues panel provides you with actionable insights.
View items in the Issues panel
The Issues panel presents warnings from the browser in a structured, aggregated, and actionable way.
Click an item in the Issues panel to expand the issue and get guidance on how to fix it and find affected resources.
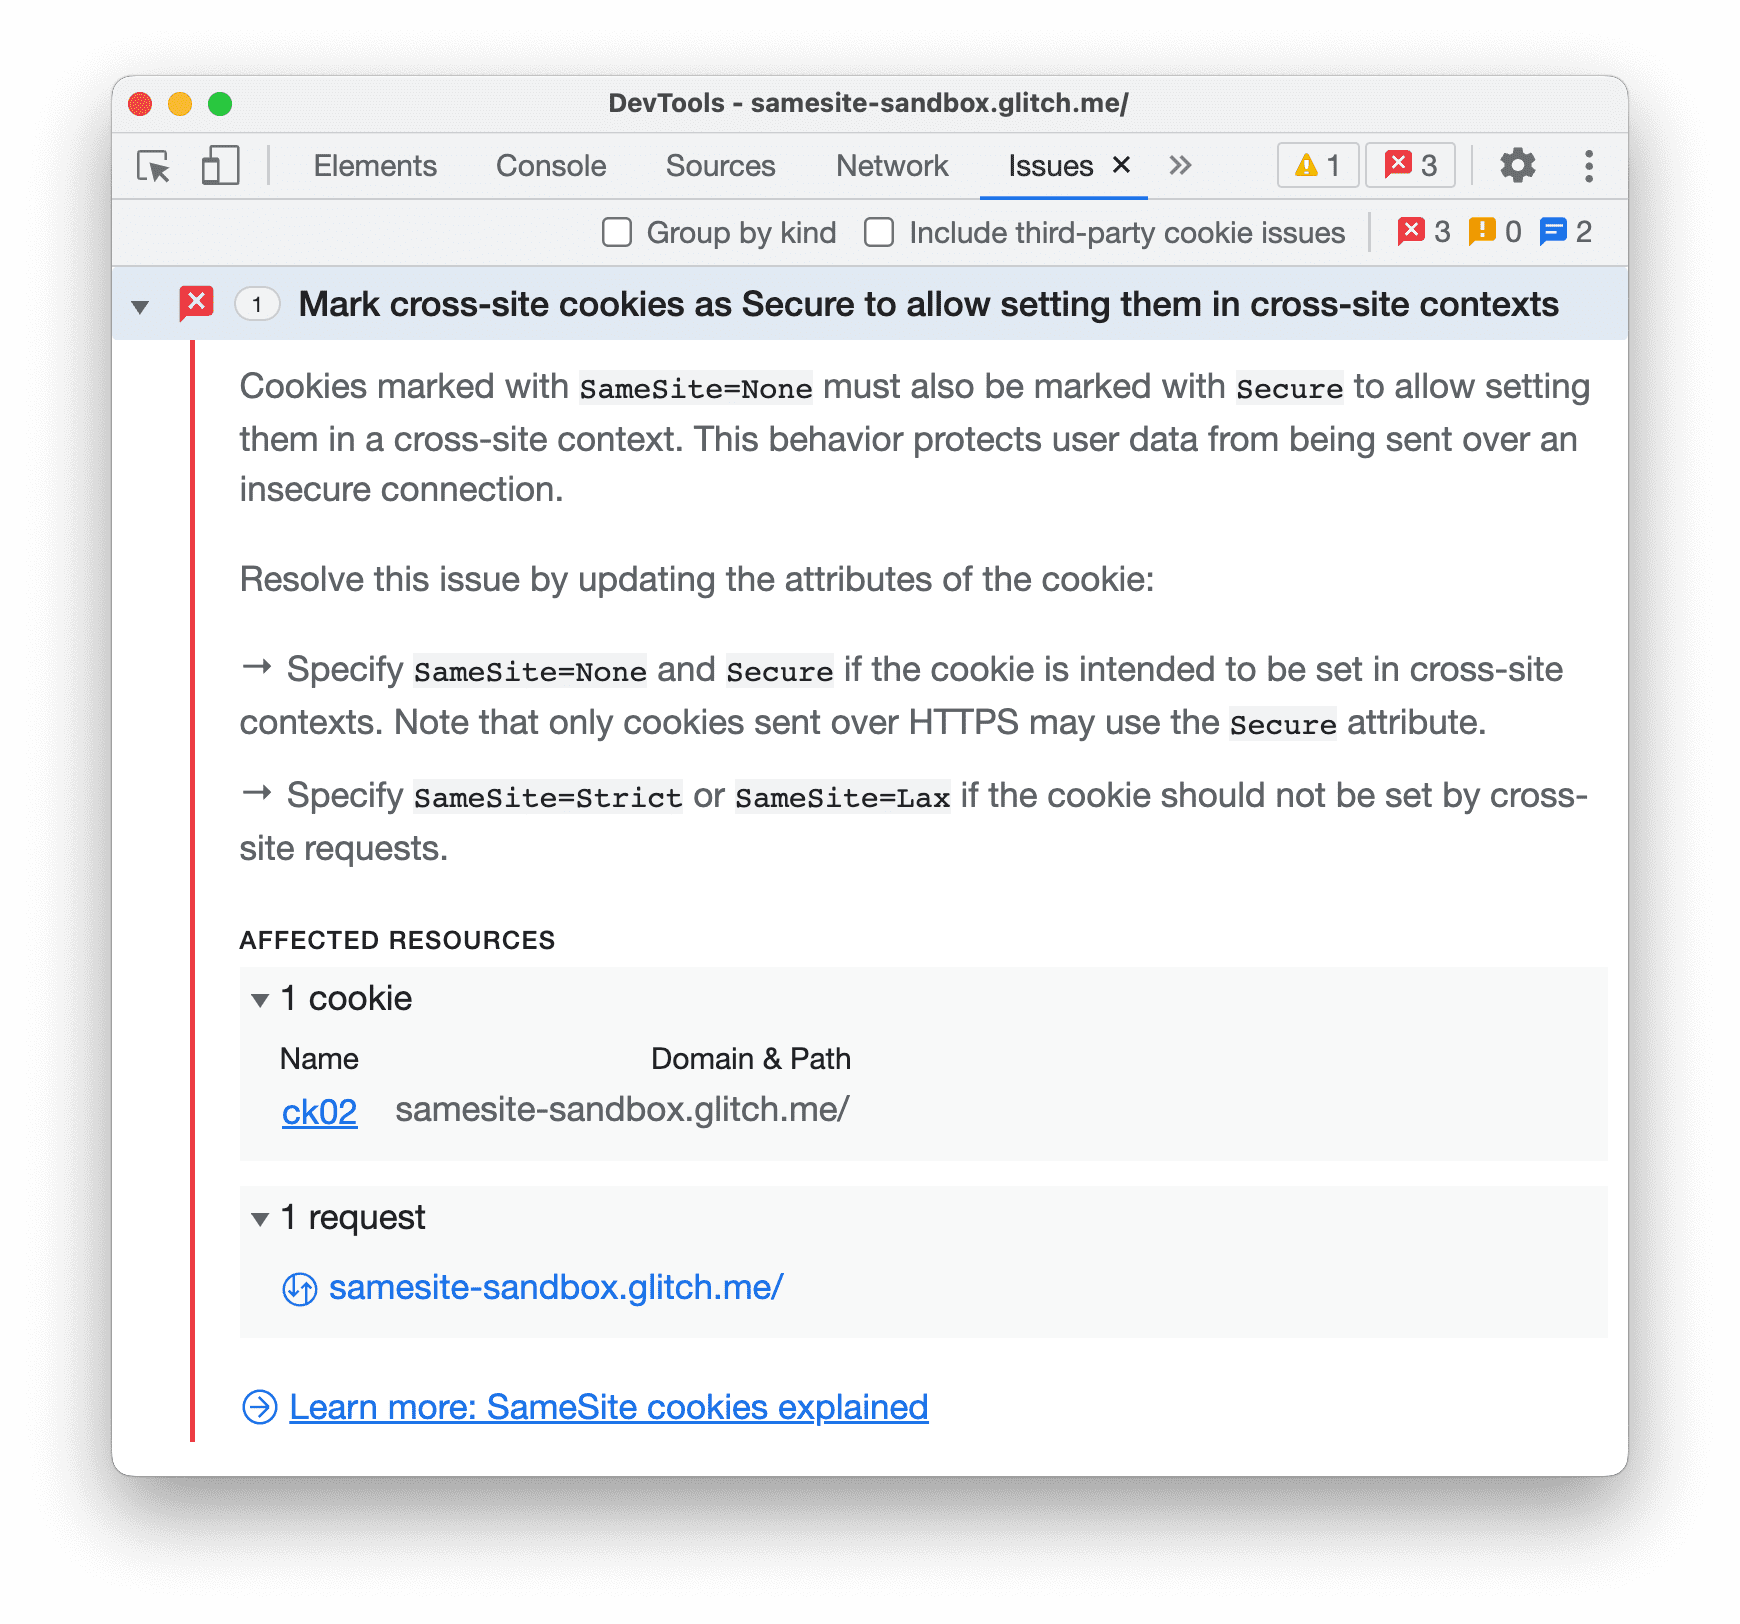
Each item has four components:
- A headline describing the issue.
- A description providing the context and the solution.
- An AFFECTED RESOURCES section that links to resources within the appropriate DevTools context, such as the Network, Sources, Elements, and other panels.
- Links to further guidance.
Click the items in AFFECTED RESOURCES to view issues in context.
Group issues by kind
The Issues panel counts the number of affected resources for each issue and shows it next to their headlines. Additionally, you can organize the issues by their severity in three group kinds:
 Page Errors that Chrome reports.
 Breaking Changes such as deprecations.
 Improvements that DevTools suggests.
To group issues, check ![]() Group by kind in the action bar at the top of the Issues panel.
Group by kind in the action bar at the top of the Issues panel.

Include third-party issues
The Issues panel shows third-party cookies issues by default.
You can find third-party cookie issues in the AFFECTED RESOURCES section missing a link.

To hide such issues, clear ![]() Include third-party cookie issues in the action bar at the top of the Issues panel.
Include third-party cookie issues in the action bar at the top of the Issues panel.
Hide issues
To hide an issue, select Hide issues like this from the ![]() three-dot menu next to the issue.
three-dot menu next to the issue.

To see the list of hidden issues, scroll down to the Hidden issues section and expand it.

To reveal all issues, click Unhide all. To reveal a specific issue, select Unhide issues like this from the ![]() three-dot menu next to the issue.
three-dot menu next to the issue.
Additionally, with grouping enabled, you can hide entire groups of issues using the same three-dot menu next to a group.

View issues in context
To investigate an issue:
In the AFFECTED RESOURCES section, click a resource link to view the item in the appropriate context within DevTools. The link takes you to the Network panel.

Scroll to view the item with a problem: in this case, the cookie
ck02. Hover over the information icon on the right to see the problem and how to fix it.