
DevTools
Chrome 開發人員工具是直接內建在 Google Chrome 瀏覽器中的網頁開發人員工具。開發人員工具可讓您即時編輯網頁並快速診斷問題,更快打造出更優質的網站。
DevTools 支援多種常見的網路開發工作。請直接前往本頁,探索開發人員工具的一些重要功能。不知道該從何處著手,或是第一次使用開發人員工具?觀看開發人員工具簡介影片。

AI 協助功能與控制台深入分析
瞭解開發人員工具中的 AI 創新如何協助您事半功倍。

開始使用
讓 Gemini 協助您分析及改善網站的樣式、網路、來源和成效。
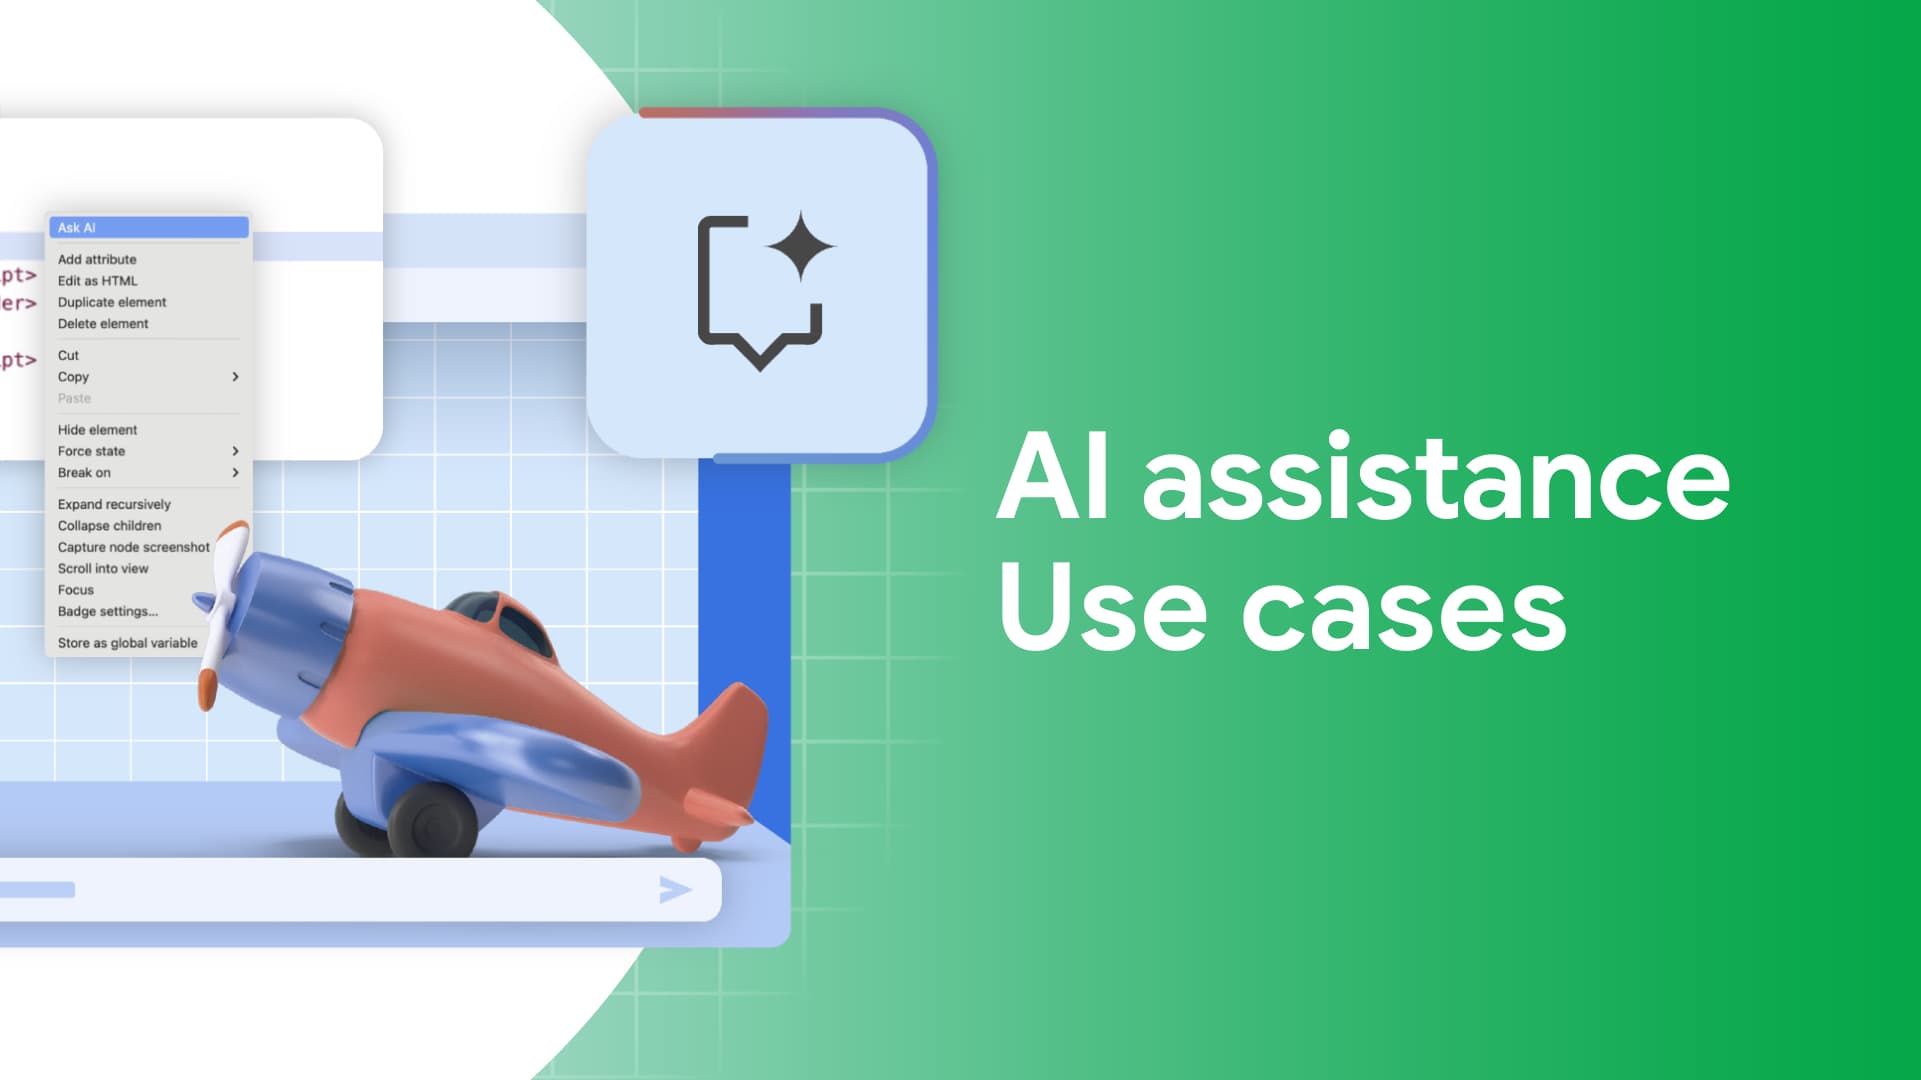
從他人經驗中汲取靈感
瞭解 Chrome 開發人員工具中 AI 輔助功能的用途,以及如何在樣式、效能等方面支援您的偵錯工作流程。

瞭解控制台訊息
瞭解開發人員工具中的主控台訊息和錯誤,並瞭解如何修正這些問題,無須複製貼上。
開發人員工具提示
每月推出的影片系列,說明如何使用開發人員工具解決常見的網頁開發問題。
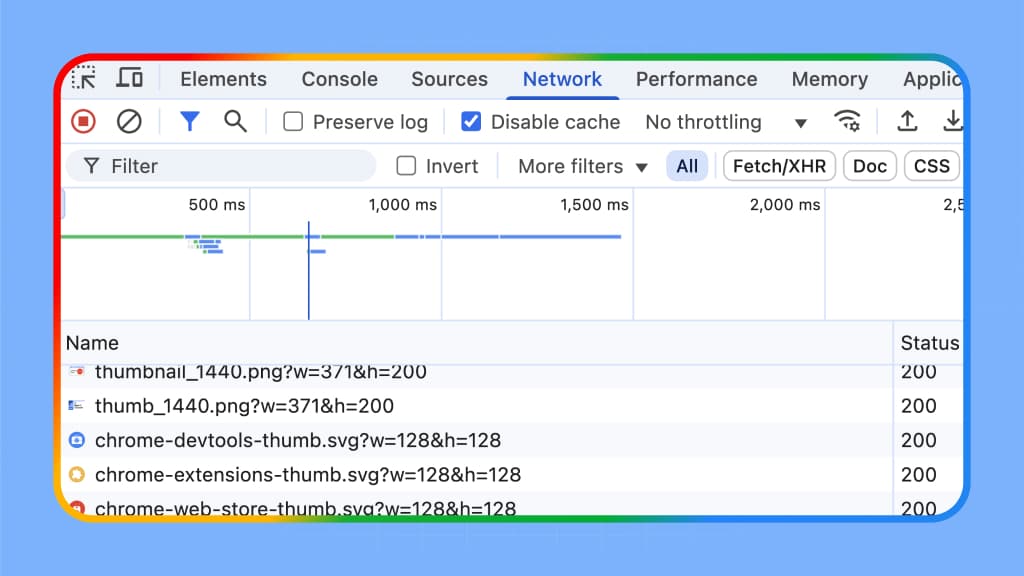
記錄及分析效能追蹤記錄
瞭解如何在 DevTools 中記錄效能追蹤記錄,並分析這些記錄來找出及修正效能問題。
監控即時 Core Web Vitals
偵錯 LCP 問題並使用 CrUX 資料,瞭解您是否為使用者偵錯類似的體驗
快取的秘密
深入瞭解不同類型的瀏覽器快取,以及如何在 Chrome 開發人員工具中檢查及管理快取!
凍結畫面並檢查消失的元素
嘗試檢查元素,但它「咻」地消失了嗎?就像程式碼在跟您玩捉迷藏遊戲!
取得成效洞察
多種工具可協助您評估及改善各項執行階段效能:效能面板、Lighthouse 等。

效能工具簡介
瞭解「效能」面板中的所有功能,包括如何記錄效能追蹤記錄、如何查看及分析追蹤記錄等。

成效工具的未來
在過去 15 年,成效檢視畫面一直協助開發人員評估及最佳化執行階段效能。瞭解未來的發展方向。

為效能追蹤記錄加上註解
直接在原地標註追蹤記錄,並直接儲存在追蹤記錄檔案中,方便分享。
最新消息與動態


更多工具
探索開發人員工具中的所有其他功能。
元素
瞭解如何查看及變更頁面的 DOM。
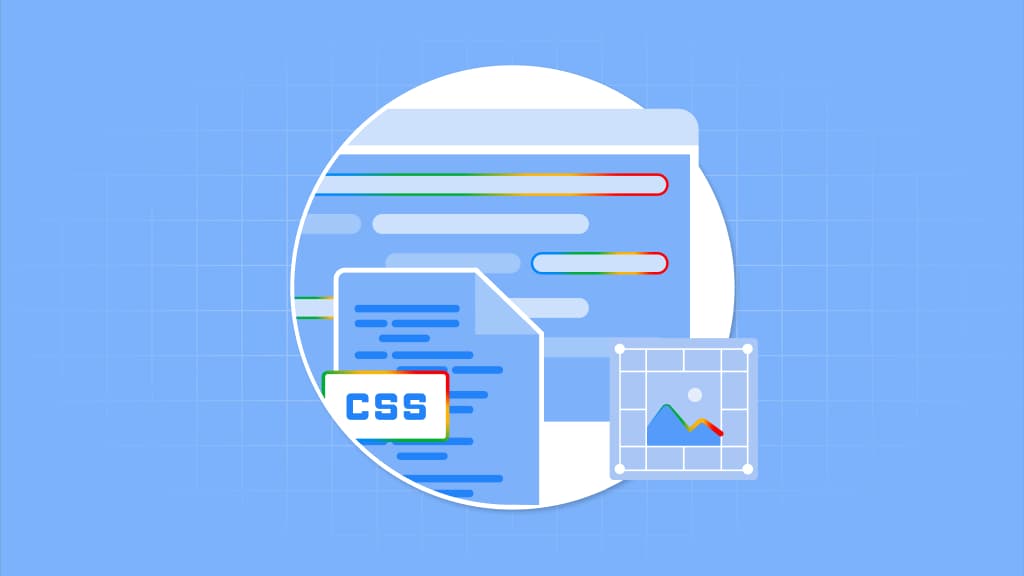
樣式
瞭解如何查看及變更網頁的 CSS。
轉乘次數
追蹤 HTML、CSS 和 JavaScript 的變更。
控制台
記錄訊息並執行 JavaScript。
效能
評估網站成效。
記憶體
找出影響網頁效能的記憶體問題,包括記憶體流失等。
應用程式
檢查、修改及偵錯網頁應用程式、測試快取、查看儲存空間等等。
動畫
檢查及修改動畫。
錄音工具
記錄、重播、評估使用者流程,以及編輯步驟。
算繪
探索一系列會影響網路內容轉譯的選項。
自動填入
檢查已儲存的地址並進行偵錯。
問題
找出網站問題並加以修正。
隱私權與安全性
確認網頁已完全受到 HTTPS 保護。
媒體
為每個瀏覽器分頁查看資訊和偵錯媒體播放器。
感應器
模擬裝置感應器。
WebAuthn
模擬驗證器。