


This page is a comprehensive reference of Chrome DevTools features related to analyzing performance.
See Analyze runtime performance for a guided tutorial on how to analyze a page's performance using Chrome DevTools.
Live metrics screen
When you first open the Performance panel you will be presented with the Live Metrics screen which gives you an instant performance summary of the current page using the three Core Web Vitals.
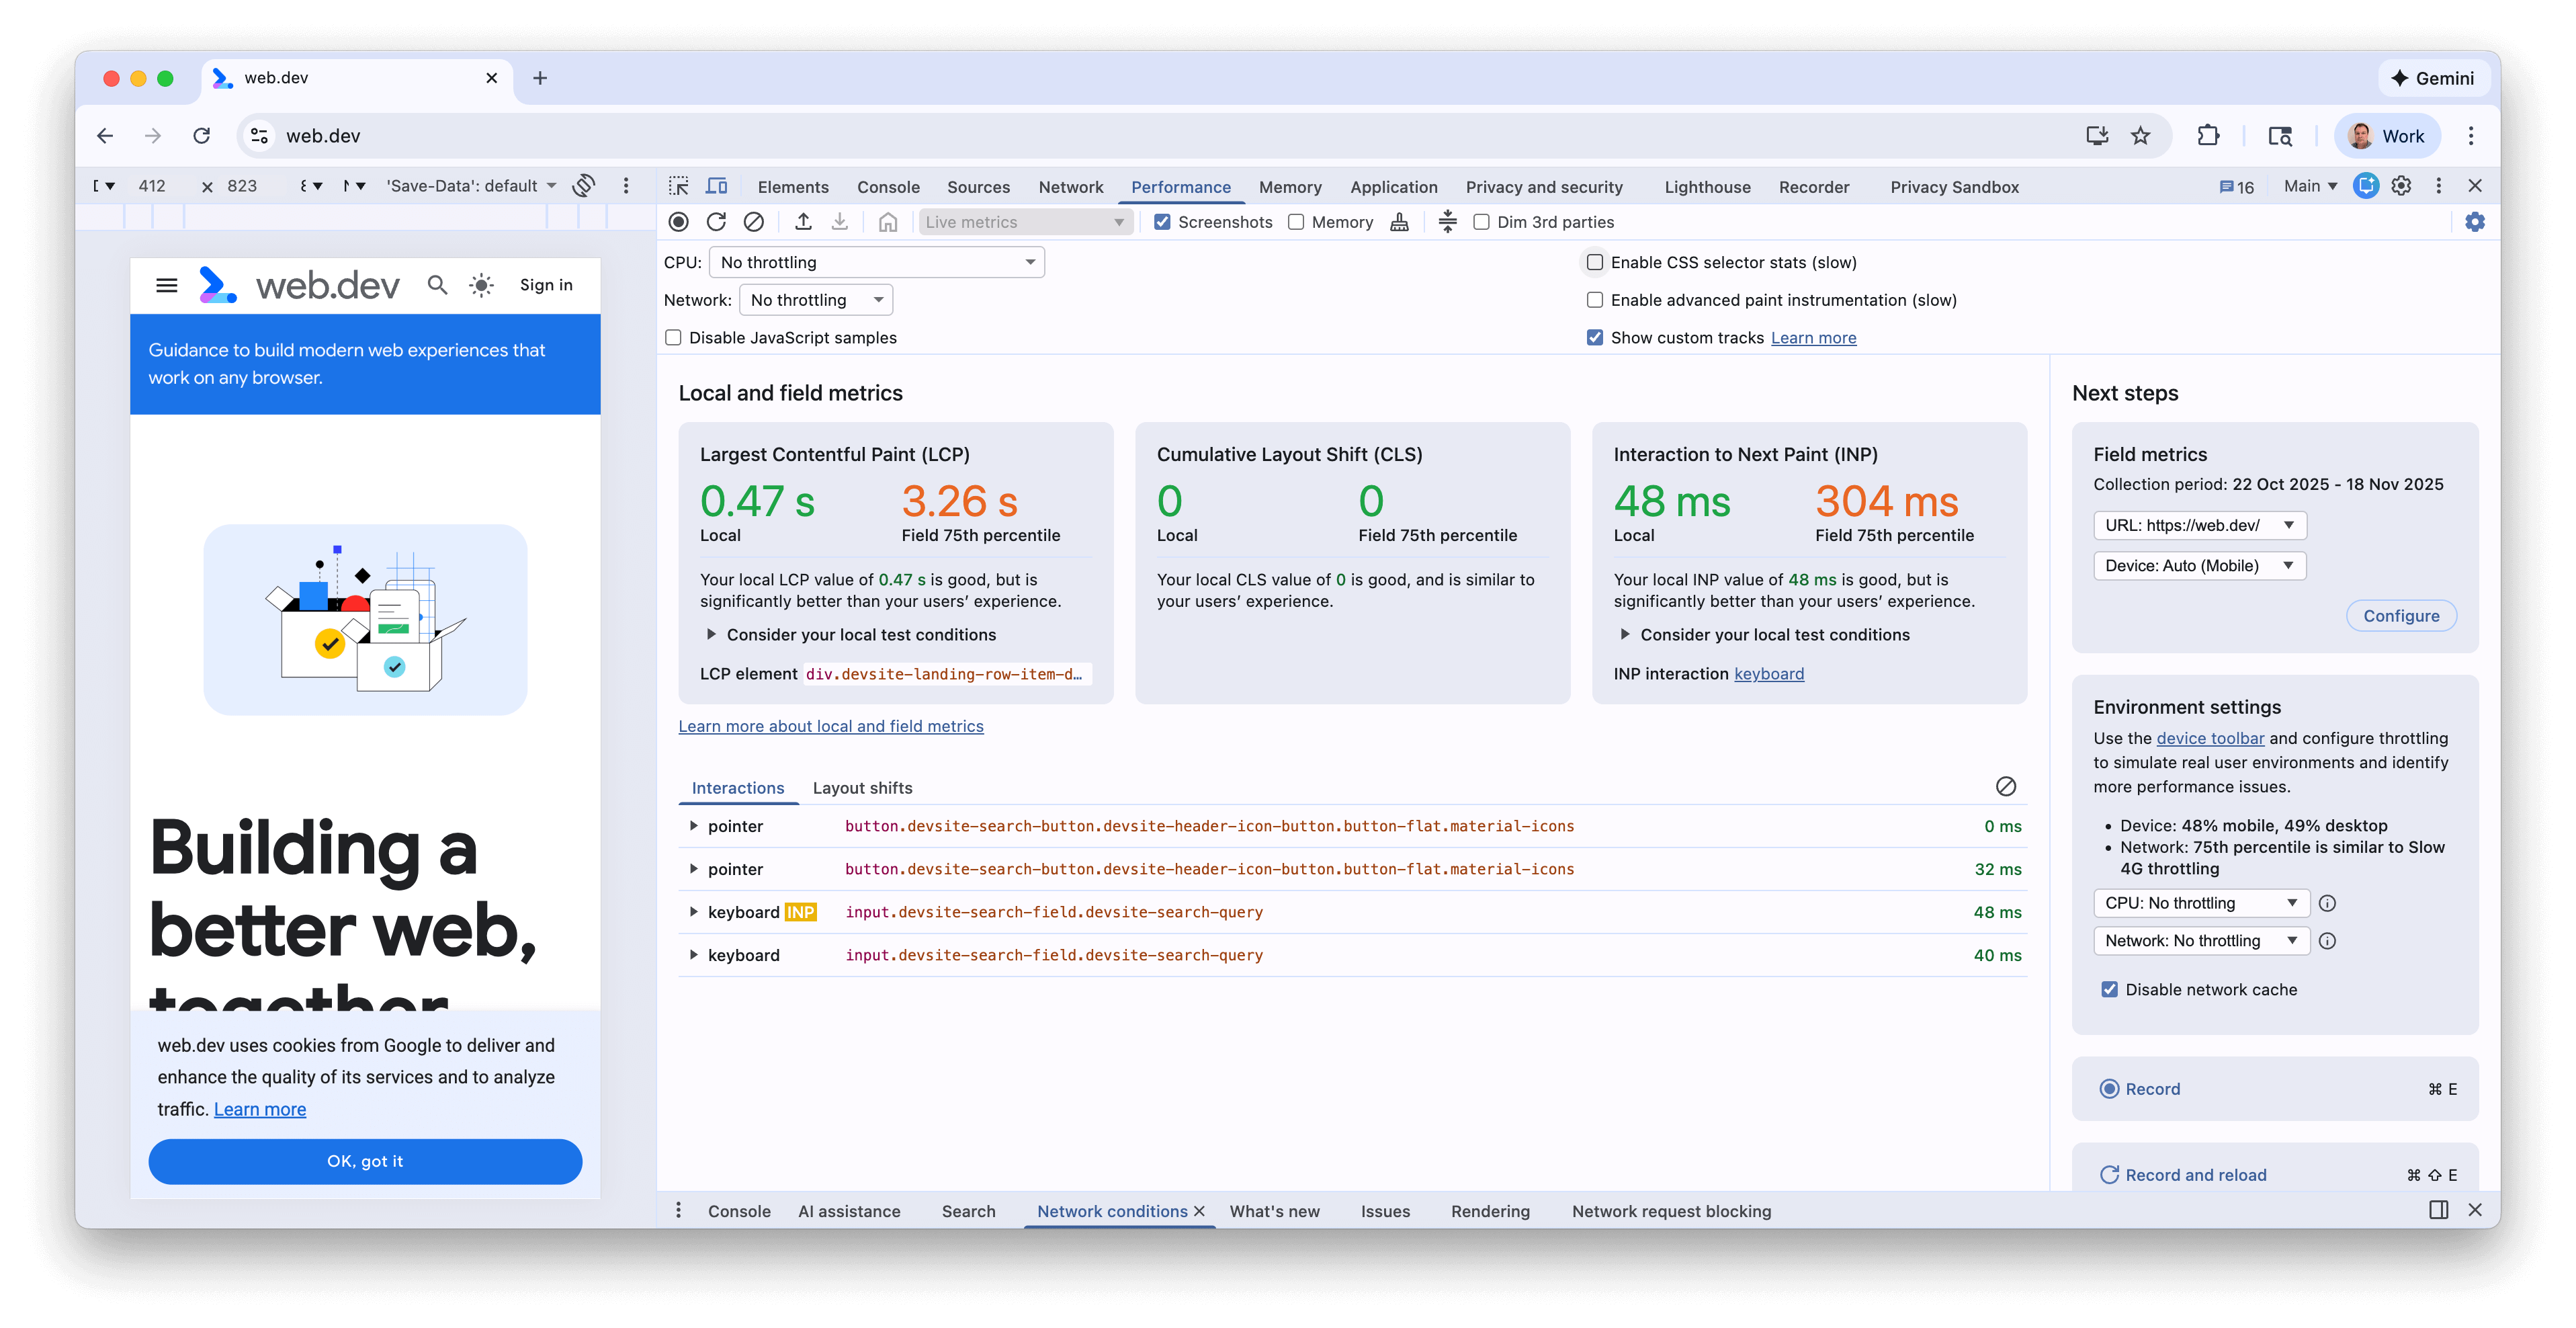
The metrics will update as you interact with the page and navigate to new pages. This is a good way to identify performance issues—particularly for INP and CLS if they only appear under certain circumstances. Once a performance issue is consistently repeated you can then record a trace to get more details to debug the underlying issue.
Live metrics screen features
The Live metrics screen has the following features, in addition to the metrics:
- Field metrics from CrUX when enabled in the Field metrics panel.
- A summary of any notable differences between the local and field metrics.
- The LCP element, which can be hovered to highlight this on the page.
- Details of the CLS cluster and INP type
- More detail on hovering the metrics (for example LCP and INP subparts, and field histograms)
- An Interactions and Layout shifts panels recording the history or interactions and layout shifts.
- A Field metrics panel where the CrUX data can be switched on, details of the time period of that data, ability to switch between origin and URL data (where available) and between desktop and mobile data.
- An environment settings panel with guidance of which device, CPU and Network throttling to use, based on CrUX data.
For more details see the Monitor your local and real-user Core Web Vitals performance in DevTools blog post.
Record performance
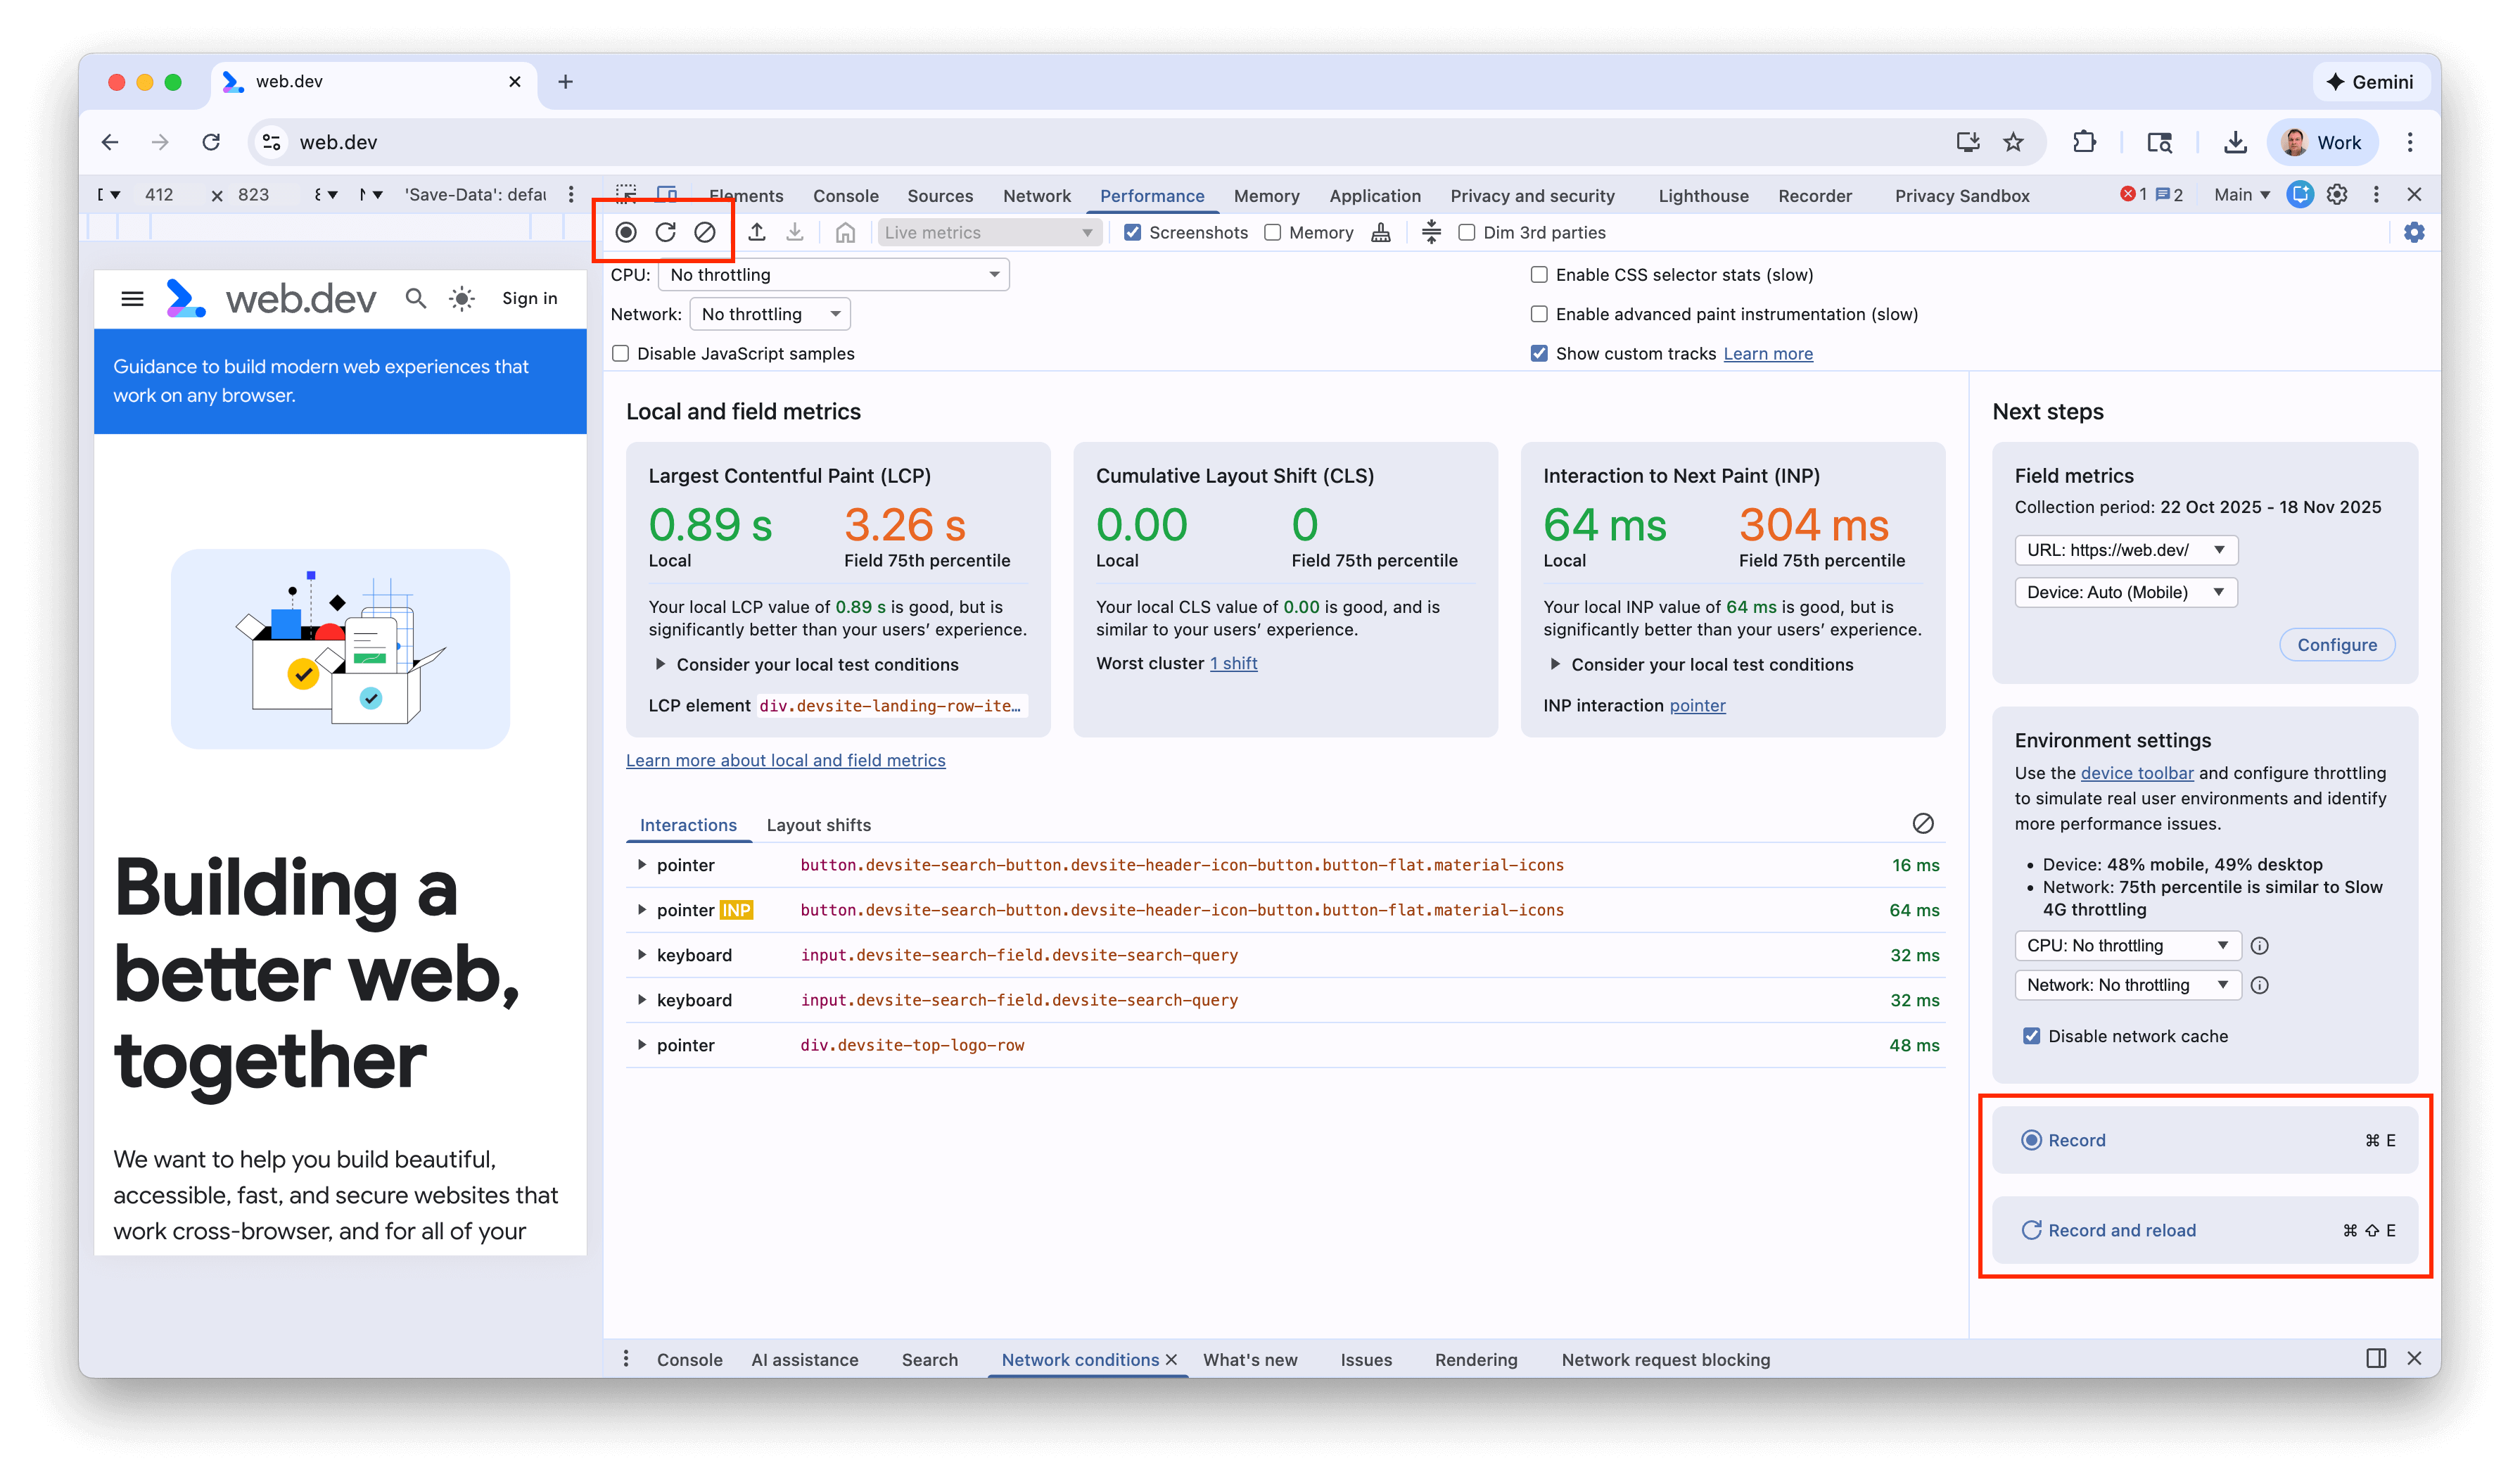
You can record runtime or load performance using the buttons in the top left, or button right of the screen:
Record runtime performance
Record runtime performance when you want to analyze the performance of a page as it's running, as opposed to loading.
- Go to the page that you want to analyze.
- Click the Performance tab in DevTools.
- Click Record
 .
. - Interact with the page. DevTools records all page activity that occurs as a result of your interactions.
- Click Record again or click Stop to stop recording.
Record load performance
Record load performance when you want to analyze the performance of a page as it's loading, as opposed to running.
- Go to the page that you want to analyze.
- Open the Performance panel of DevTools.
- Click Record and reload
 . DevTools first navigates to
 about:blankto clear any remaining screenshots and traces. Then DevTools records performance metrics while the page reloads and then automatically stops the recording a couple seconds after the load finishes.
DevTools automatically zooms in on the portion of the recording where most of the activity occurred.

In this example, the Performance panel shows the activity during a page load.
Capture screenshots while recording
Enable the Screenshots checkbox to capture a screenshot of every frame while recording.

See View a screenshot to learn how to interact with screenshots.
Force garbage collection while recording
While you are recording a page, click Collect garbage to force garbage collection.

Show recording settings
Click Capture settings
![]() to
expose more settings related to how DevTools captures performance recordings.
to
expose more settings related to how DevTools captures performance recordings.

Disable JavaScript samples
By default, the Main track of a recording displays detailed call stacks of JavaScript functions that were called during the recording. To disable these call stacks:
- Open the Capture settings
 menu. See Show recording settings.
 - Enable the Disable JavaScript Samples checkbox.
- Take a recording of the page.
The following screenshots show the difference between disabling and enabling JavaScript samples. The Main track of the recording is much shorter when sampling is disabled, because it omits all of the JavaScript call stacks.

This example shows a recording with disabled JS samples.

This example shows a recording with enabled JS samples.
Throttle the network while recording
To throttle the network while recording:
- Open the Capture settings
 menu. See Show recording settings.
 - Set Network to the chosen level of throttling.
In the drop-down menu, the Performance panel may also recommend a default throttling preset or a preset that approximates the experience of your users based on field data.
Throttle the CPU while recording
To throttle the CPU while recording:
- Open the Capture settings
 menu. See Show recording settings.
 - Set CPU to the chosen level of throttling.
Throttling is relative to your computer's capabilities. For example, the 2x slowdown option makes your CPU operate 2 times slower than its usual ability. DevTools can't truly simulate the CPUs of mobile devices, because the architecture of mobile devices is very different from that of desktops and laptops.
In the drop-down menu, the Performance panel may also recommend a default throttling preset or a preset that approximates the experience of your users based on field data.
Enable CSS selector stats
To view the statistics of your CSS rule selectors during long-running Recalculate Style events:
- Open the Capture settings
 menu. See Show recording settings.
 - Check the Enable CSS selector stats checkbox.
For more details, see how to Analyze CSS selector performance during Recalculate Style events.
Enable advanced paint instrumentation
To view detailed paint instrumentation:
- Open the Capture settings menu. See Show recording settings.
- Check the Enable advanced paint instrumentation checkbox.
To learn how to interact with the paint information, see View layers and View paint profiler.
Show Custom Tracks
Enables custom tracks which can be customized further using the DevTools Extensibility API.
Clear the previous recording
After making a recording, press Clear recording
![]() to clear that recording from the Performance panel.
to clear that recording from the Performance panel.

Analyze a performance recording
After you record runtime performance or record load performance, the Performance panel provides a lot of data for analyzing the performance of what just happened.
Annotate a recording and share it
See Annotate and share your performance findings.
Get actionable insights
The Performance panel includes performance insights also surfaced in Lighthouse reports. These insights can suggest ways to improve performance and provide guided analysis on the following performance issues such as LCP and INP subparts, LCP request discovery issues, third parties, as well as legacy and duplicated JavaScript resources. For a complete list see the Performance Insights documentation.
The insights pass when there's no detected issues. The Insights tab lists them under the collapsed Passed insights section at the bottom. The insights that didn't pass are listed in their own dedicated sections.
To make use of insights:
- Make a performance recording.
- In the left sidebar of the Performance panel, open the Insights tab, expand different sections, and hover over and click items. The Performance panel will highlight the corresponding events in the trace.
Navigate the recording
To help you navigate, as you hover over performance trace, the Performance panel does the following:
- Shows you a vertical marker that spans the entire performance trace when you hover over the Timeline overview.
- Highlights a range in the Timeline overview when you hover over items in the Main track.
To closely inspect your performance recording, you can select a portion of a recording, scroll a long flame chart, zoom in and out, and use breadcrumbs to jump between zoom levels.
Use keyboard shortcuts to navigate
To use keyboard shortcuts to quickly navigate the recording, first, choose your preferred style of keyboard navigation.
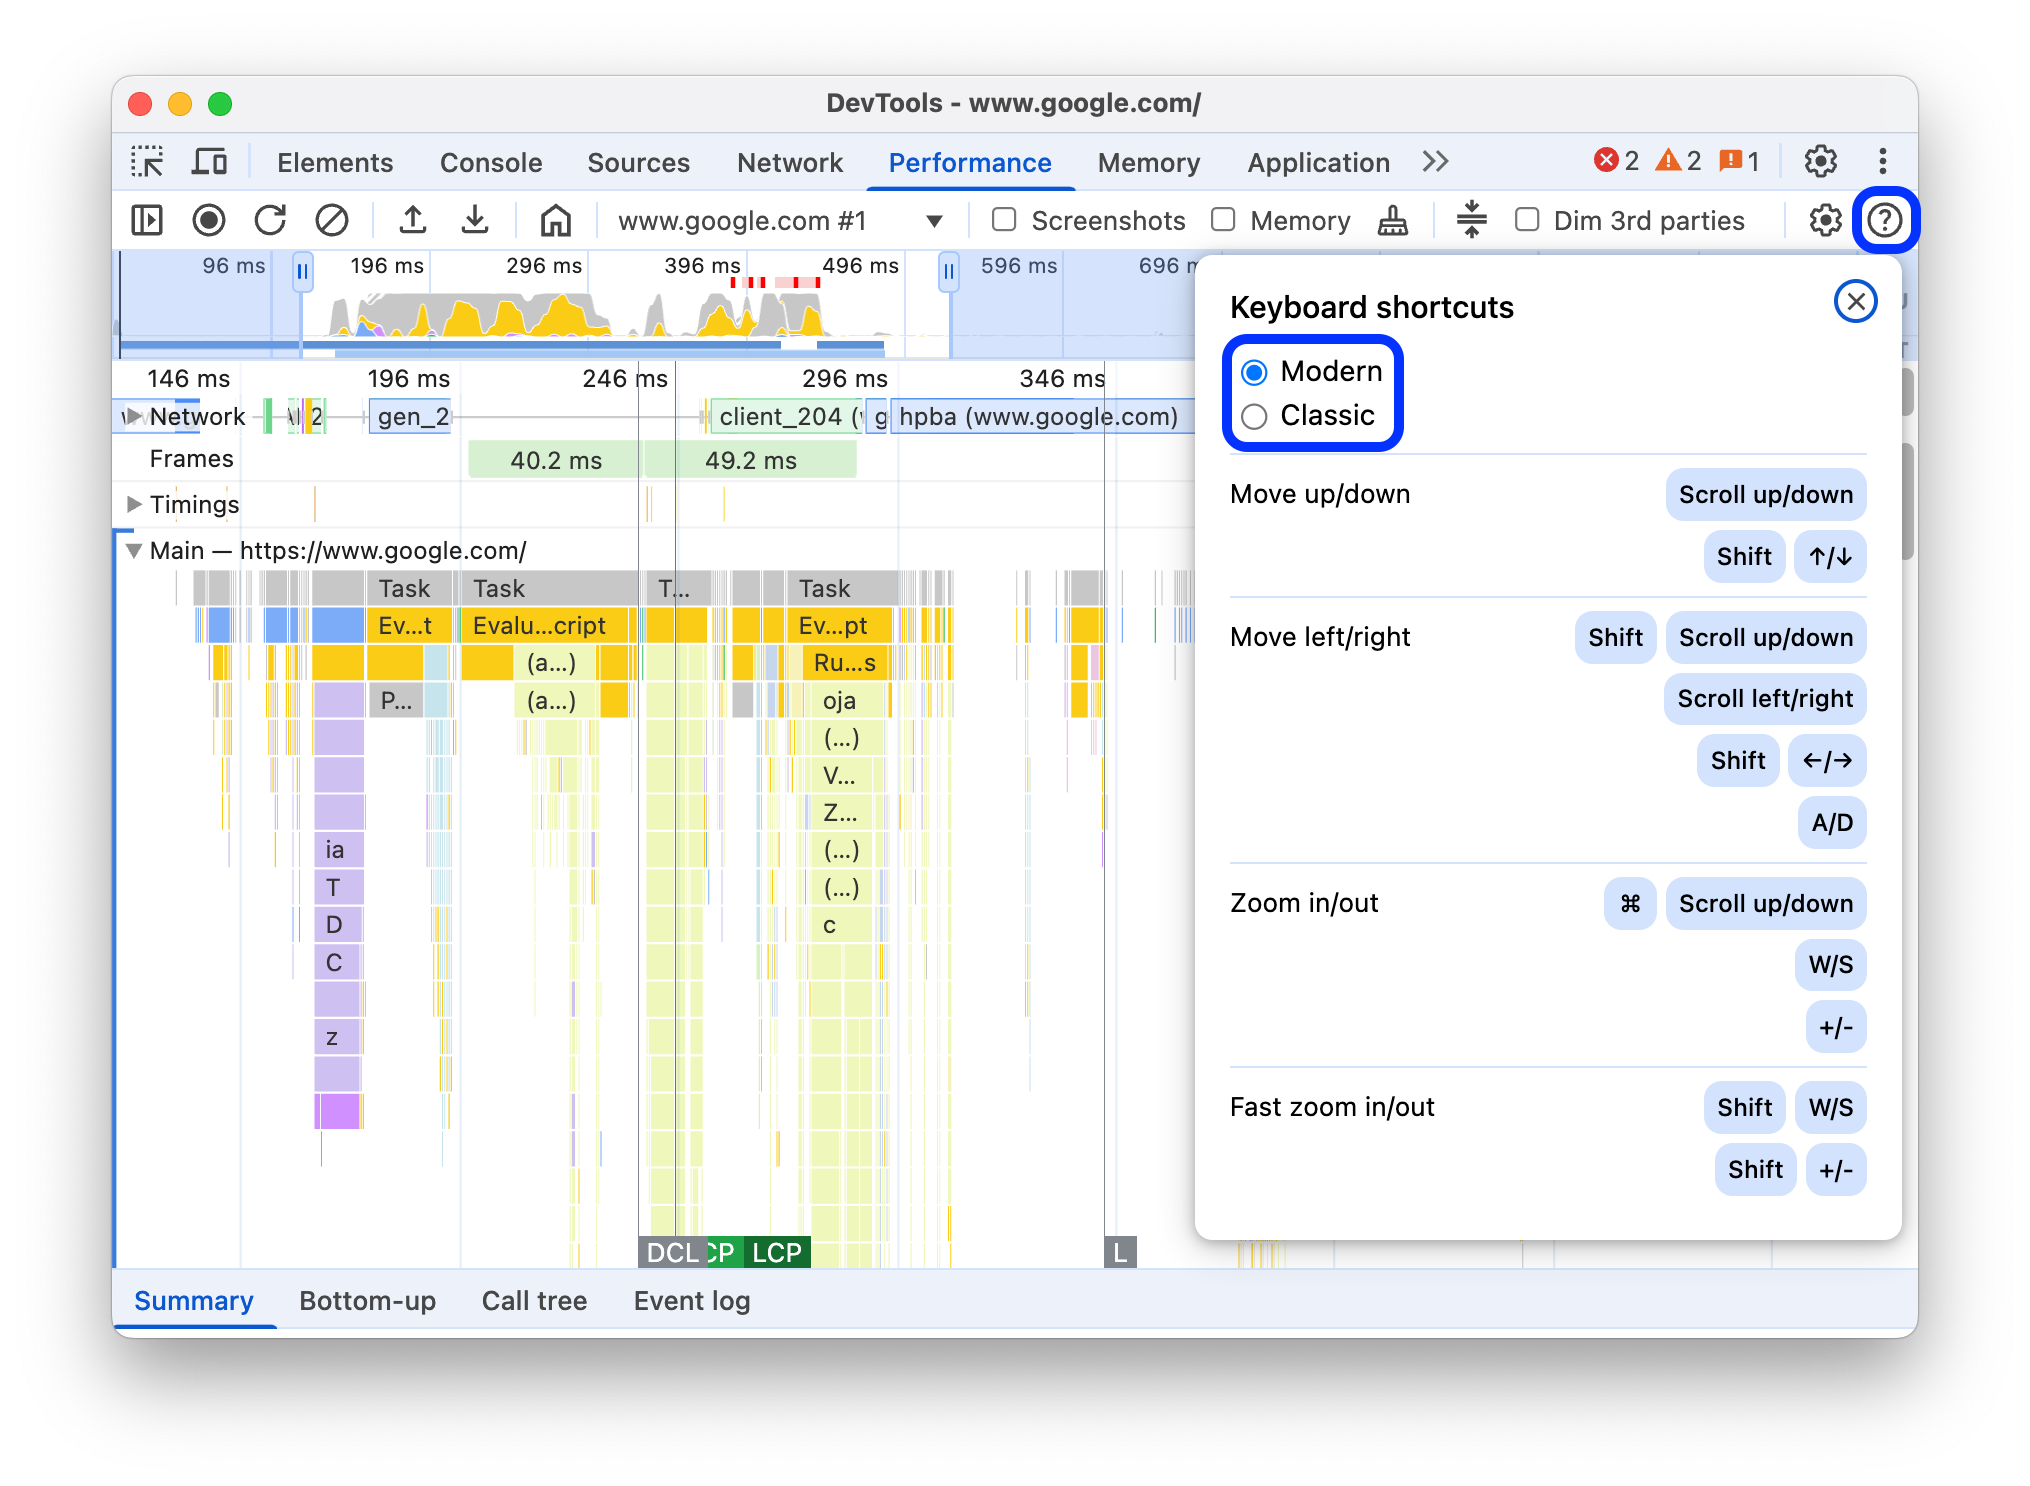
In the top-right corner of the panel, click Show shortcuts and select one of the following:
- Classic: Zoom with mouse wheel (touchpad up or down) and vertical scroll with Shift + mouse wheel.
- Modern: Vertical scroll with mouse wheel, horizontal scroll with Shift + mouse wheel, and zoom with Command/Control + mouse wheel.
The shortcuts dialog also provides you with a cheatsheet of the available shortcuts.
Select a portion of the recording
Under the action bar of the Performance panel and at the top of the recording, you can see the Timeline overview section with the CPU and NET charts.

To select a portion of a recording, click and hold, then drag left or right across the Timeline overview.
To select a portion using the keyboard:
- Focus the Main track or any of its neighbors.
- Use the W, A, S, D keys to zoom in, move left, zoom out, and move right, respectively.
To select a portion using a trackpad:
- Hover over the Timeline overview section or any of the tracks (Main and its neighbors).
- Using two fingers, swipe up to zoom out, swipe left to move left, swipe down to zoom in, and swipe right to move right.
Create breadcrumbs and jump between zoom levels
The Timeline overview lets you create multiple nested breadcrumbs in succession, increasing zoom levels, and then jump freely between zoom levels.
To create and use breadcrumbs:
- In Timeline overview, select a portion of the recording.
- Hover over the selection and click the N ms button. The selection expands to fill the Timeline overview. A chain of breadcrumbs starts building at top of the Timeline overview.
- Repeat the previous two steps to create another nested breadcrumb. You can continue to nest breadcrumbs as long as the selection range is greater than 5 milliseconds.
- To jump to a chosen zoom level, click the corresponding breadcrumb in the chain at top of the Timeline overview.
To remove the childs of a breadcrumb, right-click the parent breadcrumb and select Remove child breadcrumbs.
Scroll a long flame chart
To scroll a long flame chart in the Main track or any of its neighbors, click and hold, then drag in any direction until what you are looking for comes into view.
Ignore irrelevant scripts in the flame chart
To better focus on your code, you can add irrelevant scripts to ignore list.
To ignore scripts, do one of the following:
- Click Show ignore list settings dialog in the top action bar and type a regular expression in the input field. The flame chart will apply the new rule as you type.
- Right-click a script and select Add script to ignore list. The Performance panel adds this script to the list in the Show ignore list settings dialog.
The panel will automatically collapse excessive nesting for such scripts and mark them as On ignore list (REGULAR_EXPRESSION).
In the Show ignore list settings dialog, you can turn the ignore list rules on and off.
To remove a script from ignore list, right-click it in the flame chart and select Remove script from ignore list or hover over it in the Show ignore list settings dialog and click Remove.
DevTools saves the ignore list rules you add in Settings > Ignore list.
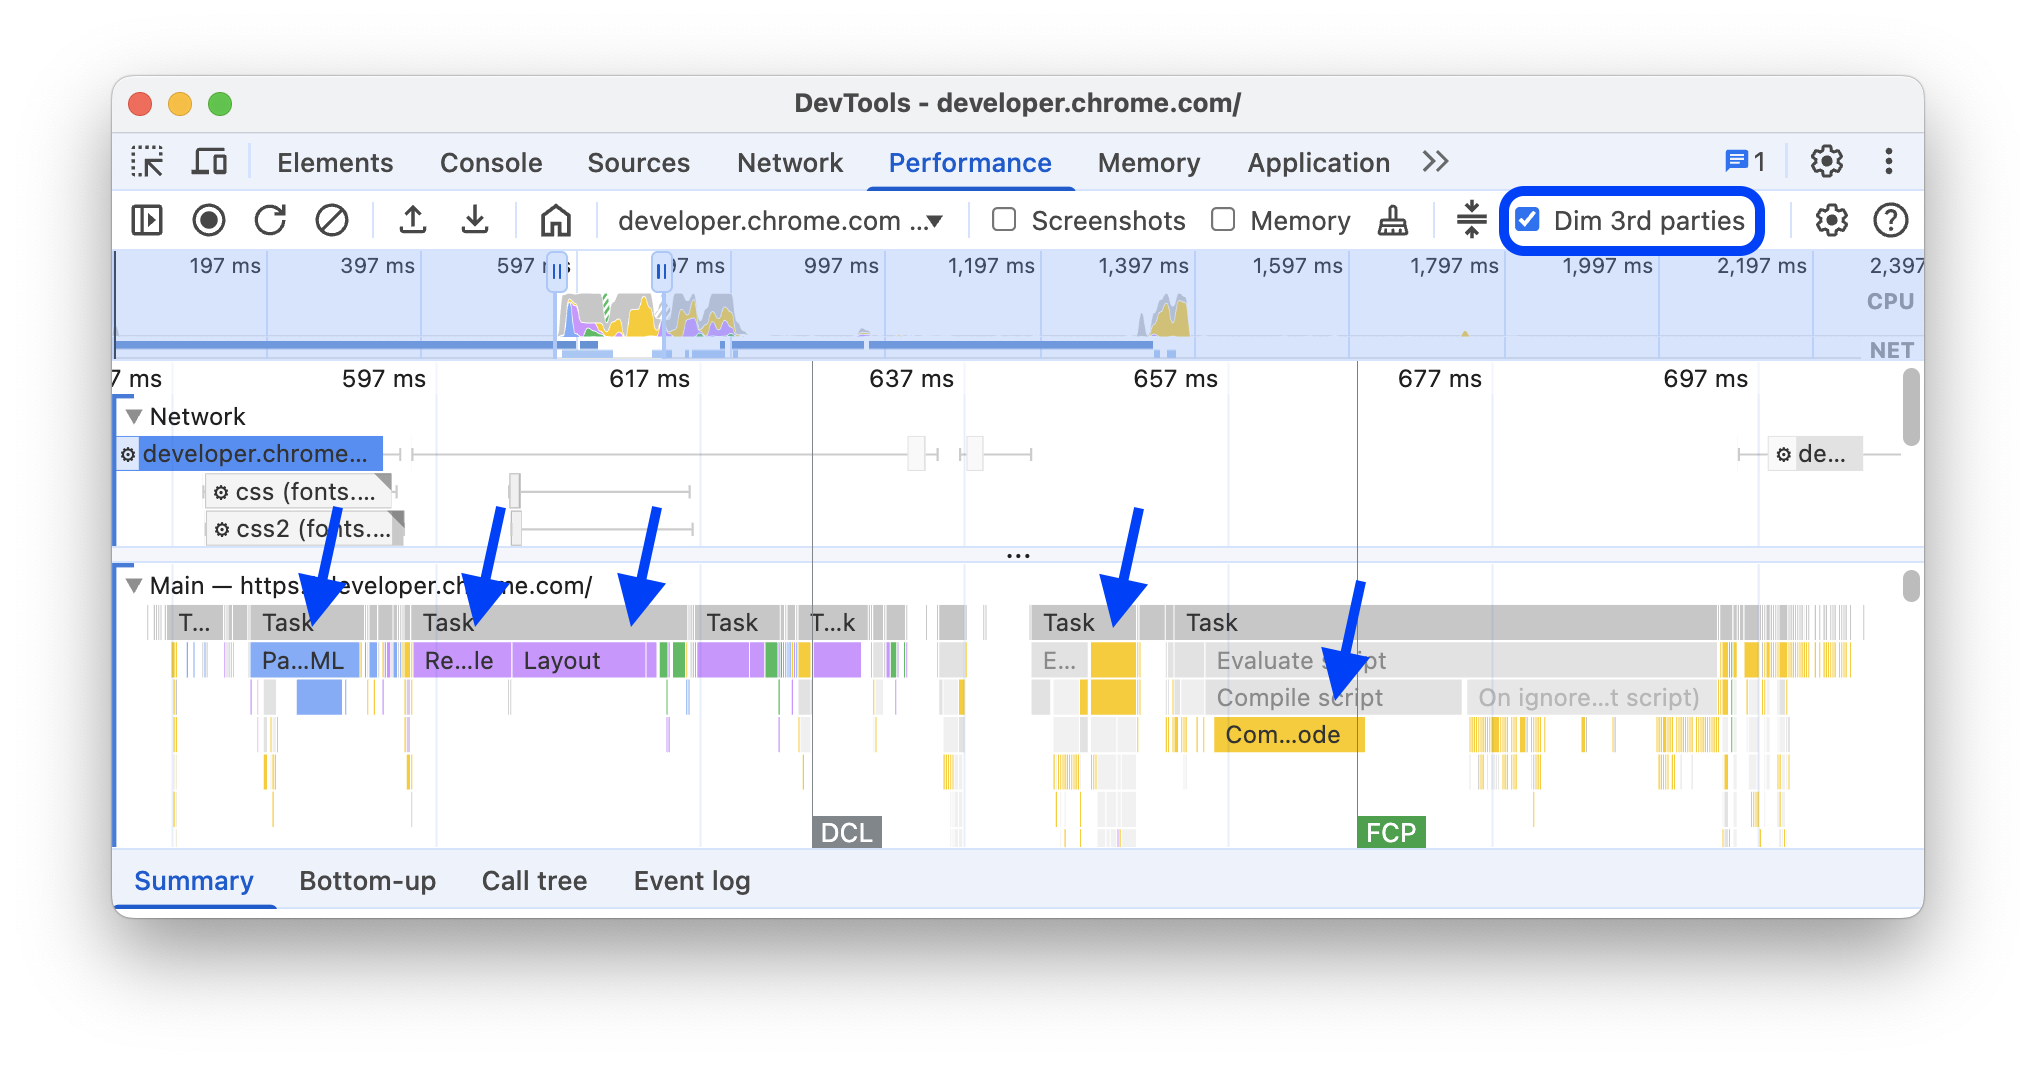
Additionally, to focus on first-party scripts only, check Dim 3rd parties. The Performance panel will gray out third-party scripts.
Search activities
You can search across the activities in the Main track and requests in the Network track.
To open a search box at the bottom of the Performance panel, press:
- macOS: Command+F
- Windows, Linux: Control+F

This example shows a regular expression in the search box at the bottom that finds any activity that begins with E.
To cycle through activities that match your query:
- Click Previous or Next buttons.
- Press Shift+Enter to select the previous or Enter to select the next.
The Performance panel shows a tooltip over the activity selected in the search box.
To modify query settings:
- Click Match case to make the query case sensitive.
- Click Regular expression to use a regular expression in your query.
To hide the search box, click Cancel.
Change the order of tracks and hide them
To declutter the performance trace, you can change the order of tracks and hide the irrelevant ones in track configuration mode.
To move and hide tracks:
- To enter the configuration mode, right-click a track name and select Configure tracks.
- Click up or down to move a track up or down. Click to hide it.
- When finished, click Finish configuring tracks at the bottom to exit the configuration mode.
Watch the video to see this workflow in action.
The Performance panel saves track configuration for new traces but not in next DevTools sessions.
View main thread activity
Use the Main track to view activity that occurred on the page's main thread.

Click an event to view more information about it in the Summary tab, including but not limited to: duration (and self duration), link to the corresponding line in the source script, origin URL (with an entity name, if known) stack trace, if any, and timings breakdown in a pie chart.
The Performance panel outlines the selected event in blue.

This example shows more information about the get function call event in the Summary tab.
Distinguish between first- and third-party events
Excessive reliance on third-party party code can negatively impact load performance. The Performance panel can help you visually distinguish between first- and third-party events in the trace, so you may make a more informed decision on reducing or deferring loading of third-party code to prioritize your page's content.
To focus only on the performance of first-party code:
- Make sure that nothing is selected in the performance trace or in the Insights tab. To do so, click an empty space in the trace.
- Check Dim 3rd parties in the action bar at the top. The Performance panel grays out third-party-related events from the performance trace and leaves only the first-party highlighted.
Highlight events with the '1st / 3rd party' table
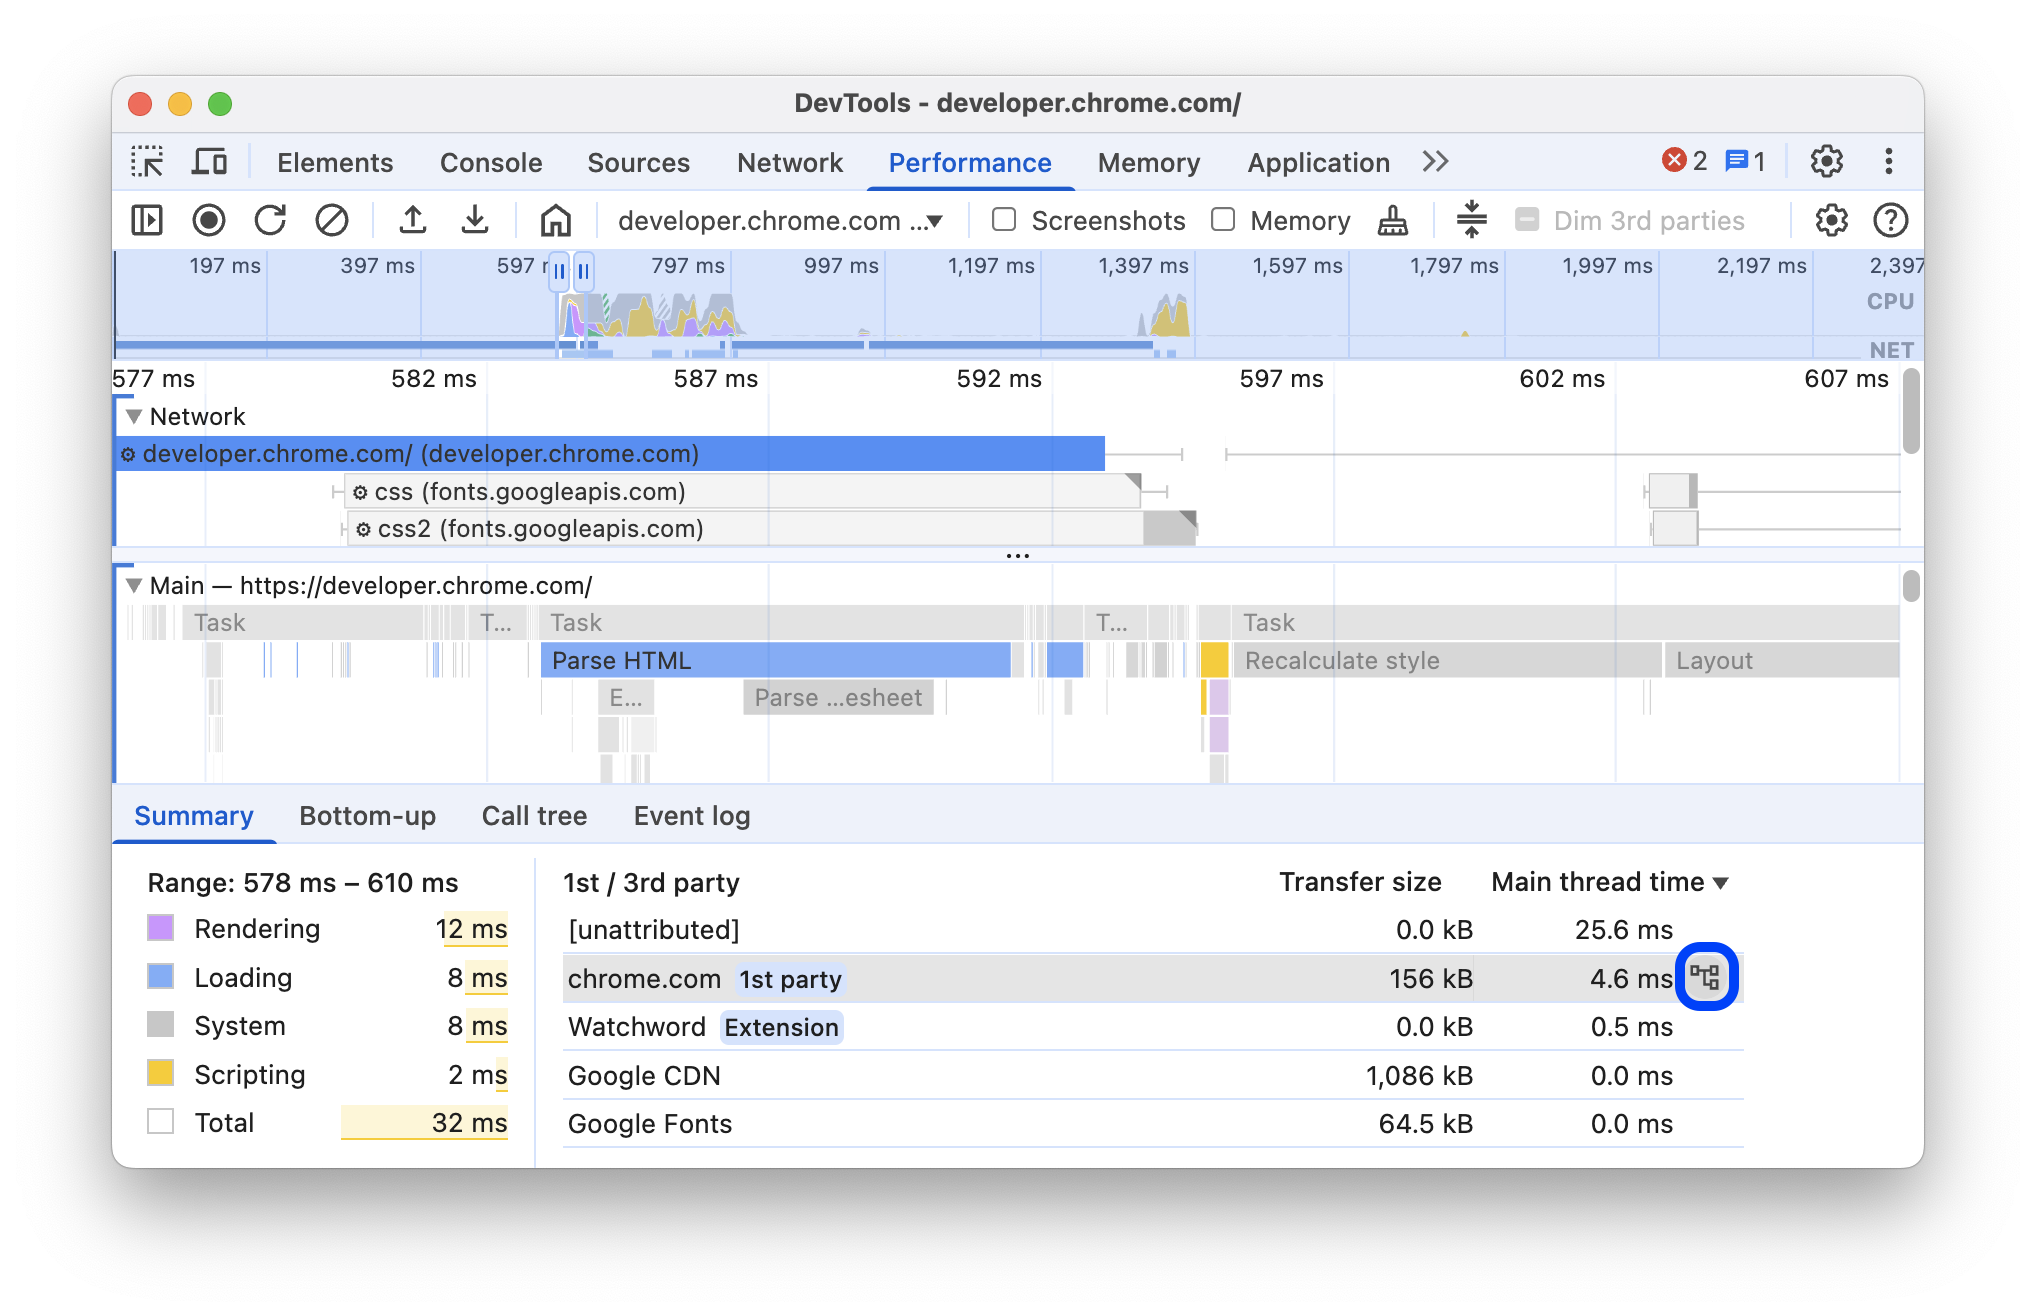
Within a selected range on the Timeline overview and when none of the events are selected, the Summary tab shows a 1st / 3rd party table that lists the respective transfer sizes and main thread times of the following:
- First-party entity marked with a
1st partybadge. - All detected third-party entities in the selected range, unmarked.
- Extensions marked with
Extensionbadges. - Other
[unattributed]entities.
To see related events highlighted in the trace and the rest grayed out, hover over the entities in the table. To leave an entity's events highlighted, select it in the table. To remove the highlighting, click any empty space in the trace.
To open activities grouped by this entity in the Bottom-up tab, hover over the entity in the table and click Bottom-up next to it.
Read the flame chart
The Performance panel represents main thread activity in a flame chart. The x-axis represents the recording over time. The y-axis represents the call stack. The events on top cause the events below.

This example shows a flame chart in the Main track. A click event caused an anonymous function call. This function, in turn, called onEndpointClick_, which called handleClick_, and so on.
The Performance panel assigns scripts random colors to break up the flame chart and make it more readable. In the earlier example, function calls from one script are colored light blue. Calls from another script are colored light pink. The darker yellow represents scripting activity, and the purple event represents rendering activity. These darker yellow and purple events are consistent across all recordings.
Long tasks are also highlighted with a red triangle, and with the part over 50 milliseconds shaded in red:

In this example, the task took more than 400 milliseconds, so the part representing the last 350 milliseconds is shaded in red, while the initial 50 milliseconds is not.
Additionally, the Main track shows information on CPU profiles started and stopped with profile() and profileEnd() console functions.
To hide the detailed flame chart of JavaScript calls, see Disable JavaScript samples. When JS samples are disabled, you see only the high-level events such as Event (click) and Function Call.
Track event initiators
The Main track can show arrows that connect the following initiators and the events they caused:
- Style or layout invalidation -> Recalculate styles or Layout
- Request Animation Frame -> Animation Frame Fired
- Request Idle Callback -> Fire Idle Callback
- Install Timer -> Timer Fired
- Create WebSocket -> Send... and Receive WebSocket Handshake or Destroy WebSocket
- Schedule postTask -> Fire postTask or Abort postTask
To see the arrows, find either an initiator or the event it caused in the flame chart and select it.

When selected, the Summary tab shows Initiator for links for initiators and Initiated by links for the events they caused. Click them to jump between the corresponding events.

Hide functions and their children in the flame chart
To declutter the flame chart in the Main thread, you can hide selected functions or their children:
In the Main track, right-click a function and choose one of the following options or press the corresponding shortcut:
- Hide function (
H) - Hide children (
C) - Hide repeating children (
R) - Reset children (
U) - Reset trace (
T) - Add script to ignore list (
I)

A drop-down button appears next to the function name with hidden children.
- Hide function (
To see the number of hidden children, hover over the drop-down button.

To reset a function with hidden children or the whole flame chart, select the function and press
Uor right-click any function and select Reset trace respectively.
Ignore scripts in the flame chart
To add a script to the ignore list, right-click a script in the chart and select Add script to ignore list.

The chart collapses ignored scripts, marks them as On ignore list, and adds them to the Custom exclusion rules in Settings > Ignore list. Ignored scripts are saved until you remove them either from the trace or from the Custom exclusion rules.

View activities in a table
After recording a page, you don't need to rely solely on the Main track to analyze activities. DevTools also provides three tabular views for analyzing activities. Each view gives you a different perspective on the activities:
- When you want to view the root activities that cause the most work, use the Call tree tab.
- When you want to view the activities where the most time was directly spent, use the Bottom-up tab.
- When you want to view the activities in the order in which they occurred during the recording, use the Event log tab.
You can click an item in any of the three tables (and in the 1st / 3rd party table in the Summary tab) to keep the corresponding events highlighted in the trace and dim the rest as you browse the performance trace.
To help you find what you are looking for faster, all three tabs have buttons for advanced filtering next to the Filter bar:
- Match case.
- Regular expression.
- Match whole word.

Each tabular view in the Performance panel shows links for activities such as functions calls. To help you debug, DevTools finds the corresponding function declarations in source files. Additionally, if the appropriate source maps are present and enabled, DevTools automatically finds the original files.
Click a link to open a source file in the Sources panel.

Root activities
Here's an explanation of the root activities concept that's mentioned in the Call tree tab, Bottom-up tab, and Event log sections.
Root activities are those which cause the browser to do some work. For example, when you click a
page, the browser fires an Event activity as the root activity. That Event then might cause a handler
to execute.
In the Main track's flame chart, root activities are at the top of the chart. In the Call Tree and Event log tabs, root activities are the top-level items.
See The Call Tree tab for an example of root activities.
The Call tree tab
Use the Call tree tab to view which root activities cause the most work.
The Call tree tab only displays activities during the selected portion of the recording. See Select a portion of a recording to learn how to select portions.

In this example, the top-level of items in the Activity column, such as Event, Paint, and
Composite Layers are root activities. The nesting represents the call stack. In
this example, the Event caused the Function Call, which caused button.addEventListener, which caused b,
and so on.
Self Time represents the time directly spent in that activity. Total Time represents the time spent in that activity or any of its children.
Click Self Time, Total Time, or Activity to sort the table by that column.
Use the Filter box to filter events by activity name.
By default the Grouping menu is set to No Grouping. Use the Grouping menu to sort the activity table based on various criteria.
The Bottom-up tab
Use the Bottom-up tab to view which activities directly took up the most time in aggregate.
The Bottom-up tab only displays activities during the selected portion of the recording. See Select a portion of a recording to learn how to select portions.
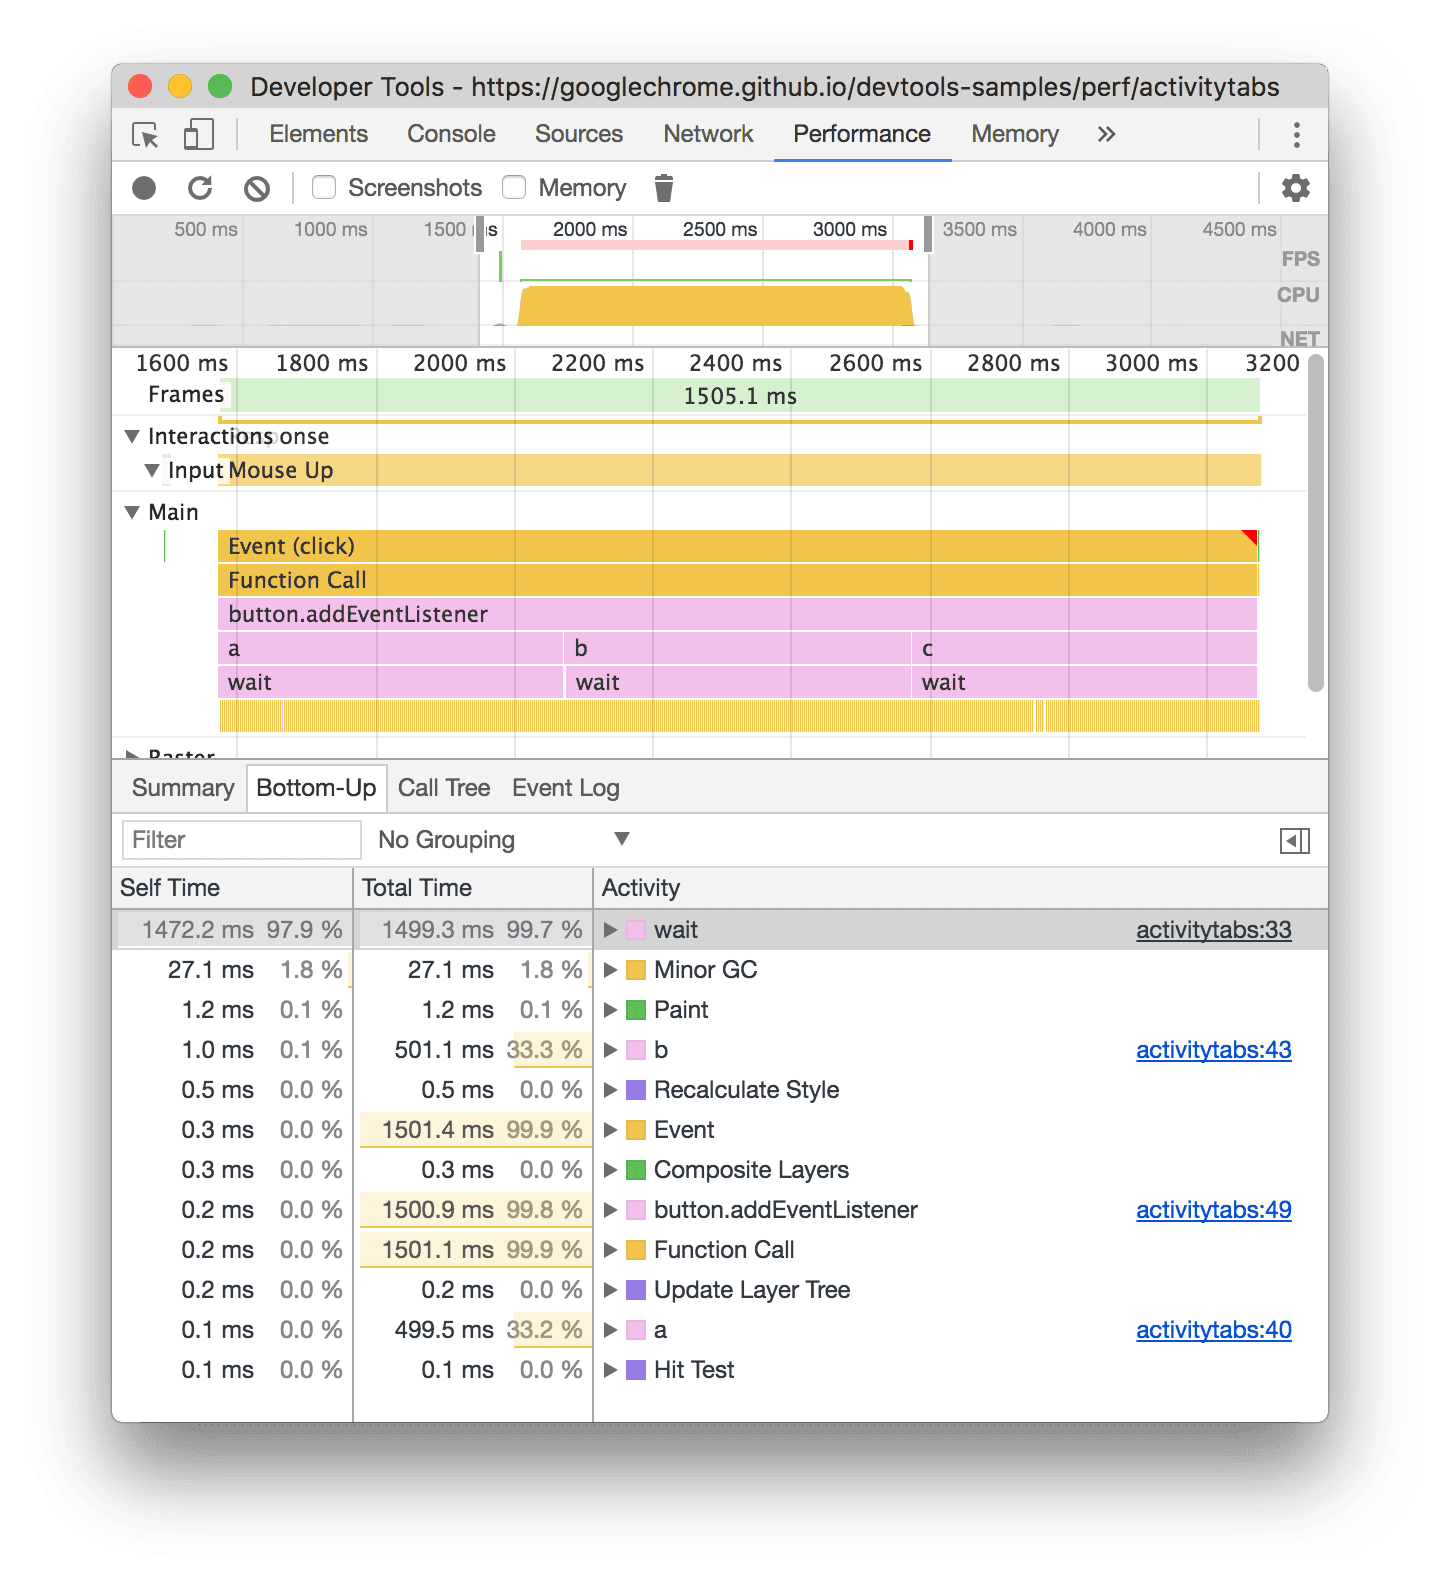
In the Main track flame chart of this example, you can see that almost all of the
time was spent executing the three calls to wait(). Accordingly, the top activity in the
Bottom-up tab is wait. In the flame chart, the yellow below the
calls to wait are actually thousands of Minor GC calls. Accordingly, you can see that in the
Bottom-up tab, the next most expensive activity is Minor GC.
The Self Time column represents the aggregated time spent directly in that activity, across all of its occurrences.
The Total Time column represents aggregated time spent in that activity or any of its children.
Heaviest stack table
On the right side of the Call tree or Bottom-up tabs, click Show heaviest stack to reveal the Heaviest stack table.
This table shows you which children of the selected activity took the longest time to execute. Hover over an item in the table to see the corresponding event highlighted in the Main track and the rest dimmed.
This way, you can visually find in the performance trace the nested activities from the call stack that take the most time.
The Event log tab
Use the Event log tab to view activities in the order in which they occurred during the recording.
The Event log tab only displays activities during the selected portion of the recording. See Select a portion of a recording to learn how to select portions.

The Start Time column represents the point at which that activity started, relative to the start
of the recording. The start time of 1573.0 ms for the selected item in this example
means that activity started 1573 ms after the recording started.
The Self Time column represents the time spent directly in that activity.
The Total Time columns represents time spent directly in that activity or in any of its children.
Click Start Time, Self Time, or Total Time to sort the table by that column.
Use the Filter box to filter activities by name.
Use the Duration menu to filter out any activities that took less than 1 ms or 15 ms. By default the Duration menu is set to All, meaning all activities are shown.
Disable the Loading, Scripting, Rendering, or Painting checkboxes to filter out all activities from those categories.
View performance markers
In an overlay with vertical lines across the performance trace, you can see important performance markers, such as:
- First Contentful Paint (FCP)
- Largest Contentful Paint (LCP)
- DOMContentLoaded Event (DCL)
- Onload Event (L)
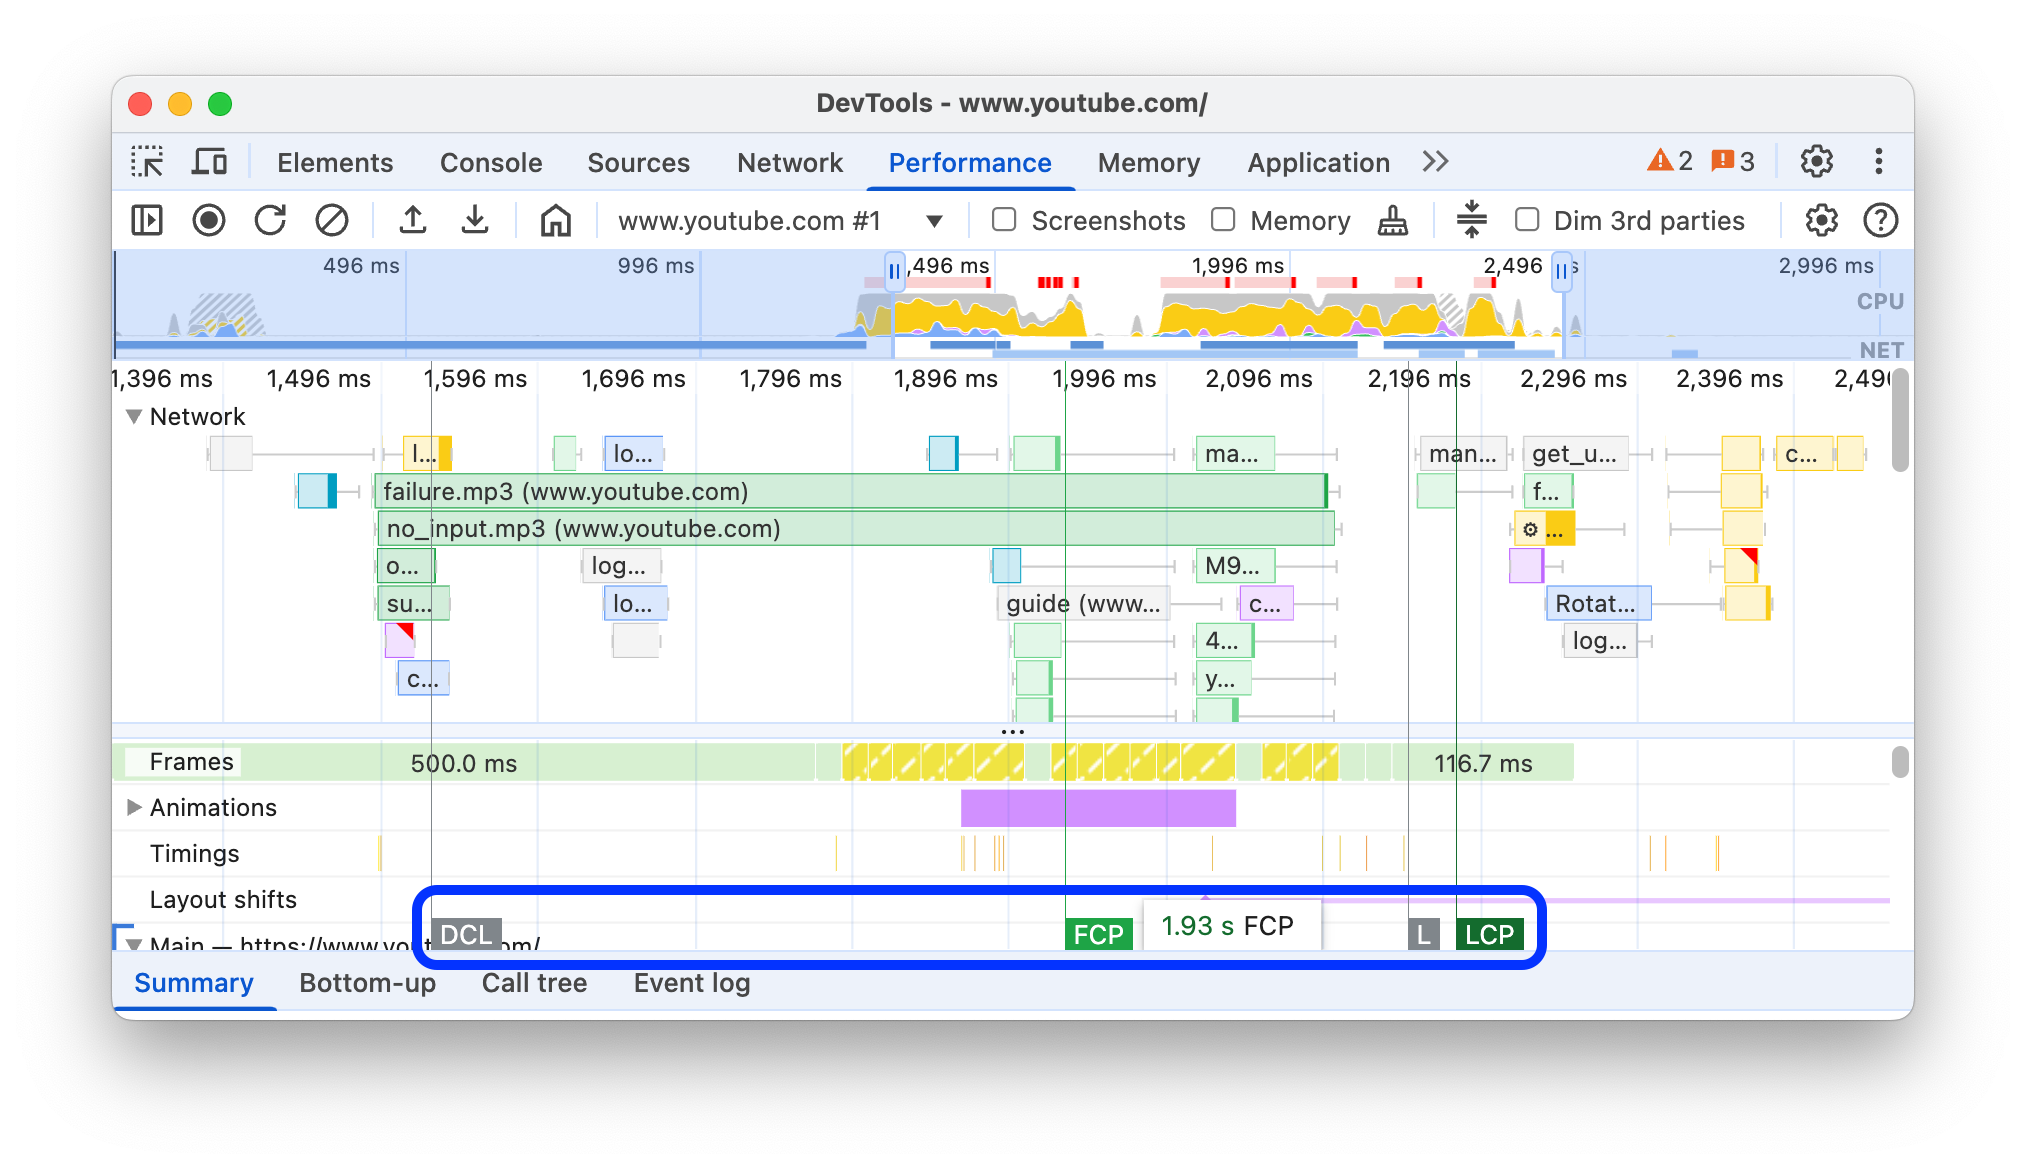
Hover over the marker names at the bottom of the trace to see their timestamp.
View custom timings
On the Timings track, view your custom performance markers such as:
performance.mark()calls. An individual mark with tooltip is shown below at 813.44 ms, labelled Starting to run JavaScript.performance.measure()calls. A yellow span is shown below, labelled Slow Interaction.

Select a marker to see more details in the Summary tab, including its timestamp, total time, self time, and the detail object. For performance.mark() and performance.measure() calls, the tab also shows stack traces.
View interactions
View user interactions on the Interactions track to track down potential responsiveness issues.
To view interactions:
- Open DevTools, for example, on this demo page.
- Open the Performance panel and start a recording.
- Click an element (coffee) and stop the recording.
- Find the Interactions track in the timeline.

In this example, the Interactions track shows the Pointer interaction. Interactions have whiskers that indicate input and presentation delays at processing time boundaries. Hover over the interaction to see a tooltip with input delay, processing time, and presentation delay.
The Interactions track also shows Interaction to Next Paint (INP) warnings for interactions longer than 200 milliseconds in the Summary tab and in a tooltip on hover:

The Interactions track marks the interactions over 200 milliseconds with a red triangle in the top right corner.
View layout shifts
View layout shifts on the Layout shifts track. Shifts are shown as purple diamonds and are grouped in clusters (purple lines) based on their proximity on the timeline.

To highlight an element that caused a layout shift in the viewport, hover over the corresponding diamond.
To see more information about a layout shift or shifts in the Summary tab with timings, scores, elements, and potential culprits, click the corresponding diamond or cluster.
For more information, see Cumulative Layout Shift (CLS).
View animations
View animations on the Animations track. Animations are named as corresponding CSS properties or elements if any, for example, transform or my-element. Non-compositing animations are marked with red triangles in the top right corner.

Select an animation to see more details in the Summary tab, including reasons for compositing failures.
View GPU activity
View GPU activity in the GPU section.

View raster activity
View raster activity in the Thread Pool section.

Analyze frames per second (FPS)
DevTools provides numerous ways to analyze frames per second:
- Use the Frames section to view how long a particular frame took.
- Use the FPS meter for a real time estimate of FPS as the page runs. See View frames per second in real time with the FPS meter.
The Frames section
The Frames section tells you exactly how long a particular frame took.
Hover over a frame to view a tooltip with more information about it.

This example shows a tooltip when you hover over a frame.
The Frames section can show four types of frames:
- Idle frame (white). No changes.
- Frame (green). Rendered as expected and in time.
- Partially presented frame (yellow with a sparse wide dash-line pattern). Chrome did its best to render at least some visual updates in time. For example, in case the work of the main thread of the renderer process (canvas animation) is late but the compositor thread (scrolling) is in time.
- Dropped frame (red with a dense solid-line pattern). Chrome can't render the frame in reasonable time.

This example shows a tooltip when you hover over a partially presented frame.
Click a frame to view even more information about the frame in the Summary tab. DevTools outlines the selected frame in blue.

View network requests
Expand the Network section to view a waterfall of network requests that occurred during the performance recording.

Next to the Network track name, there's a legend with color-coded request types.
Render-blocking requests are marked with a red triangle in the upper right corner.
Hover over a request to see a tooltip with:
- Request's URL and the total time it took to execute it.
- Priority or a change of priority, for example,
Medium -> High. - Whether the request is
Render-blockingor not. - A breakdown of request timings, described later.
When you click a request, the Network track draws an arrow from its initiator to the request.
Additionally, the Performance panel shows you the Summary tab with more information about the request, including but not limited to Initial Priority and (final) Priority fields. If their values differ, the fetch priority of the request has changed during the recording. For more information, see Optimizing resource loading with the Fetch Priority API.
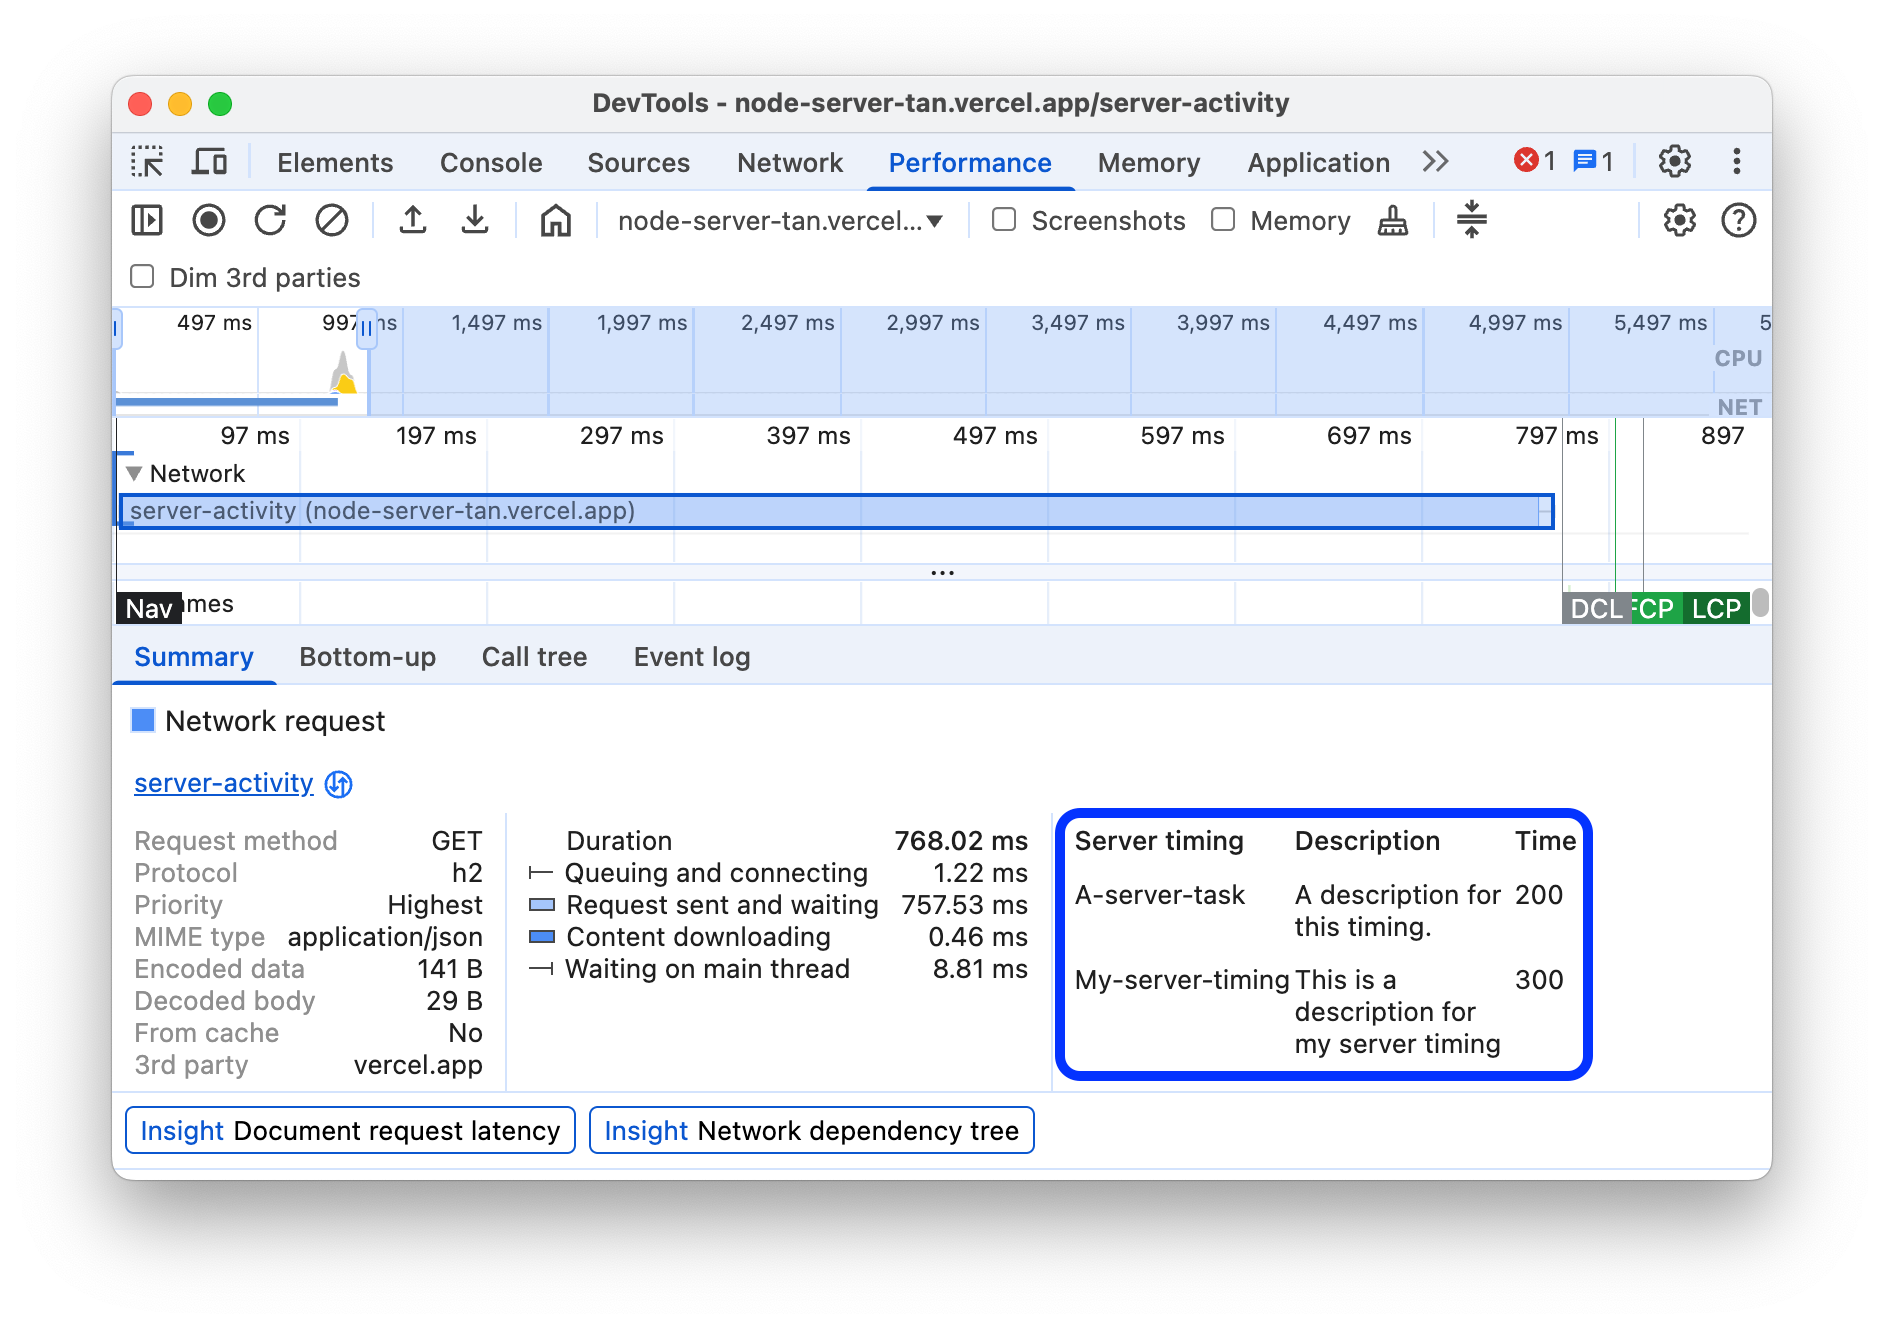
The Summary tab also shows a breakdown of the request's timings.

In this example, the request for www.google.com is represented by a line on the left (|–), a bar in the middle with a dark portion and a light portion, and a line on the right (–|).
If present, the Summary tab also shows a breakdown of server timings for network requests that implement server-side rendering technologies. For these requests, the Performance panel takes the data from the Server-Timing response header.
You can find another timings breakdown in the Network tab. Right-click the request in the Network track or its URL in the Summary tab and click Reveal in Network panel. DevTools takes you to the Network panel and selects the corresponding request. Open its Timing tab.

Here's how these two breakdowns map to each other:
- The left line (
|–) is everything up to theConnection startgroup of events, inclusive. In other words, it's everything beforeRequest Sent. - The light portion of the bar is
Request sentandWaiting for server response. - The dark portion of the bar is
Content download. - The right line (
–|) is the time spent waiting for the main thread. The Network > Timing tab doesn't show it.
View memory metrics
Enable the Memory checkbox to view memory metrics from the last recording.

DevTools displays a new Memory chart, above the Summary tab. There's also a new chart below the NET chart, called HEAP. The HEAP chart provides the same information as the JS Heap line in the Memory chart.

This example shows memory metrics above the Summary tab.
The colored lines on the chart map to the colored checkboxes above the chart. Disable a checkbox to hide that category from the chart.
The chart only displays the region of the recording that is selected. In the earlier example, the Memory chart shows only the memory usage for the start of the recording, up to around the 1000ms mark.
View the duration of a portion of a recording
When analyzing a section like Network or Main, sometimes you need a more precise estimate of how long certain events took. Hold Shift, click and hold, and drag left or right to select a portion of the recording. At the bottom of your selection, DevTools shows how long that portion took.

In this example, the 488.53ms timestamp at the bottom of the selected portion indicates how long
that portion took.
View a screenshot
See Capture screenshots while recording to learn how to enable screenshots.
Hover over the Timeline overview to view a screenshot of how the page looked during that moment of the recording. The Timeline overview is the section that contains the CPU, FPS, and NET charts.

You can also view screenshots by clicking a frame in the Frames section. DevTools displays a small version of the screenshot in the Summary tab.

This example shows the screenshot for the 195.5ms frame in the Summary tab when you click it in the Frames section.
Click the thumbnail in the Summary tab to zoom in on the screenshot.

This example shows a zoomed-in screenshot after you click its thumbnail in the Summary tab.
View layers information
To view advanced layers information about a frame:
- Enable advanced paint instrumentation.
- Select a frame in the Frames section. DevTools displays information about its layers in the new Layers tab, next to the Event log tab.
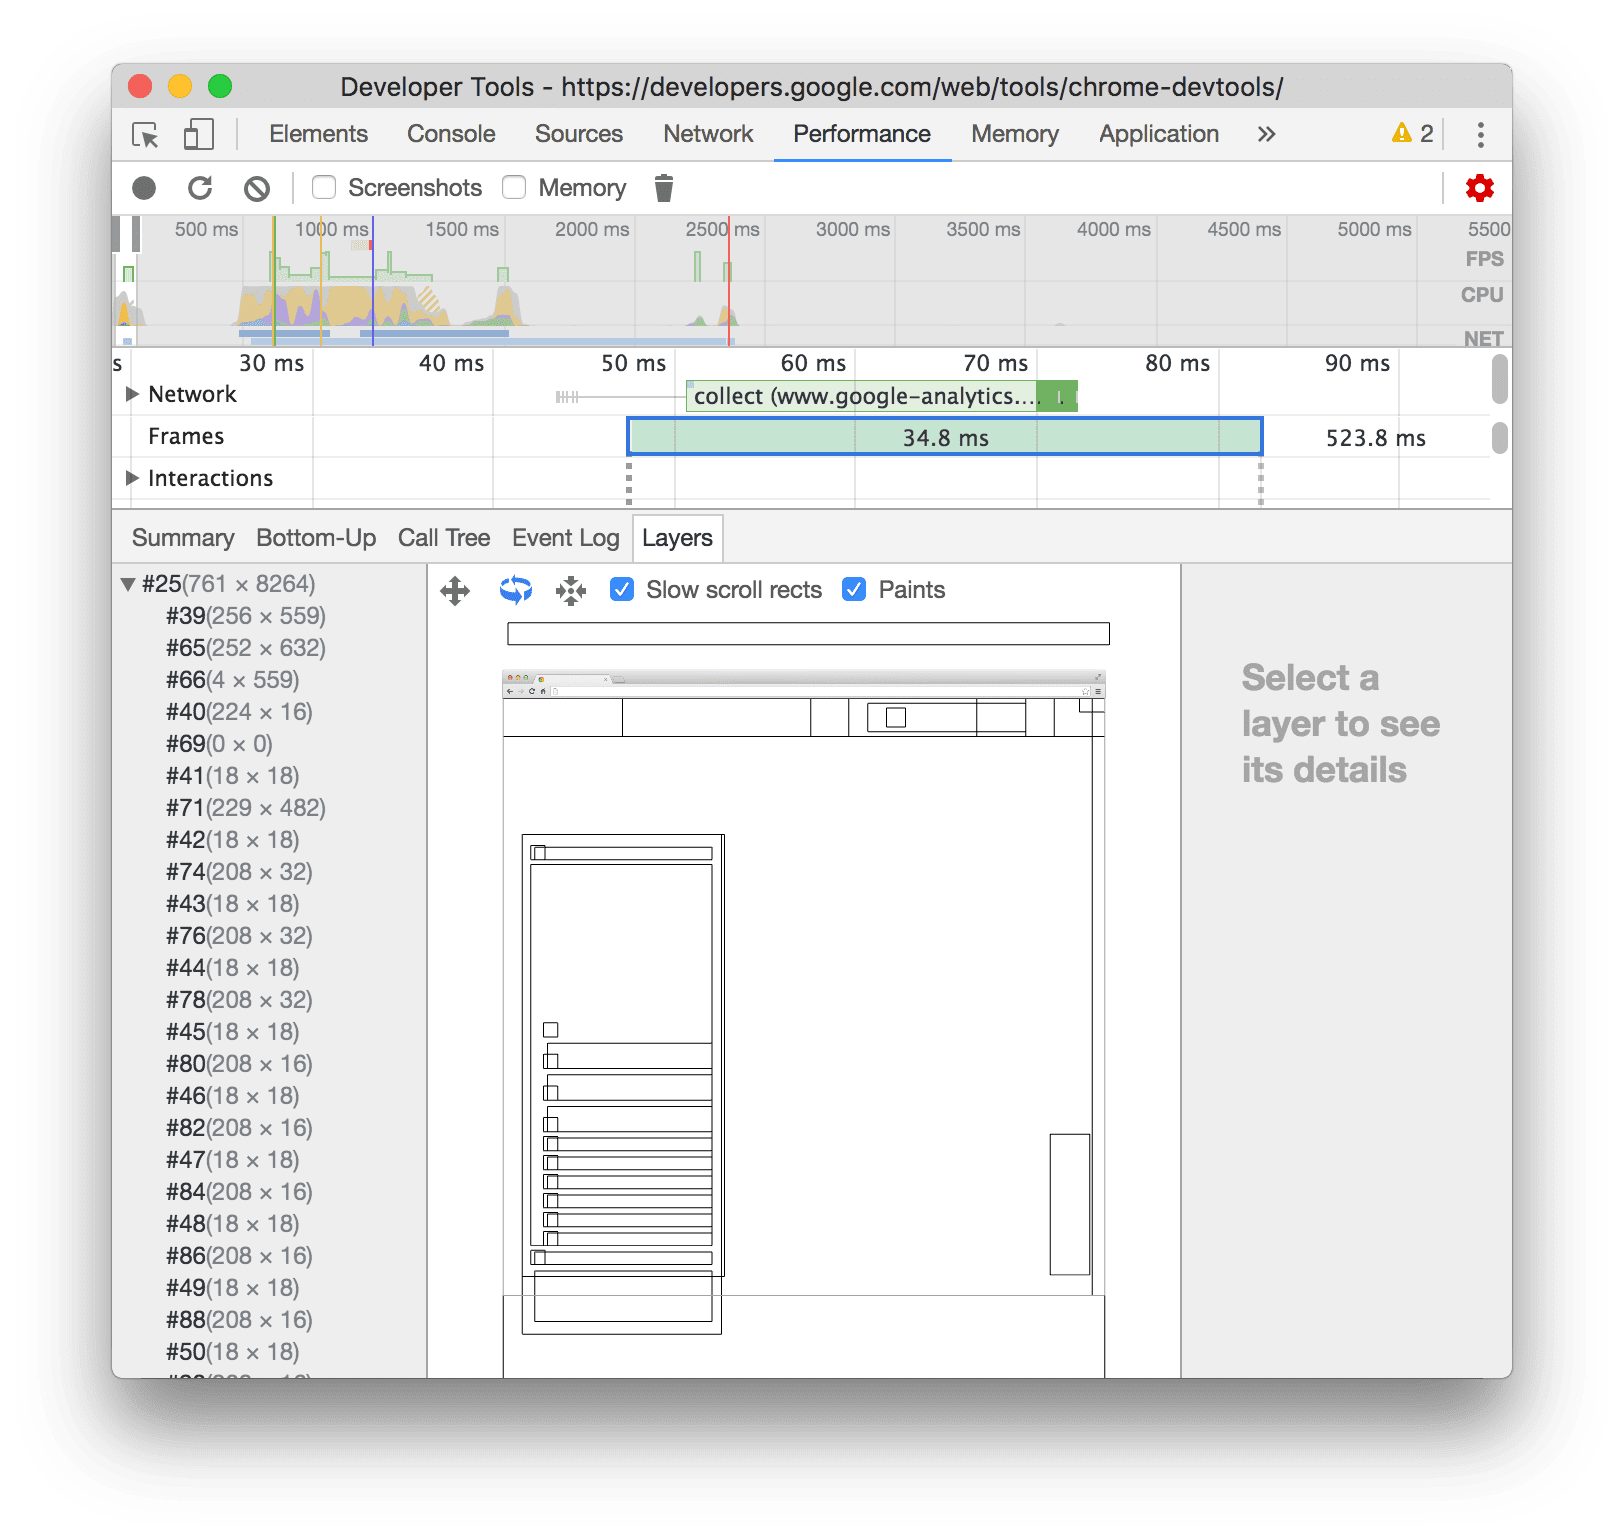
Hover over a layer to highlight it in the diagram.

This example shows the layer #39 highlighted as you hover over it.
To move the diagram:
- Click Pan Mode
 to move along the X and Y axes.
 - Click Rotate Mode
 to rotate
along the Z axis.
to rotate
along the Z axis. - Click Reset Transform
 to reset the diagram to its original position.
See layer analysis in action:
View paint profiler
To view advanced information about a paint event:
- Enable advanced paint instrumentation.
- Select a Paint event in the Main track.

Analyze rendering performance with the Rendering tab
Use the Rendering tab's features to help visualize your page's rendering performance.
View frames per second in real time with the FPS meter
The Frame rendering stats is an overlay that appears in the top-right corner of your viewport. It provides a real time estimate of FPS as the page runs.
View painting events in real time with Paint Flashing
Use Paint Flashing to get a real time view of all paint events on the page.
See Paint flashing.
View an overlay of layers with Layer Borders
Use Layer Borders to view an overlay of layer borders and tiles on top of the page.
See Layer borders.
Find scroll performance issues in real time
Use Scrolling Performance Issues to identify elements of the page that have event listeners related to scrolling that may harm the performance of the page. DevTools outlines the potentially-problematic elements in teal.