

Performance traces can be saved from the Performance panel to allow them to be reloaded at a later time. This is useful to share with other developers or even your future self when debugging performance issues.
Traces can also be saved with a copy of all the script contents and source maps found on the page. This enables a better debugging experience when importing the trace later.
When a trace containing script content or source maps is loaded into the Performance panel, a new tab opens. This DevTools tab contains the Performance and Sources panels.
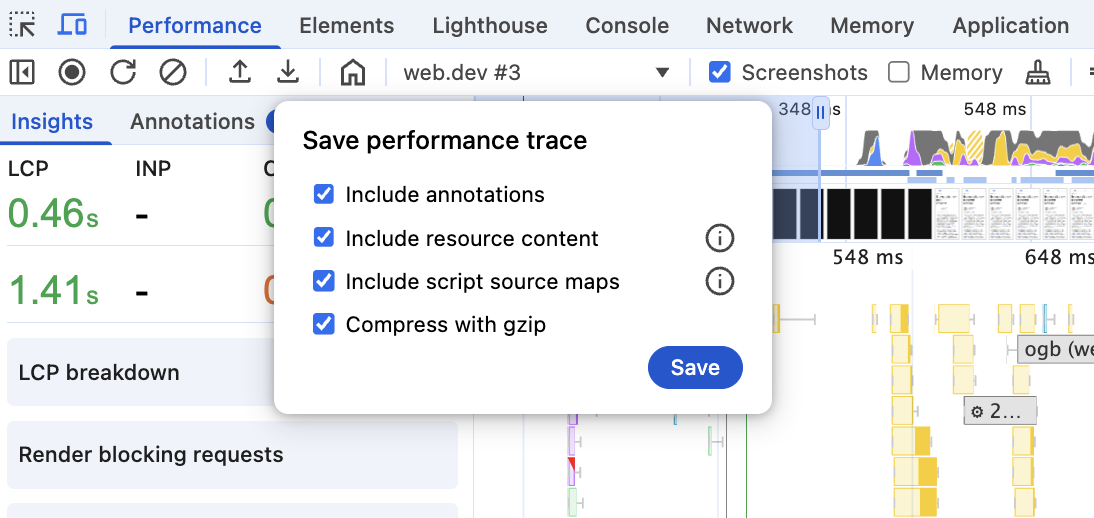
Settings to save a performance trace
To save a recording and later share it with your annotated performance findings, in the action bar at the top of the Performance panel, click Download and select Save trace. You will see the following options:
- Include annotations
- Include resource content
- Include script source maps
- Compress with gzip
| Setting | Description | Default | Why enable | Why disable |
|---|---|---|---|---|
| Include annotations | Note: This option is only included if there are any annotations on the page. Controls whether or not annotations are included in the saved trace file. |
On | Annotations are useful to explain traces, highlight certain important parts of the trace, or ask questions about parts that need further investigation. | Annotations contain your own workings and may not be as relevant for other developers. Instead of saving without annotations, clean up the annotations to include the relevant ones. |
| Include resource content | Controls whether or not the contents of HTML, JavaScript files, and CSS are included in the saved trace file for viewing in the Sources panel when loading the trace. Note: Extension scripts contents are never included even when this option is enabled because extensions are rarely helpful for debugging performance, but often contain sensitive information (for example, private company extensions). However, profiling data from extension scripts is saved in the trace because they can still impact performance. |
Off | The Sources panel can be used to view the resources that ran on the page, including line-based runtime costs. The Performance panel can link to a specific line in the Sources panel (e.g. function calls in the flame chart, or the Bottom-up/Call-tree tables). Some Performance insights require script contents for their analysis. Note: If you consider resource contents to be sensitive information, then you should treat the trace file as sensitive as well. |
Disable if you prefer a smaller trace file more than a better Performance panel experience (for example, seeing the scripts that ran in the Sources panel) Disable if you know that the resource contents have sensitive information that you don't want to share in a trace file. This would be very rare since source files are viewable to anyone with access to the page, but if your server injects secrets based on the current user to the JavaScript that runs on the page, then treat trace files with these script contents as sensitive files. Additionally, for internal, intranet applications that are not public you may not want to share the source files. |
| Include script source maps | Note: This option is only available when Include resource content is enabled. Along with compiled or minified production content files, this will include mappings to the authored source code files. |
Off | The Performance panel will utilize source maps to display authored function names. The Sources panel will show all authored files in the Page file listing. Some Performance insights require source maps for their analysis. Note that if you enable this setting and consider source maps to be sensitive information then you should also treat the trace file as sensitive. |
Disable if you prefer a smaller trace file over a better Performance panel experience (for example, seeing the real names of functions in the Performance flame chart). Disable if you consider your source maps to be sensitive (for example, you only serve source maps to your internal network and not to the public internet), and you don't want them to be exposed to anyone who has the trace file. |
| Compress with gzip | Note: This is the default from Chrome 142. | On | Performance traces can be quite large and compressing them saves both disk space and also makes them quicker to upload and process in DevTools itself. | If you intend to open these files in a text editor or similar to view specific trace events, then you may want to save these without gzip compression to make opening the file simpler. |