The Background services section of Chrome DevTools is a collection of tools for the JavaScript APIs that enables your website to send and receive updates even when a user does not have your website open. A background service is functionally similar to a background process.
The Background services section lets you debug the following background services:
Chrome DevTools can log fetch, sync, and notification events for three days, even when DevTools is not open. This can help you make sure that events are being sent and received as expected.
In addition to background service events, DevTools can:
- Show you reports that Chrome already sent or is about to send using the Reporting API.
- Let you debug and test back/forward cache with a click.
Background fetch
The Background Fetch API enables a service worker to reliably download large resources, like movies or podcasts, as a background service. To log background fetch events for three days, even when DevTools isn't open:
- Open DevTools on a page using the Background Fetch API.
Navigate to Application > Background services > Background fetch, and click
Record.

On your page, trigger some background fetch activity. DevTools logs the events to the table.

Click an event to view its details in the space below the table.
You can close DevTools and leave the recording run for up to three days. To stop recording, click
Stop.
Background sync
The Background Sync API enables an offline service worker to send data to a server once it has re-established a reliable internet connection. To log background sync events for three days, even when DevTools isn't open:
- Open DevTools, for example, on this demo page.
Navigate to Application > Background services > Background sync and click
Record.

On the demo page, click Register background sync to register the respective service worker and click Allow when prompted.
Service worker registration is a background sync activity. DevTools logs the events to the table.

Click an event to view its details in the space below the table.
You can close DevTools and leave the recording run for up to three days. To stop recording, click
Stop.
(Experimental) Bounce tracking mitigations
Bounce tracking mitigations experiment in Chrome lets you identify and delete the state of sites that appear to perform cross-site tracking using the bounce tracking technique. You can manually force tracking mitigations and see a list of sites whose states were deleted.
To force tracking mitigations:
- Block third-party cookies in Chrome. Navigate to and enable
> Settings >
Privacy and security > Cookies and other site data >
Block third-party cookies.
- In
chrome://flags, set the Bounce tracking mitigations experiment to Enabled With Deletion. - Open DevTools and navigate to Application > Background services > Bounce tracking mitigations.
- Click a bounce link and wait (10 seconds) for Chrome to record the bounce. The Issues tab warns you about the upcoming state deletion.
- Click Force run to delete the state immediately.
![]()
Notifications
After a service worker has received a Push Message from a server, the service worker uses the Notifications API to display the data to a user. To log Notifications for three days, even when DevTools isn't open:
- Open DevTools
Navigate to Application > Background services > Notifications and click
Record.

Click Schedule Notification and Allow when prompted.
Wait for the notification to appear. DevTools logs the notification events to the table.

Click an event to view its details in the space below the table.
You can close DevTools and leave the recording run for up to three days. To stop recording, click
Stop.
Speculative loads
Speculative loads allow a near-instant page load based on speculation rules that you define. This lets your website prefetch and prerender most navigated-to pages.
Prefetch fetches a resource in advance and prerender goes a step beyond and renders the whole page in a hidden background renderer process.
You can debug speculative loads in the Application > Background services > Speculative loads section. The section contains three views:
- Speculative loads. Contains the speculative status for the current page, current URL, pages that the current page attempts to load speculatively, and their statuses.
- Rules. Contains the rule sets on the current page in the Elements panel and the overall status of speculations.
- Speculations. Contains a table with information on speculative loading attempts and their statuses. If an attempt failed, you can click it in the table to see detailed information and failure reason.
Try debugging speculative loads on this prerender demo page:
Open DevTools on the page and navigate to Application > Background services > Speculative loads. If you can't see any speculative loads initiated by the page, reload it.

The starting page of the demo prerenders two pages and fails to prerender one. Click View all speculations.
In Speculations, select the speculation with the Failure status to see the Failure reason the section with detailed information at the bottom.

In this case, the prerender failed because there's no
/next3.htmlpage on the website.Open the Rules section and click the Status to see the rule set at the bottom. Clicking on the Rule set link takes you to the Elements panel and shows you where the speculation rule is defined.

For a more detailed walkthrough, see Debugging speculation rules.
Push messaging
To display a push notification to a user, a service worker must first use the Push Message API to receive data from a server. When the service worker is ready to display the notification, it uses the Notifications API. To log push messages for three days, even when DevTools isn't open:
- Open DevTools, for example, on this demo page.
Navigate to Application > Background services > Push Messaging and click
Record.

On the demo page, toggle Enable push notifications, click Allow when prompted, type a message, and send it. DevTools logs push notification events to the table.

Click an event to view its details in the space below the table.
You can close DevTools and leave the recording run for up to three days. To stop recording, click
Stop.
Reporting API
Some errors happen only in production. You never see them locally or during development because real users, networks, and devices change the game.
For example, say your new site relies on third-party software that uses document.write() to load critical scripts. New users all over the world open your site but they might have slower connections than you tested with. Unknown to you, your site starts breaking for them because Chrome intervenes against document.write() on slow networks. Alternatively, you might want to keep an eye on deprecated or soon-to-be-deprecated APIs your codebase may be using.
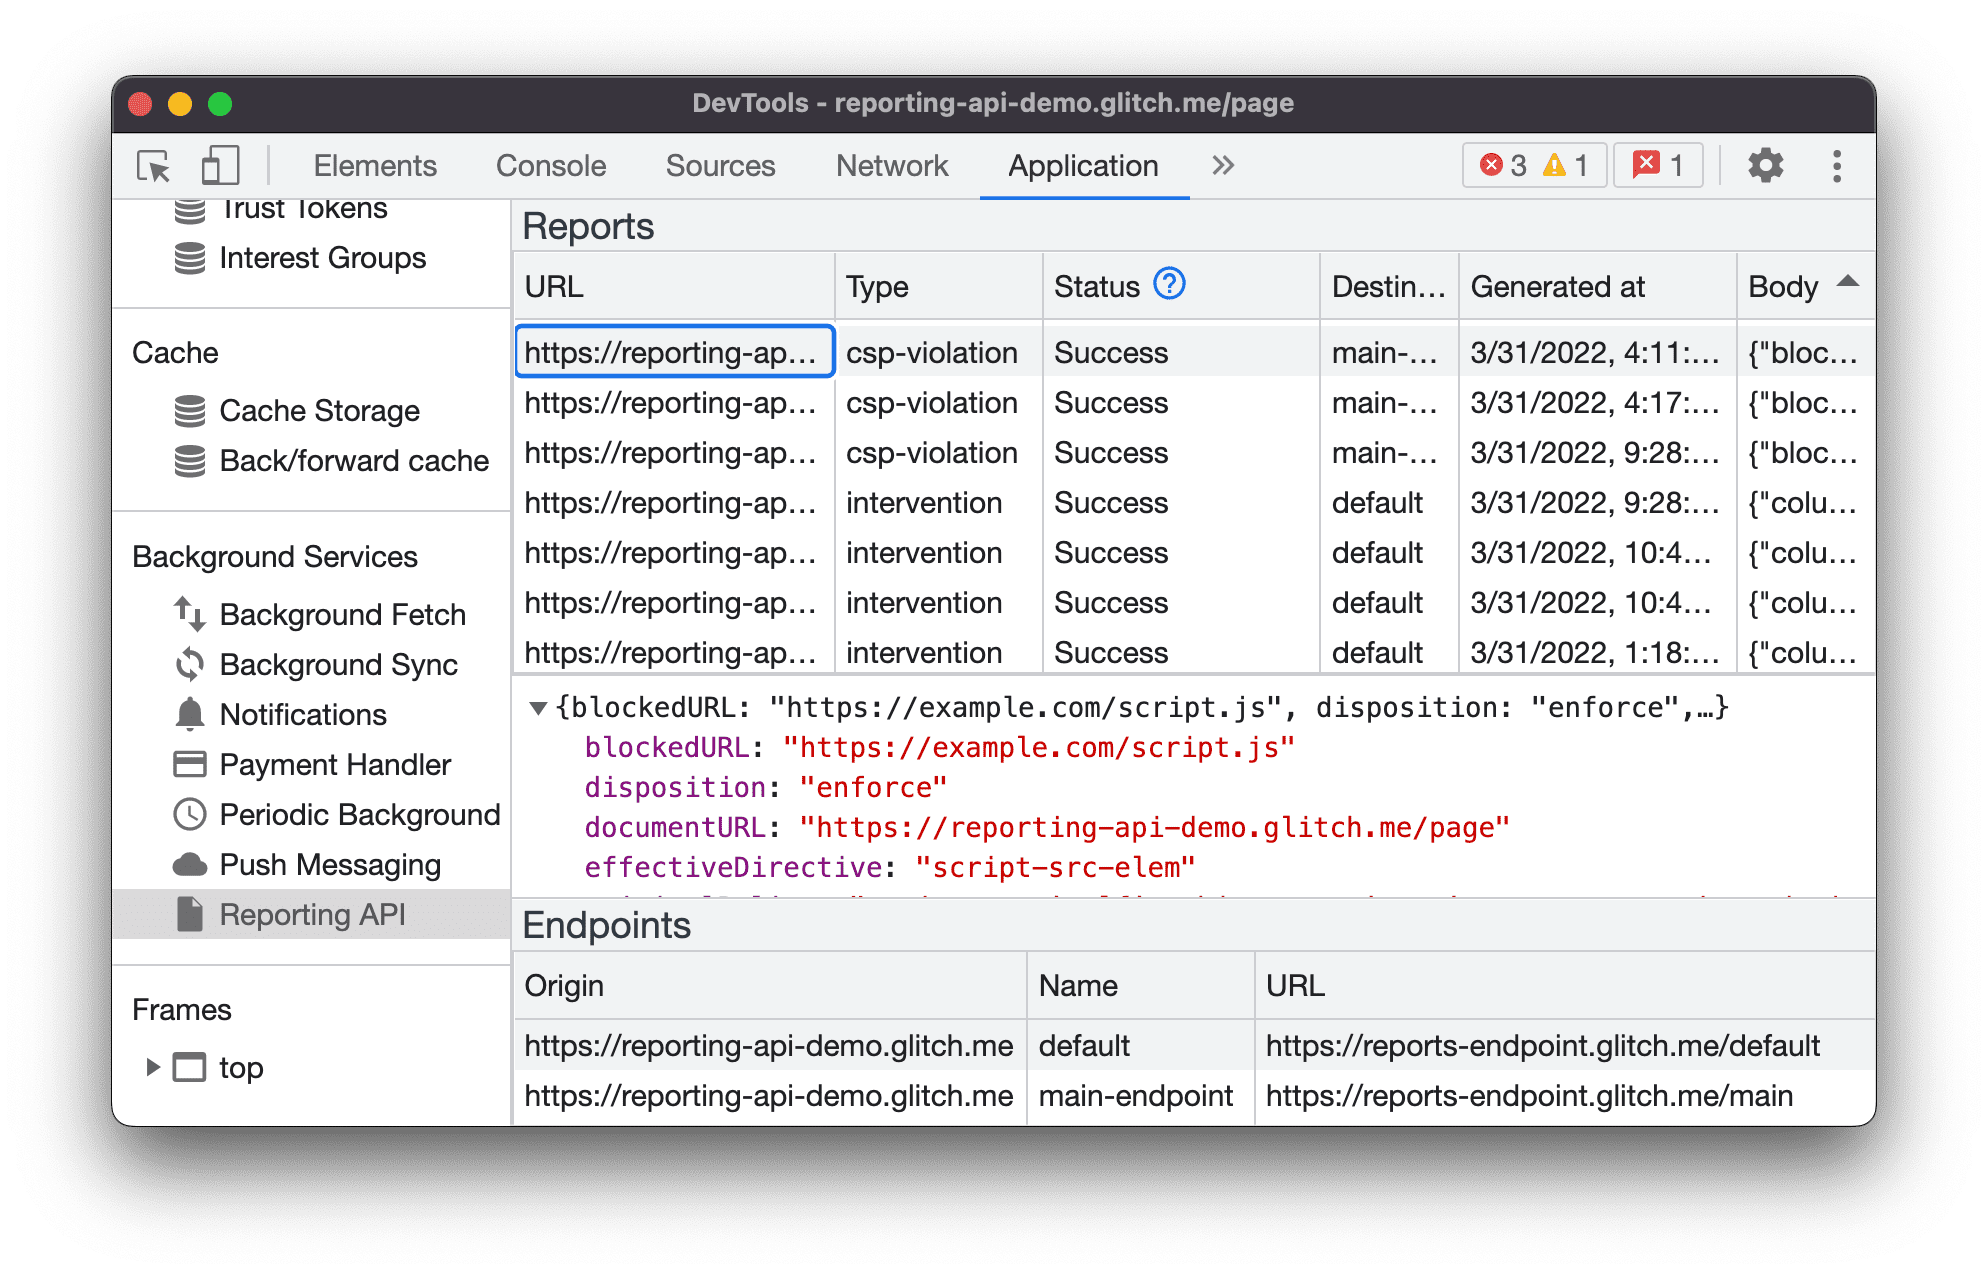
The Reporting API is designed to help you monitor deprecated API calls, security violations of your page, and more. You can set up reporting as described in Monitor your web application with the Reporting API.
To view the reports generated by a page:
- Go to
chrome://flags/#enable-experimental-web-platform-features, set Experimental Web Platform features to Enabled, and restart Chrome. Open DevTools and navigate to Application > Background services > Reporting API.

The Reporting API tab is divided into three parts:
- The Reports table with the following information on each report:
- URL that caused the report generation
- Violation Type
- Report Status
- Destination endpoint
- Generated at timestamp
- Report Body
- The Report body preview section. To preview a report body, click a report in the table of reports.
- The Endpoints section with an overview of all the endpoints configured in the
Reporting-Endpointsheader.
Report status
The Status column tells you whether Chrome sent the report successfully, is about to send it, or failed.
| Status | Description |
|---|---|
Success |
The browser has sent the report and the endpoint replied with a success code (200 or another success response code 2xx). |
Pending |
The browser is making an attempt to send the report. |
Queued |
The report has been generated and the browser is not trying to send it yet. A report appears as Queued in one of these two cases:
|
MarkedForRemoval |
After retrying for a while (Queued), the browser has stopped trying to send the report and will soon remove it from its list of reports to send. |
Reports are removed after a while, whether or not they're successfully sent.
Device bound sessions
Device Bound Session Credentials (DBSC) is a Web API and a protocol between user agents and servers that aims to prevent cookie theft by allowing a user agent to assert possession of a securely-stored private key.
To view the device bound sessions, their definitions, and events:
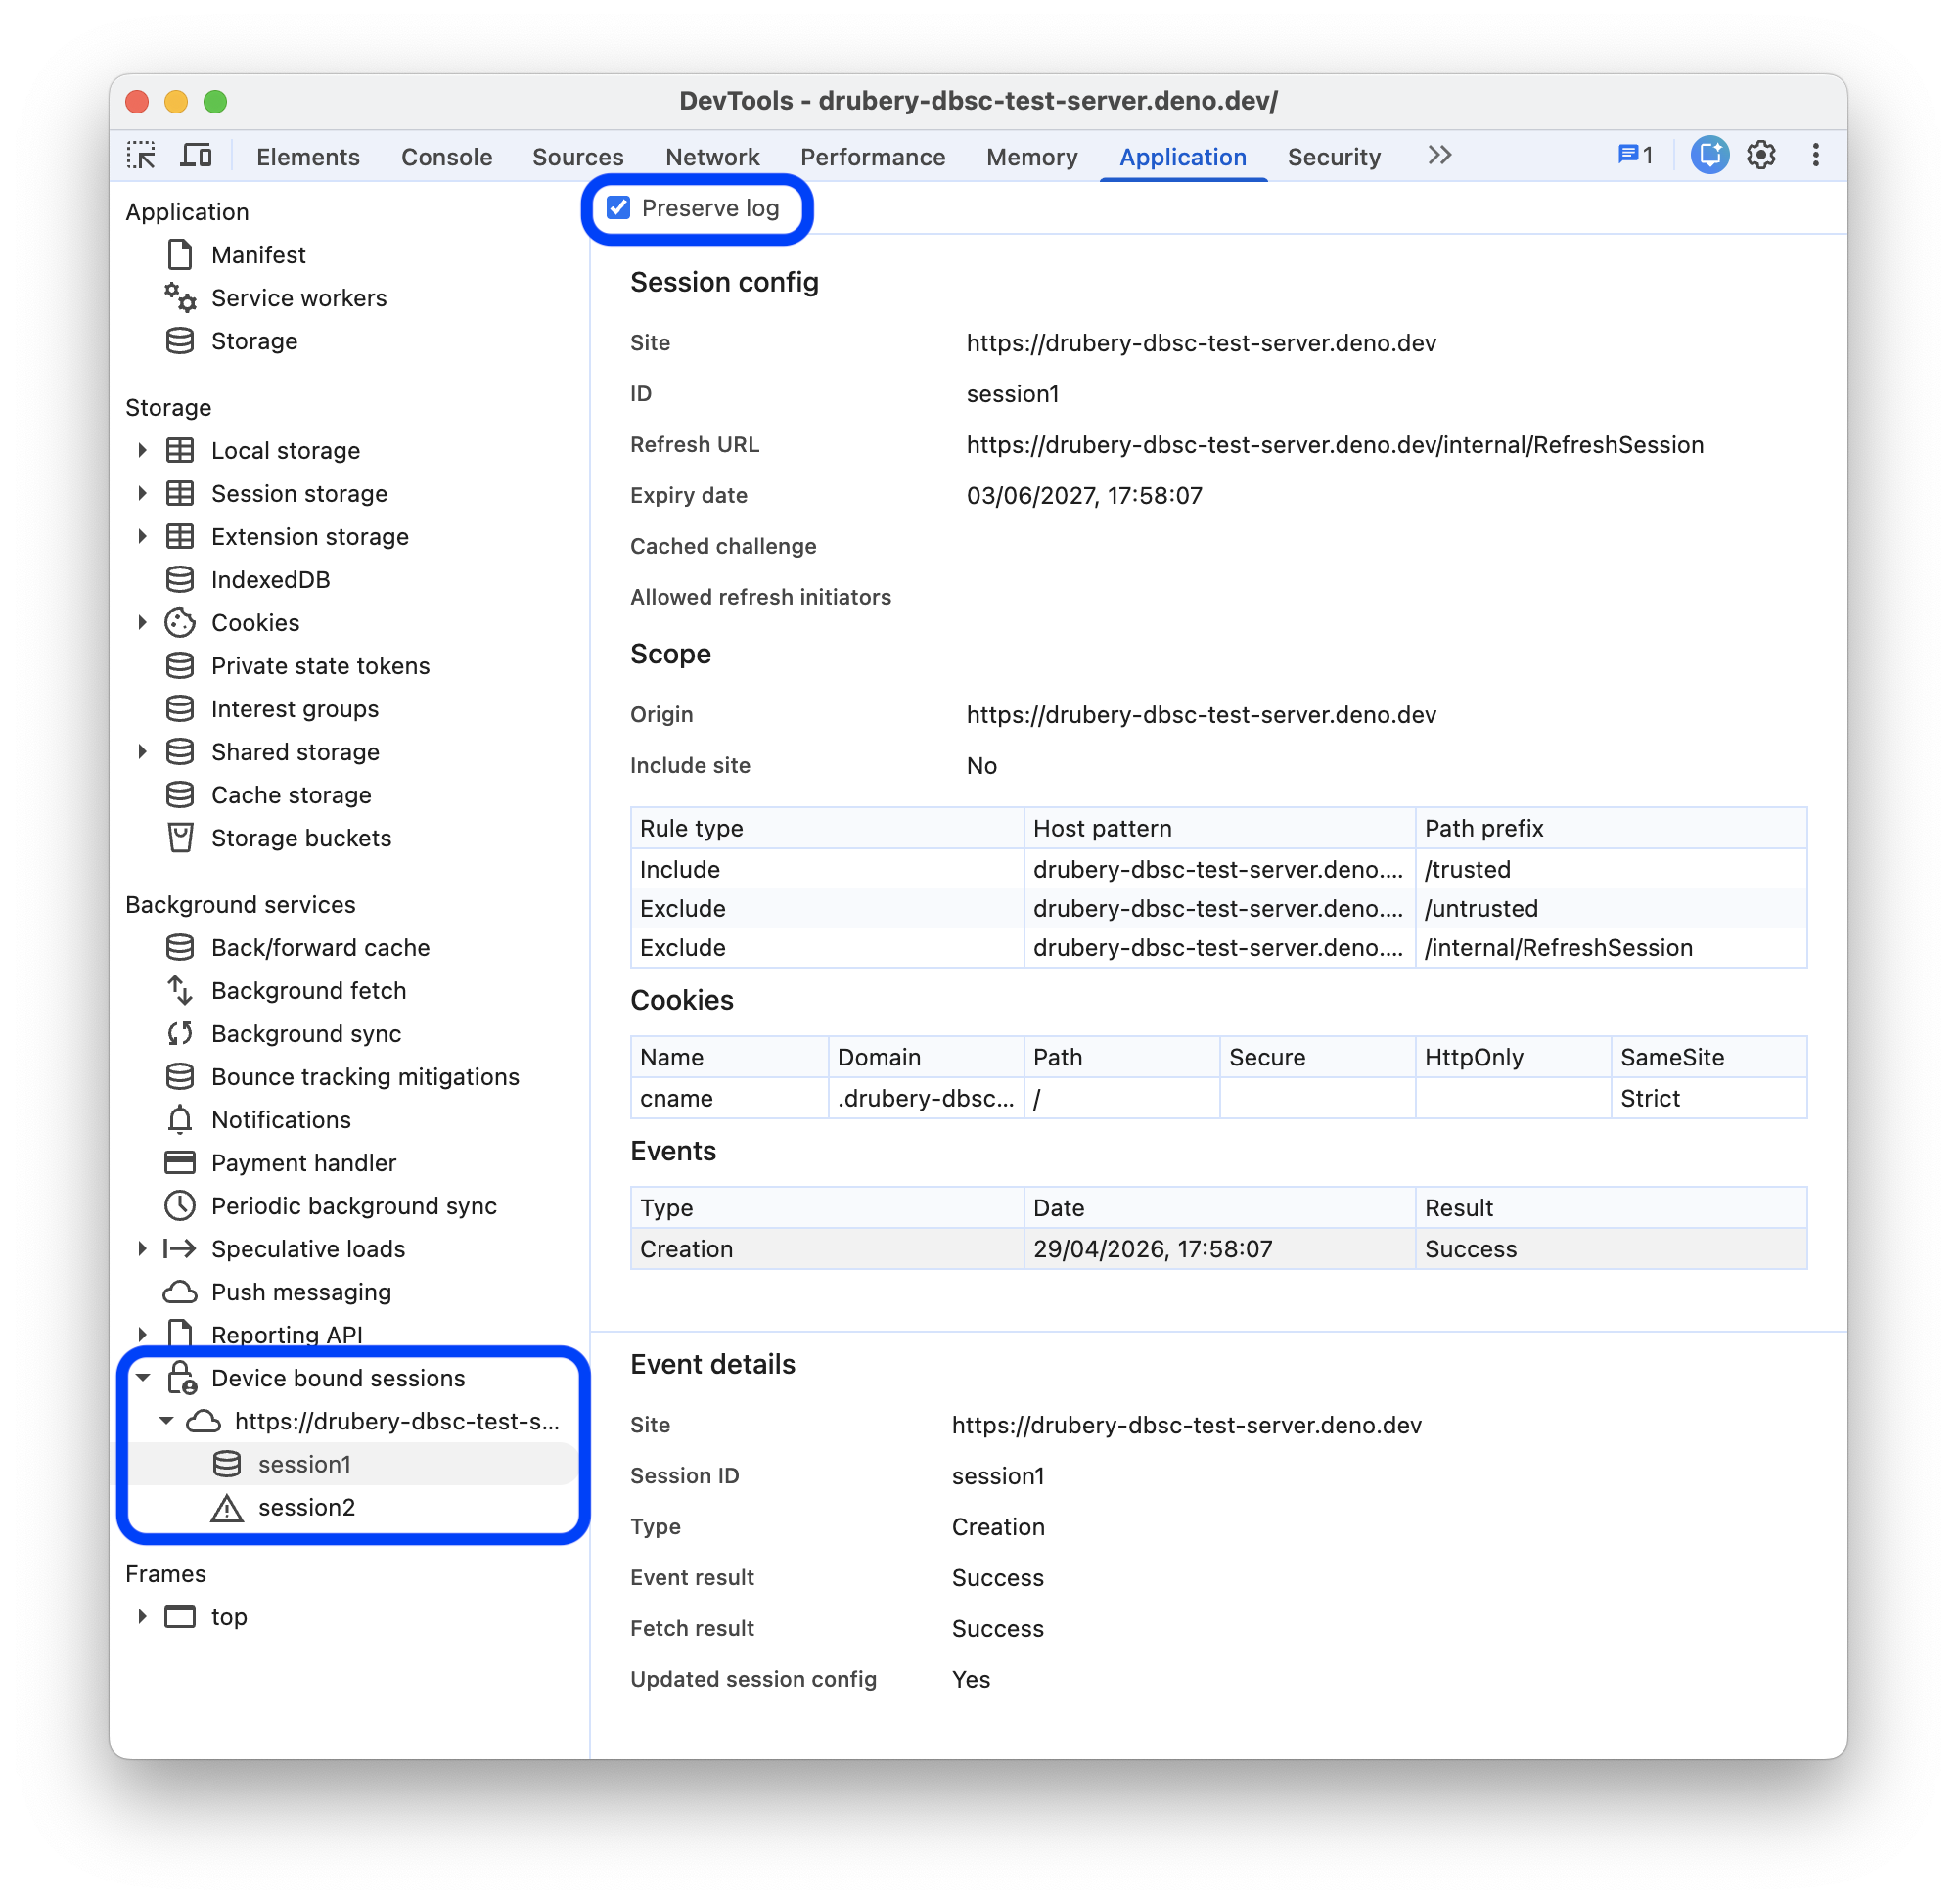
- Open DevTools on a page that uses DBSC.
- Navigate to Application > Background services > Device bound sessions.
In the sidebar on the left, expand a site to view its active sessions. Select a session to view its definition.

The Events table logs the DBSC events: creation, refresh, challenge, and termination. To keep the list of events across page navigations, check check_box Preserve log.
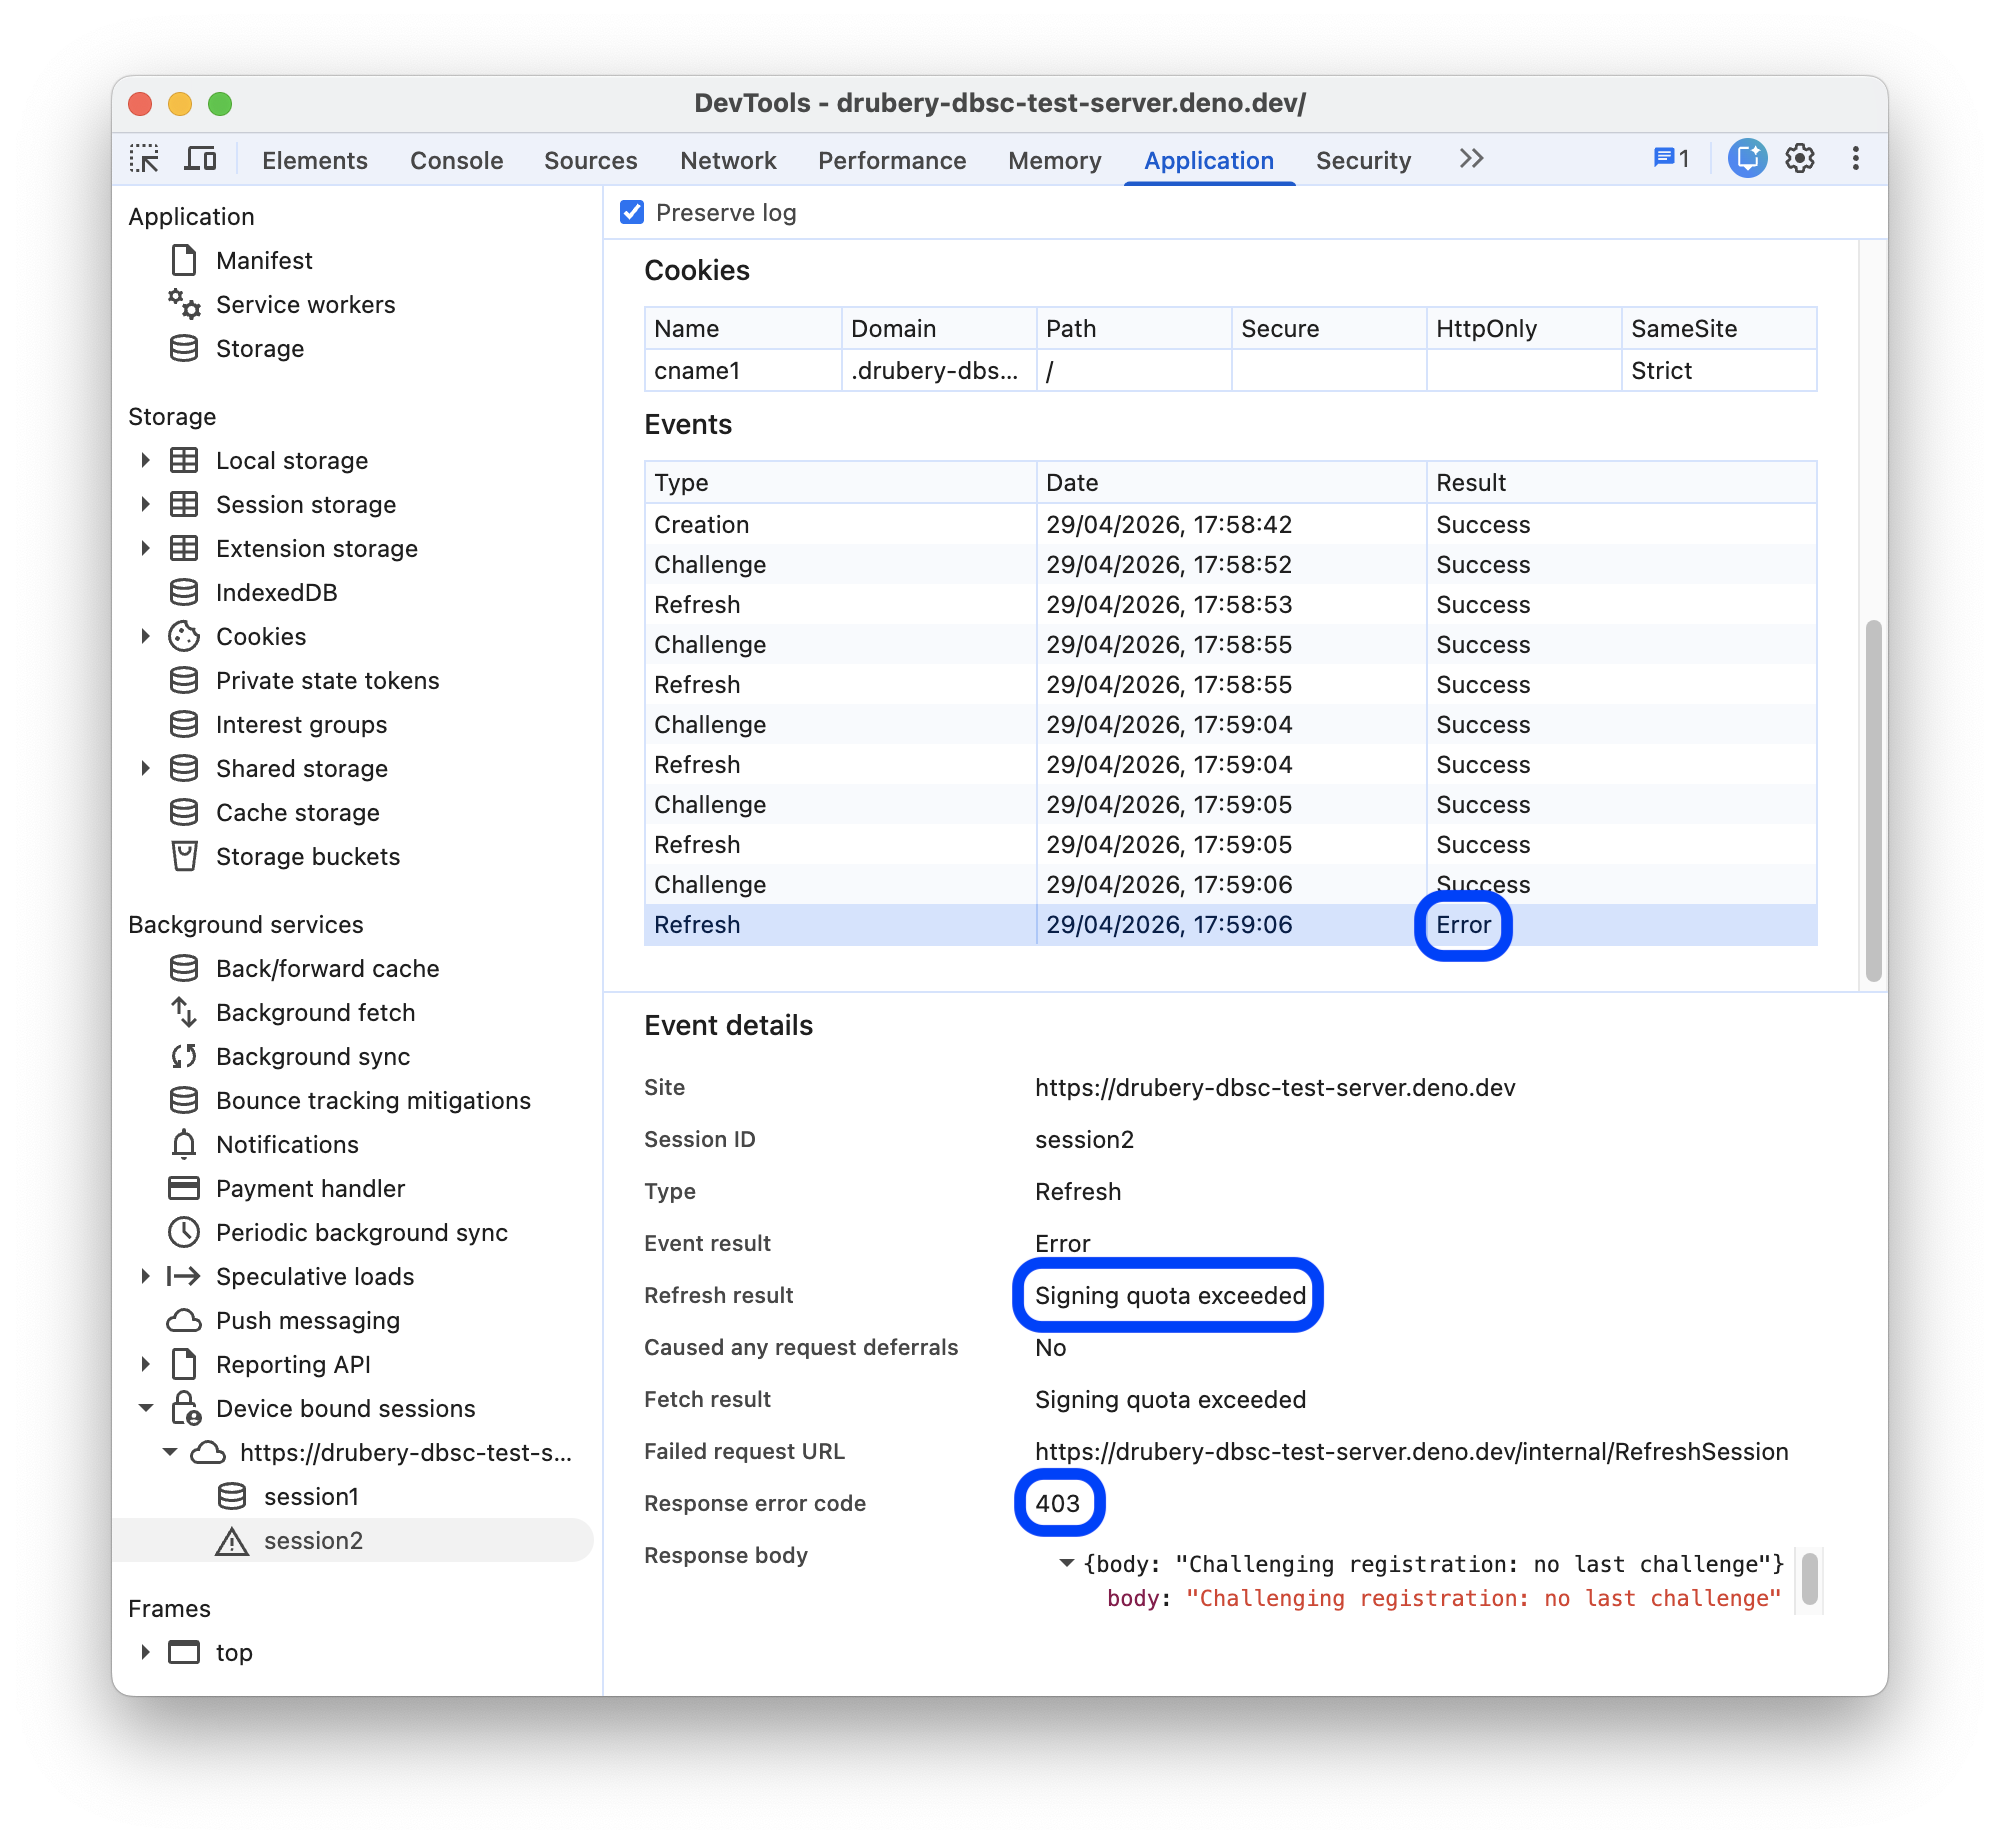
In the Events table, select an event to view its details.
If an event fails, you will see the
Errormessage in the Result column. Select the failed event to see its details, response error code, and the cause of failure.
The Device bound sessions section in the sidebar may highlight the following issues:
- Terminated sessions: Indicated by a strikethrough and a database-off icon in the sidebar.
- Failed events: Highlighted with a warning icon. The No session element captures failed events that were linked to a site but not to a known session.


