Use the Sources panel to view and edit your website's resources, such as stylesheets, Javascript files, and images.
Overview
The Sources panel lets you do the following:
- View files.
- Edit CSS and JavaScript.
- Create and save Snippets of JavaScript, which you can run on any page. Snippets are similar to bookmarklets.
- Debug JavaScript.
- Set up a Workspace, so that changes you make in DevTools get saved to the code on your file system.
Open the Sources panel
To open the Sources panel, follow these steps:
- Open DevTools.
- Open the Command menu by pressing:
- macOS: Command+Shift+P
- Windows, Linux, ChromeOS: Control+Shift+P
- Start typing
sources, select Show Sources panel, and press Enter.
Alternatively, in the top right corner, select more_vert More options > More tools > Sources.
View files
Click the Page tab to view all of the resources that the page has loaded.

How the Page tab is organized:
- The top-level, such as
topon the screenshot above, represents an HTML frame. You'll findtopon every page that you visit.toprepresents the main document frame. - The second-level, such as
developers.google.comon the screenshot above, represents an origin. - The third-level, fourth-level, and so on, represent directories and resources that were loaded
from that origin. For example, on the screenshot above, the full path to the resource
devsite-googler-buttonisdevelopers.google.com/_static/19aa27122b/css/devsite-googler-button.
Click a file in the Page tab to view its contents in the Editor tab. You can view any type of file. For images, you see a preview of the image.

Edit CSS and JavaScript
Click the Editor tab to edit CSS and JavaScript. DevTools updates the page to run your new code.
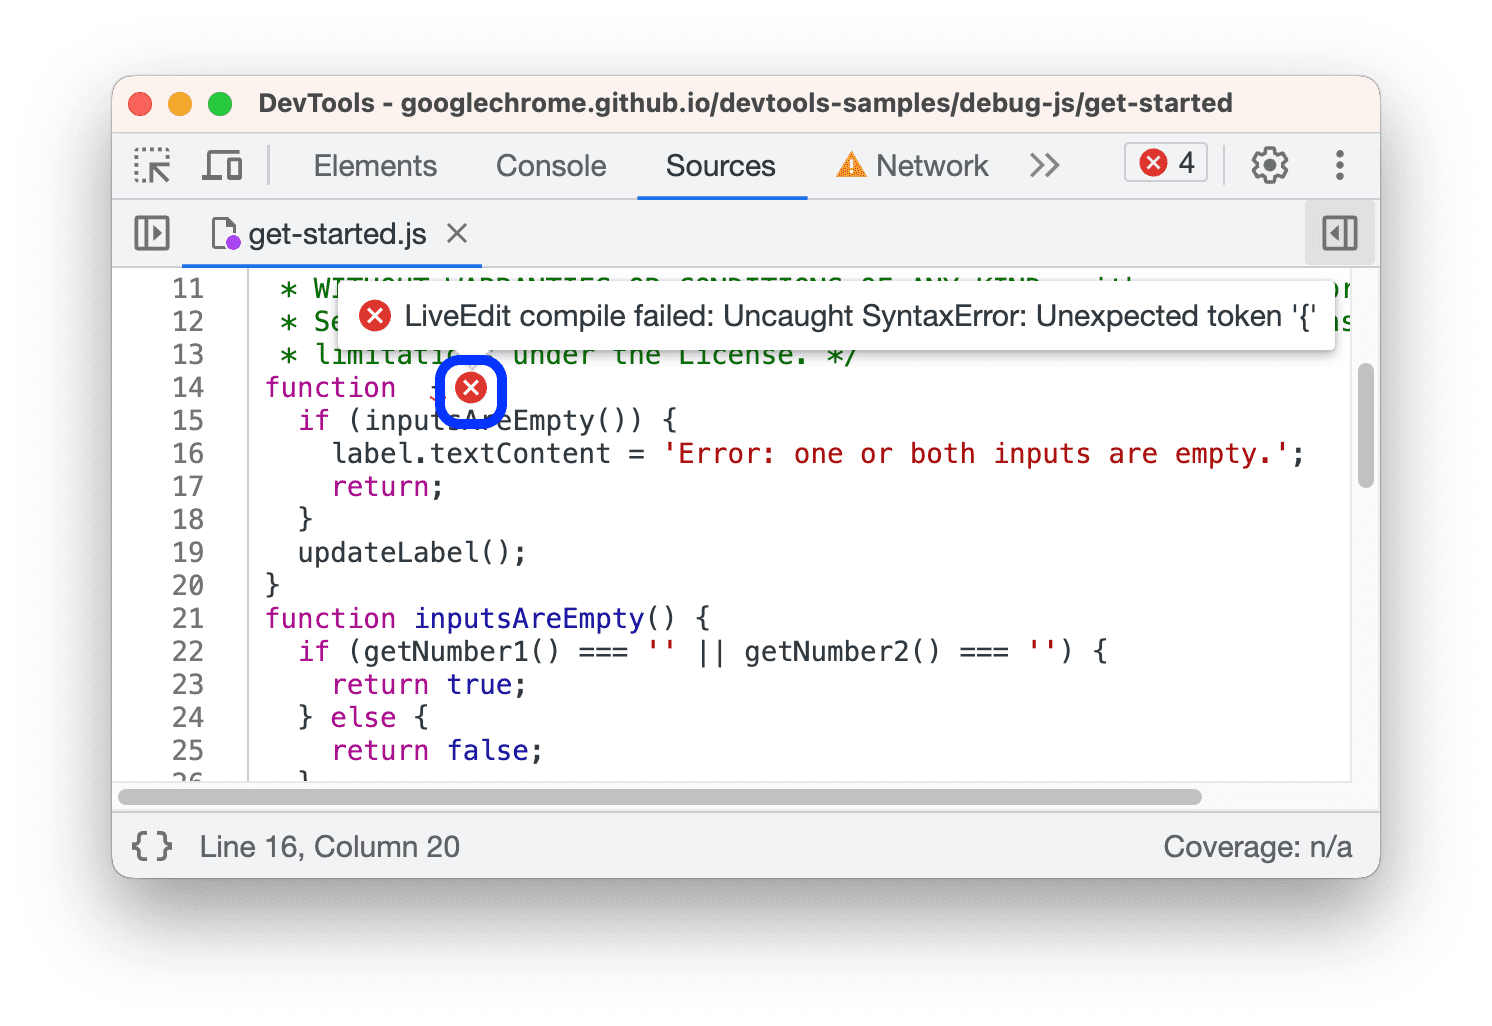
The Editor also helps you debug. For example, it underlines and shows inline error tooltips next to syntax errors and other issues, such as failed CSS @import and url() statements, and HTML href attributes with invalid URLs.

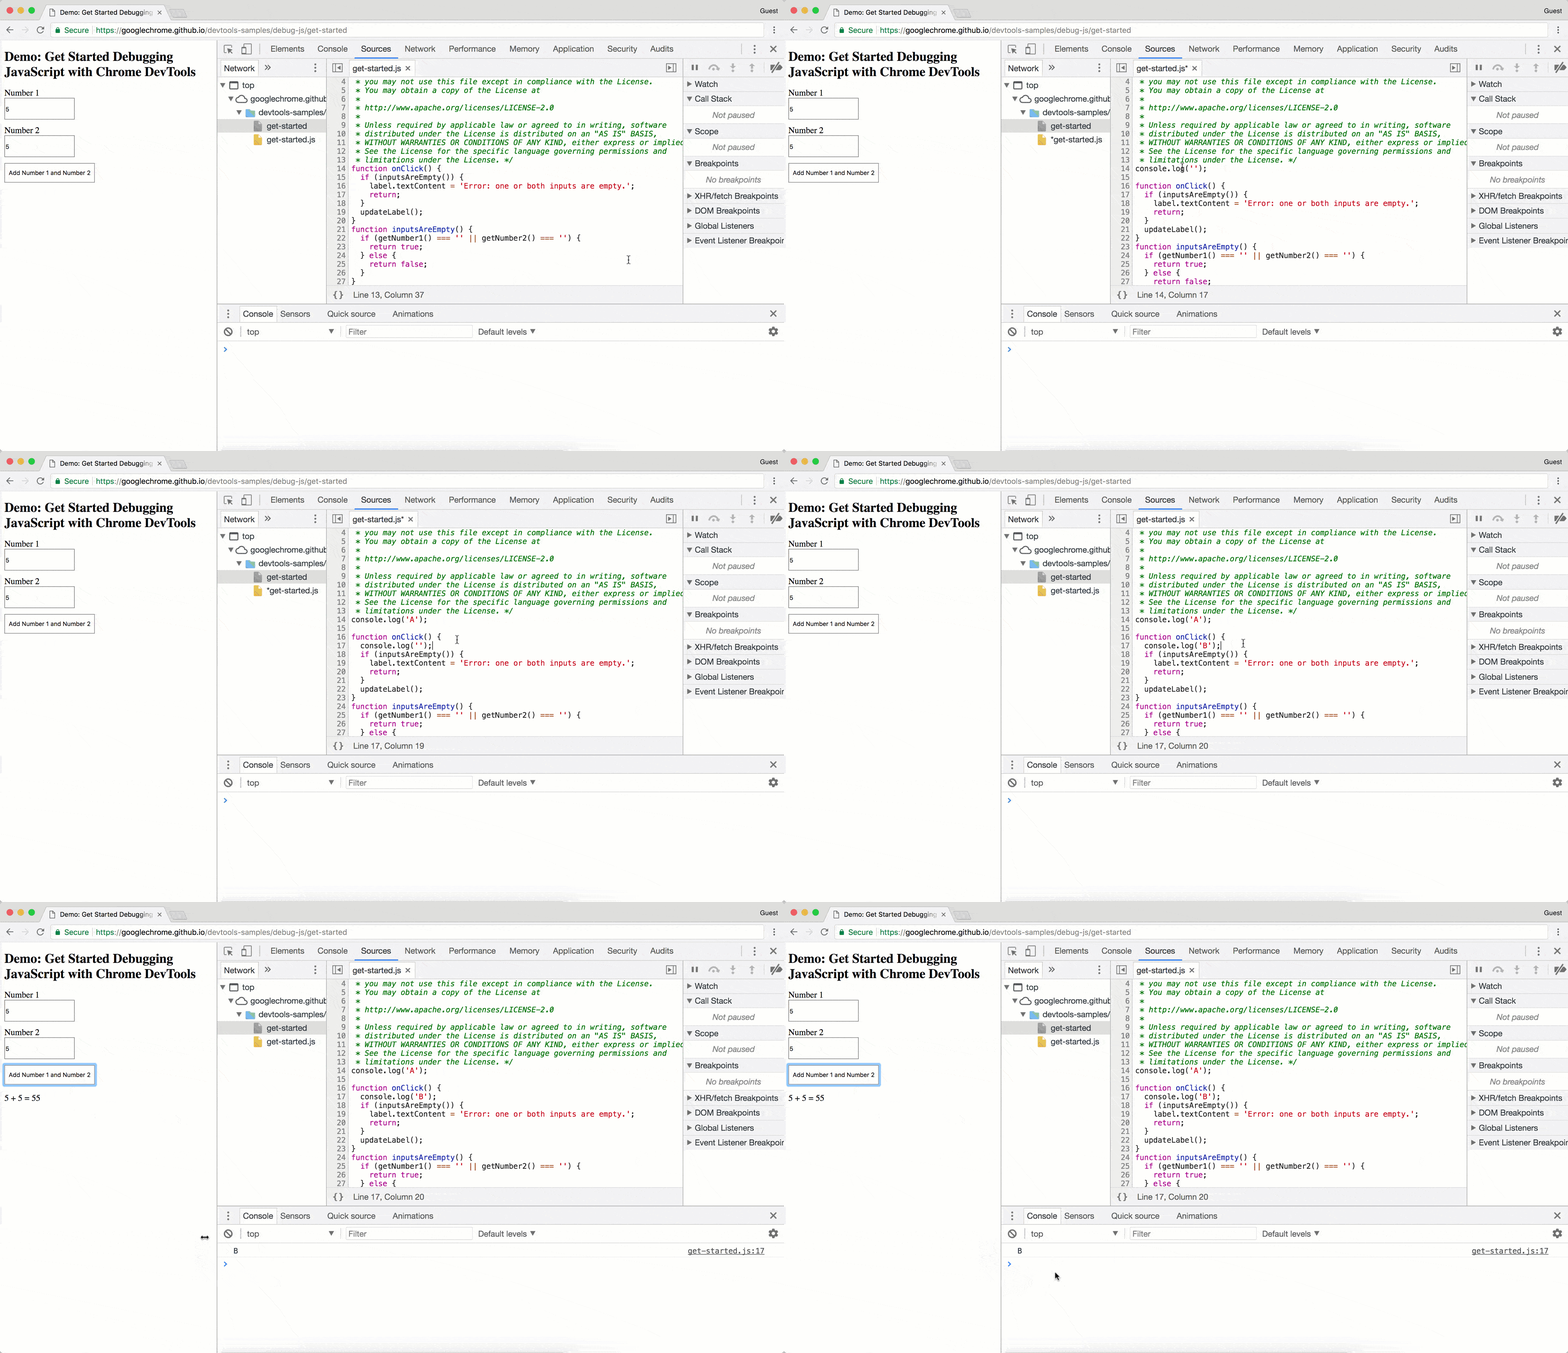
If you edit the background-color of an element, you'll see that the change takes effect
immediately.

For JavaScript changes to take effect, press Command+S (Mac) or Control+S (Windows, Linux). DevTools doesn't re-run a script, so the only JavaScript changes that take effect are those that you make inside of functions. For example, note how console.log('A') doesn't run, whereas console.log('B') does.

If DevTools re-ran the entire script after making the change, then the text A would have been logged to the
Console.
DevTools erases your CSS and JavaScript changes when you reload the page. See Set up a Workspace to learn how to save the changes to your file system.
Create, save, and run Snippets
Snippets are scripts which you can run on any page. Imagine that you repeatedly type out the following code in the Console, in order to insert the jQuery library into a page, so that you can run jQuery commands from the Console:
let script = document.createElement('script');
script.src = 'https://code.jquery.com/jquery-3.2.1.min.js';
script.crossOrigin = 'anonymous';
script.integrity = 'sha256-hwg4gsxgFZhOsEEamdOYGBf13FyQuiTwlAQgxVSNgt4=';
document.head.appendChild(script);
Instead, you can save this code in a Snippet and run it with a couple of button clicks, any time you need it. DevTools saves the Snippet to your file system. For example, examine a Snippet that inserts the jQuery library into a page.

To run a Snippet:
- Open the file in the Snippets tab, and click Run
on the action bar at the bottom.
- Open the Command Menu, delete the
>character, type!, type the name of your Snippet, then press Enter.
See Run Snippets Of Code From Any Page to learn more.
Debug JavaScript
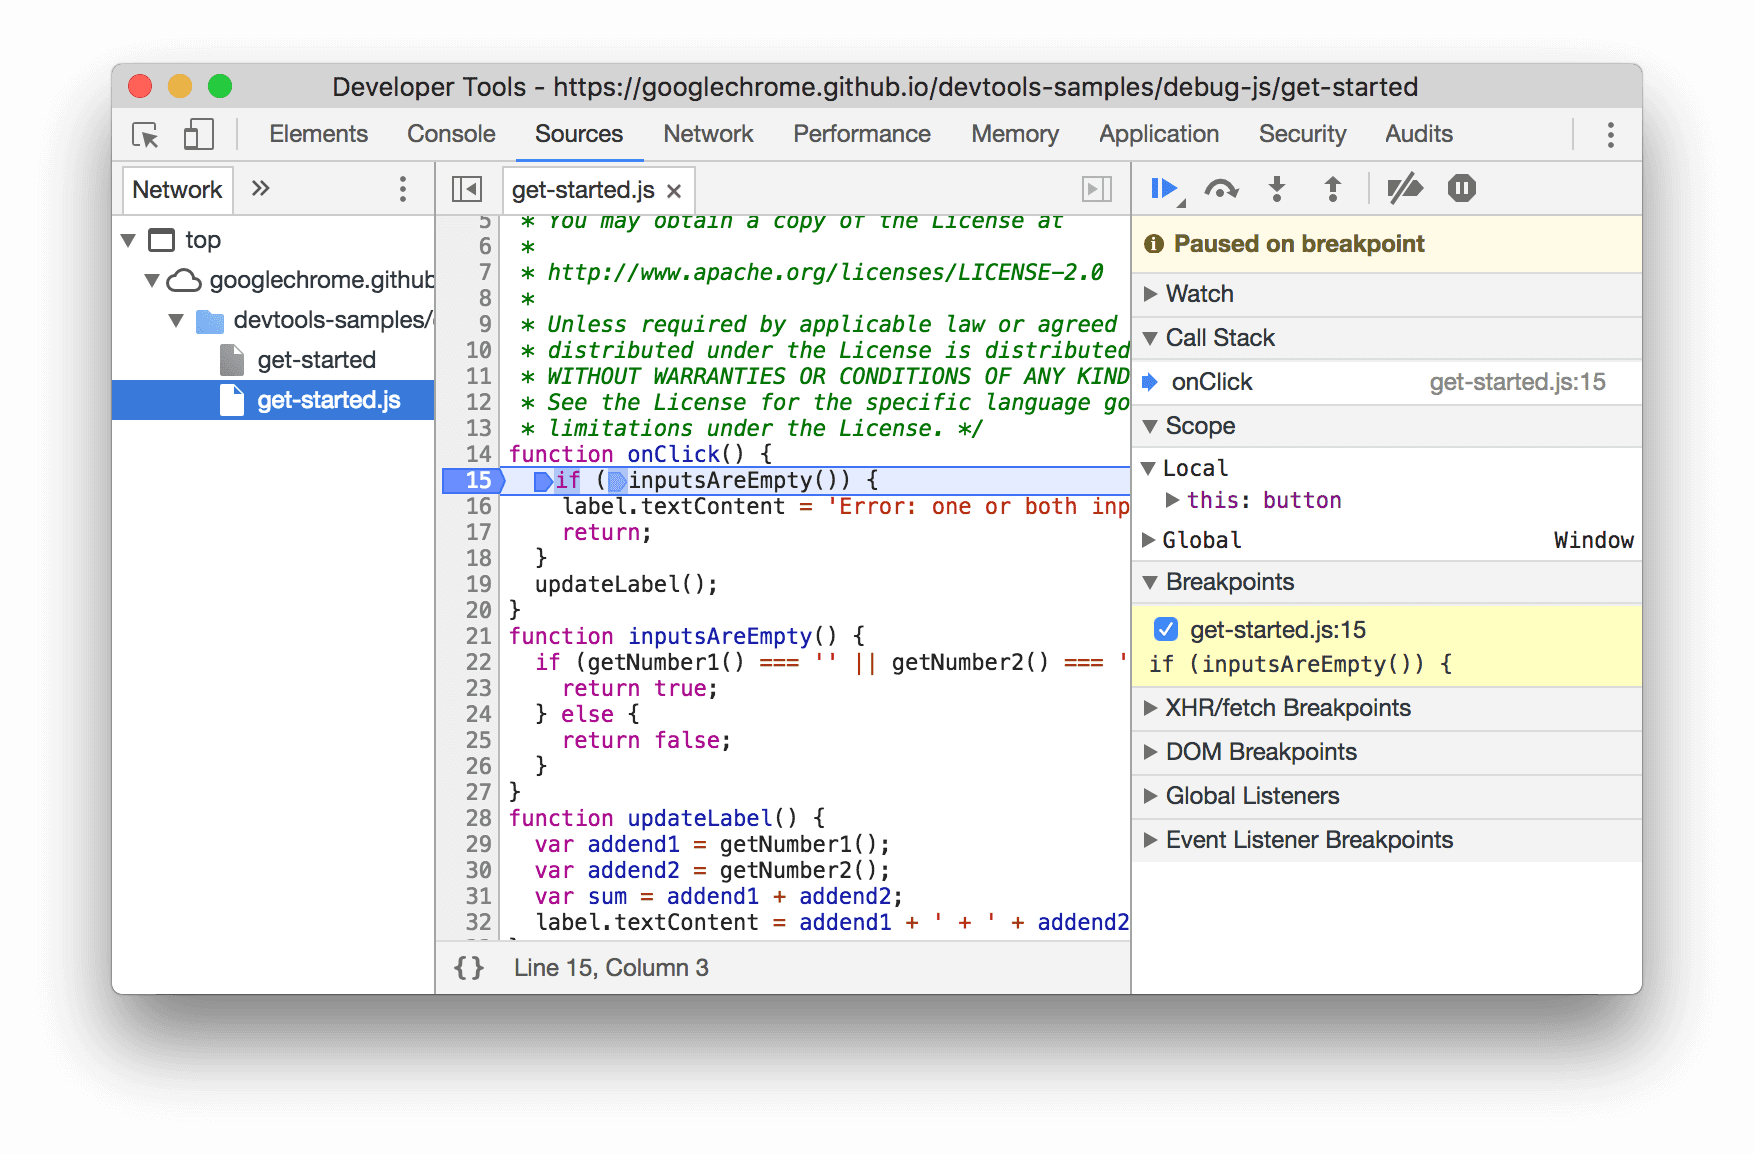
Rather than using console.log() to infer where your JavaScript is going wrong, consider using the
Chrome DevTools debugging tools, instead. The general idea is to set a breakpoint, which is an
intentional stopping place in your code, and then step through your code's execution, one line at a
time.

As you step through the code, you can view and change the values of all currently-defined properties and variables, run JavaScript in the Console, and more.
See Get Started With Debugging JavaScript to learn the basics of debugging in DevTools.
Focus only on your code
Chrome DevTools lets you focus only on the code you author by filtering out the noise generated by frameworks and build tools you leverage when building web applications.
To provide you with the modern web debugging experience, DevTools does the following:
- Separates authored and deployed code. To help you find your code quicker, the Sources panel separates the code you create from the bundled and minified code.
- Ignores known third-party code:
- The Sources panel hides such sources from the file tree on the Page tab.
- The Console hides such frames from stack traces.
- The Open File menu hides such files from search results.
Additionally, if supported by frameworks, the Call Stack in the debugger and stack traces in the Console show the full history of asynchronous operations.
To learn more, see:
Set up a Workspace
By default, when you edit a file in the Sources panel, those changes are lost when you reload the page. Workspaces enable you to save the changes that you make in DevTools to your file system. Essentially, this lets you use DevTools as your code editor.
See Edit Files With Workspaces to get started.


