

Published: August 18, 2018, Last updated: October 15, 2025
Overview
Use the Lighthouse panel to run a comprehensive audit of your website. The Lighthouse panel generates a report that gives you details on the following categories on your website:
- Performance
- Accessibility
- Best Practices
- SEO
Each category provides a score and highlights potential issues and suggestions for improvements.
To learn more about the other ways Lighthouse can improve the quality of your website, see our Lighthouse docs.
Lighthouse versus Performance panel
One of the key uses of Lighthouse is to identify performance problems, but we also have the Performance panel. What are the benefits of each tool, and which should you use?
Previously, the Performance panel was seen as a tool for experts, while Lighthouse offered a high-level overview that required less web performance expertise.
The Performance panel now offers a more approachable view with Live Metrics. Once in the trace view you can see issues tradditionally surfaced by Lighthouse, with shared Performance Insights available in the Insights sidebar.
When using DevTools to debug performance problems, we recommend the Performance panel over Lighthouse for more detailed and in-depth debugging capabilities.
However, Lighthouse is still useful for the other categories (Accessibility, Best Practices, SEO), and we also keep the Performance category here for those that prefer to use that and for consistency with other Lighthouse tooling.
Lighthouse in DevTools versus other Lighthouse tooling
Lighthouse offers some extra features or considerations compared to other Lighthouse tooling, whether that be PageSpeed Insights, Lighthouse CI in automated testing, or other third-party tools.
Some of these are controlled with the options shown on screen before initiating the Lighthouse audit, with some of the more advanced settings hidden by default until the Settings button is clicked:
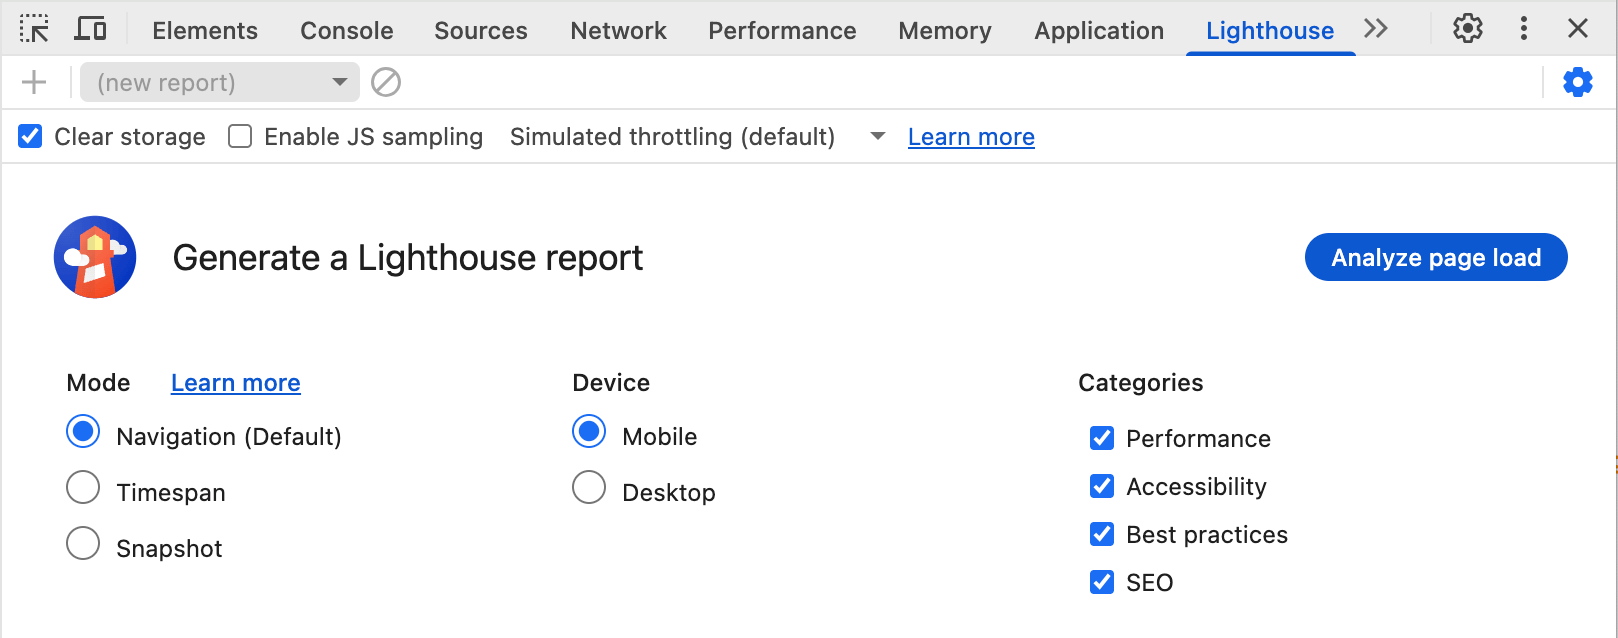
These aren't the full suite of configuration options available to Lighthouse, but do represent the more common options used.
Easier mode setups
As well as the default Navigation mode (which runs a Lighthouse report on a fresh page load), Lighthouse offers Timespan and Snapshot modes for measuring user flows.
The Timespan mode runs Lighthouse audits over some period of time, which may or may not include a navigation. By using Lighthouse in DevTools you can start a timespan trace in the Lighthouse panel and then interact with the page.
Similarly the Snapshot mode lets you take a Lighthouse audit in the exact state the page is in without reloading it.
These modes can be scripted with Puppeteer, but Lighthouse in DevTools allows easier set up of specific scenarios. Interacting with the page directly is almost always easier than scripting a solution.
Device and Category selection
Many Lighthouse tools (for example PageSpeed Insights) don't offer the option to choose the device type or audit categories but these can be selected in DevTools.
This can make Lighthouse audits faster if you're only interested in a specific category.
Advanced settings
The Settings button provides access to more settings:
- Clear storage: Which clears site storage on an audit to better simulate a clearer first load experience.
- Enable JS sampling: Which provides more sampling data, which is useful when opening the DevTools trace in the Performance panel.
- Throttling drop-down: Which allows switching between Lighthouse simulated throttling (which will be faster, but the performance numbers will be scaled) and DevTools throttling settings (which means when you open the trace in the Performance panel it will match the Lighthouse numbers).
Lighthouse is influenced by your setup
An important consideration is that Lighthouse is influenced by your setup, including other load happening on your device, Chrome extensions, and any device settings you've stored in cookies, local storage, or similar.
It is often recommend to run Lighthouse in incognito mode but even then this may still be subject to these influences.
This also means you cannot directly compare two Lighthouse audits completed on different machines.
By contrast, PageSpeed Insights or CI tools run on separate servers may produce a "cleaner" and more consistent Lighthouse audits that are easier to compare over different runs.
Post-run options
Other features are available after the run has completed in the "three dots" menu option that replaces Settings button:
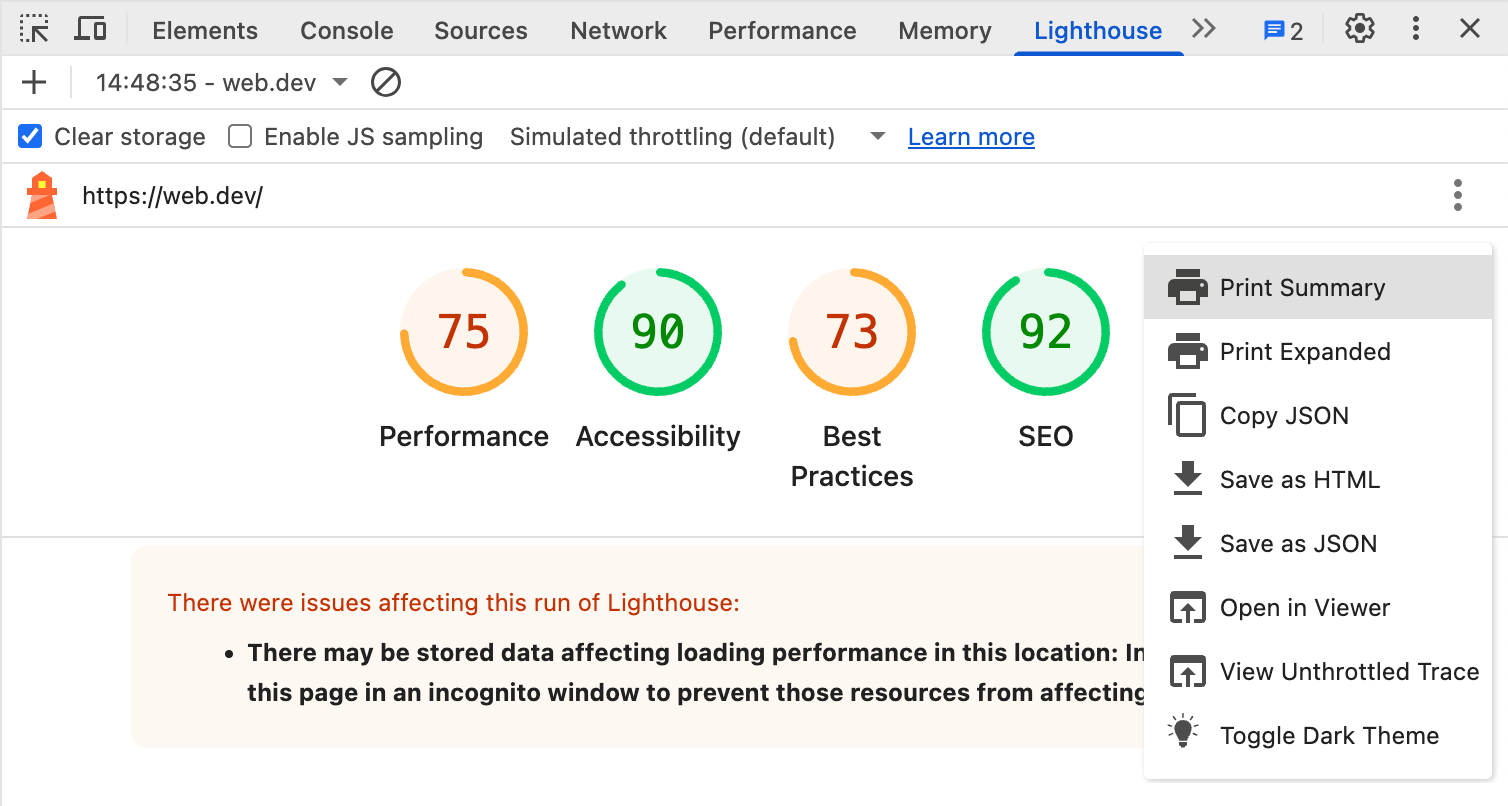
You can choose to Print, Copy, or Save the audit details or Open this outside of DevTools in a separate viewer.
One other option is to view the trace in the Performance panel as a Lighthouse performance audit is basically a form of a Performance panel trace and both share the same trace engine.
The final option lets you toggle Dark mode for the Lighthouse report.
Conclusion
The Lighthouse panel in DevTools provides access run Lighthouse reports for the page you're debugging in Chrome including some features that are easier to use than in other Lighthouse tooling.
We recommend the Performance panel for performance debugging as this provides similar performance insights to Lighthouse but with much more detail, but users may still prefer the familiarity of Lighthouse.
Additionally Lighthouse provides other audits to help identify and improve Accessibility, SEO, and other Best Practices.