

This is a hands-on tutorial of some of the most commonly-used DevTools features related to inspecting a page's network activity.
See Network Reference if you'd like to browse features instead.
Read on, or watch the video version of this tutorial:
When to use the Network panel
In general, use the Network panel when you need to make sure that resources are being downloaded or uploaded as expected. The most common use cases for the Network panel are:
- Making sure that resources are actually being uploaded or downloaded at all.
- Inspecting the properties of an individual resource, such as its HTTP headers, content, size, and so on.
If you're looking for ways to improve page load performance, don't start with the Network panel. There are many types of load performance issues that aren't related to network activity. Start with the Lighthouse panel because it gives you targeted suggestions on how to improve your page. See Optimize Website Speed.
Open the Network panel
To get the most out of this tutorial, open up the demo and try out the features on the demo page.
Open the Get Started Demo.
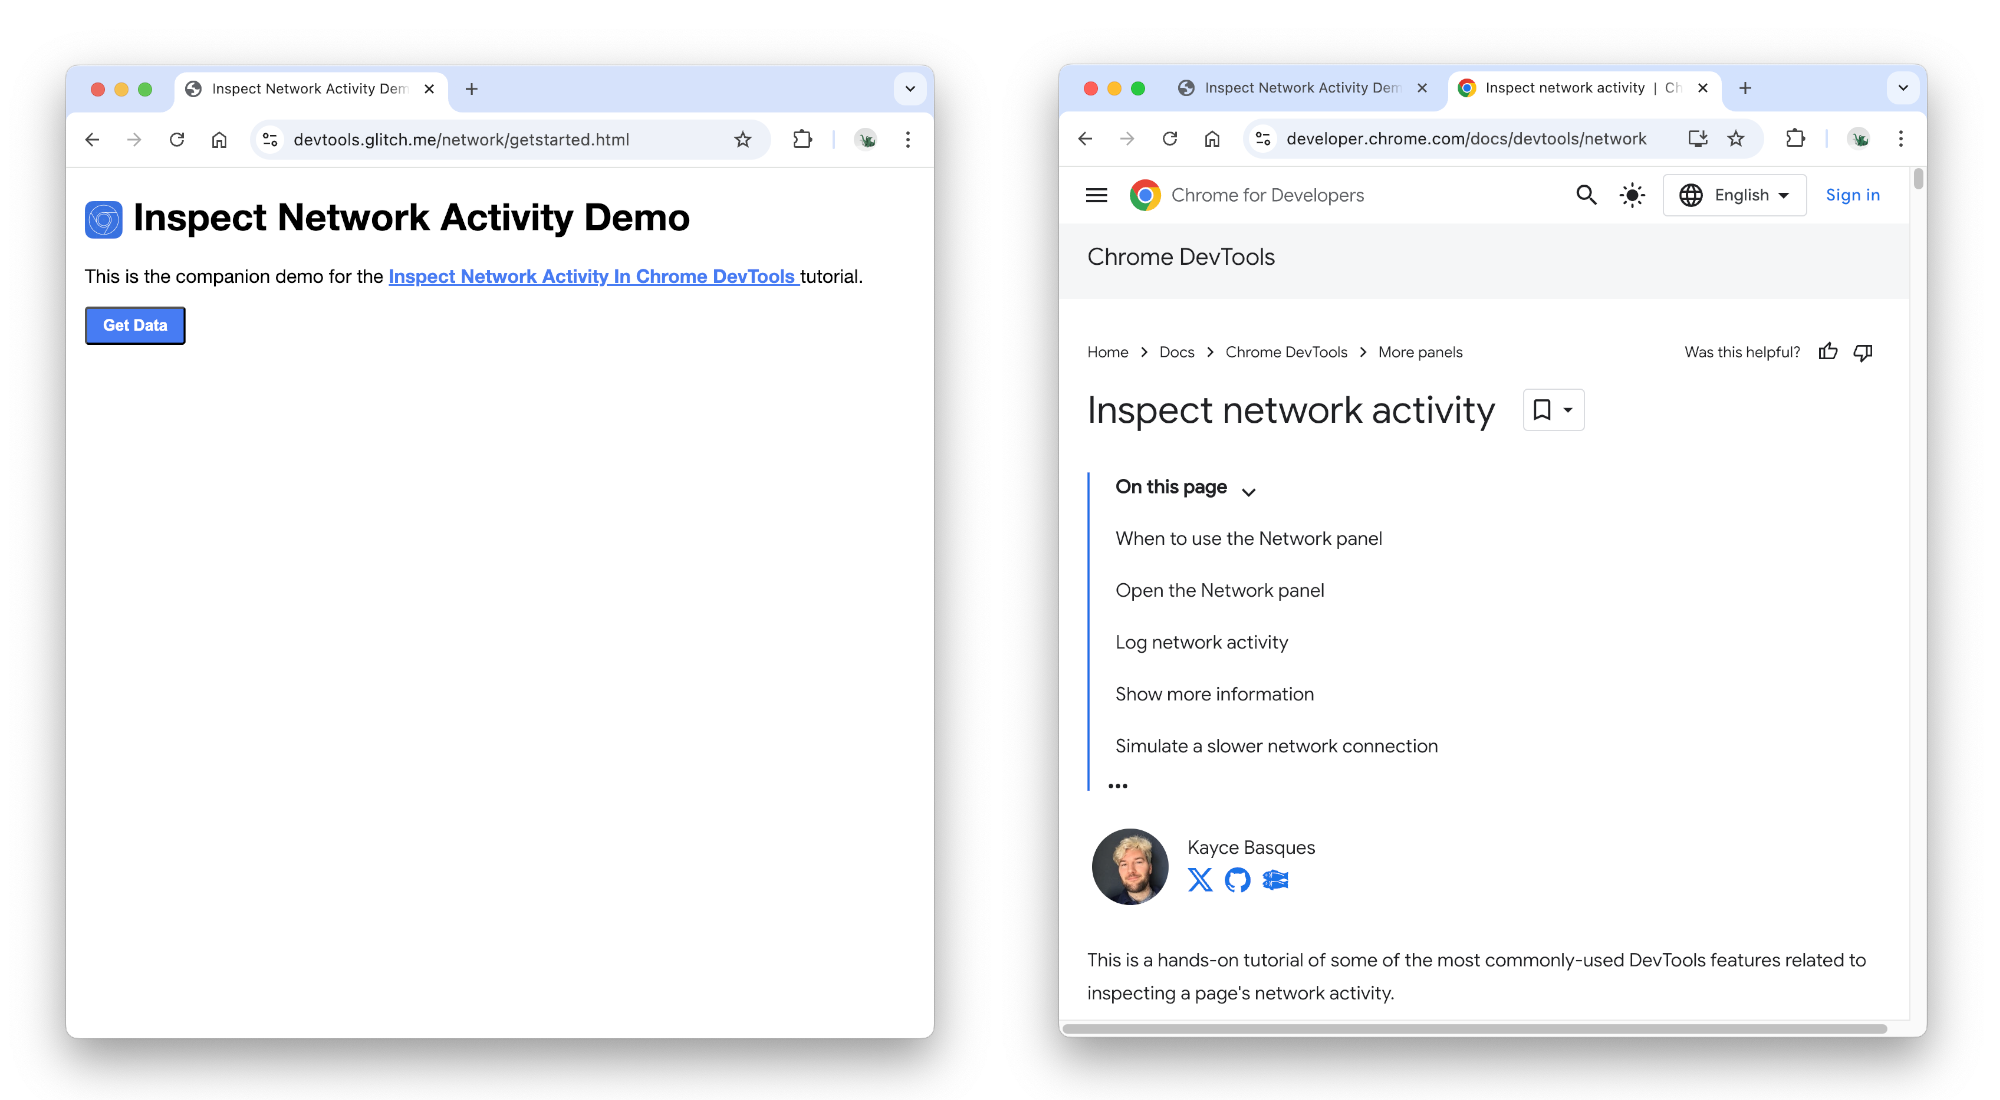
You might prefer to move the demo to a separate window.
Open DevTools by pressing Control+Shift+J or Command+Option+J (Mac). The Console panel opens.
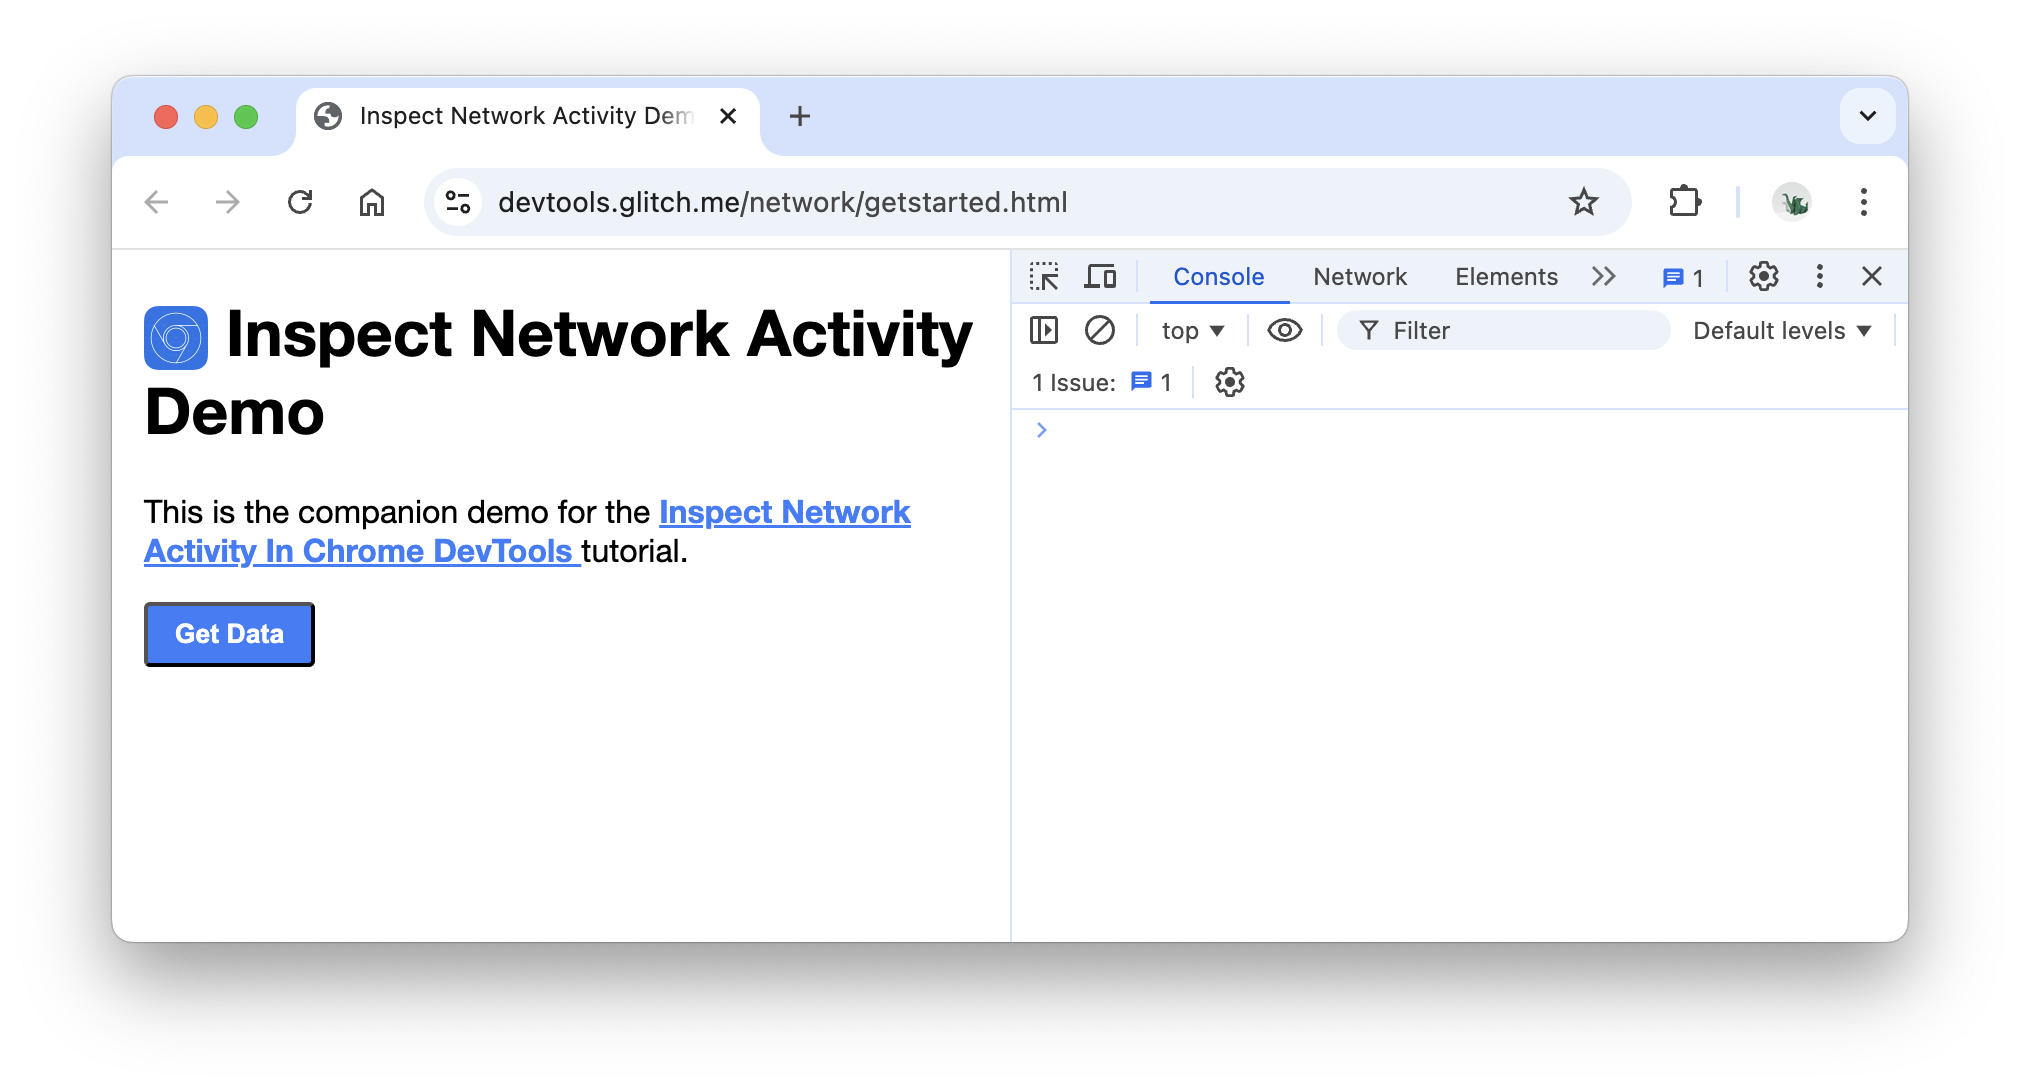
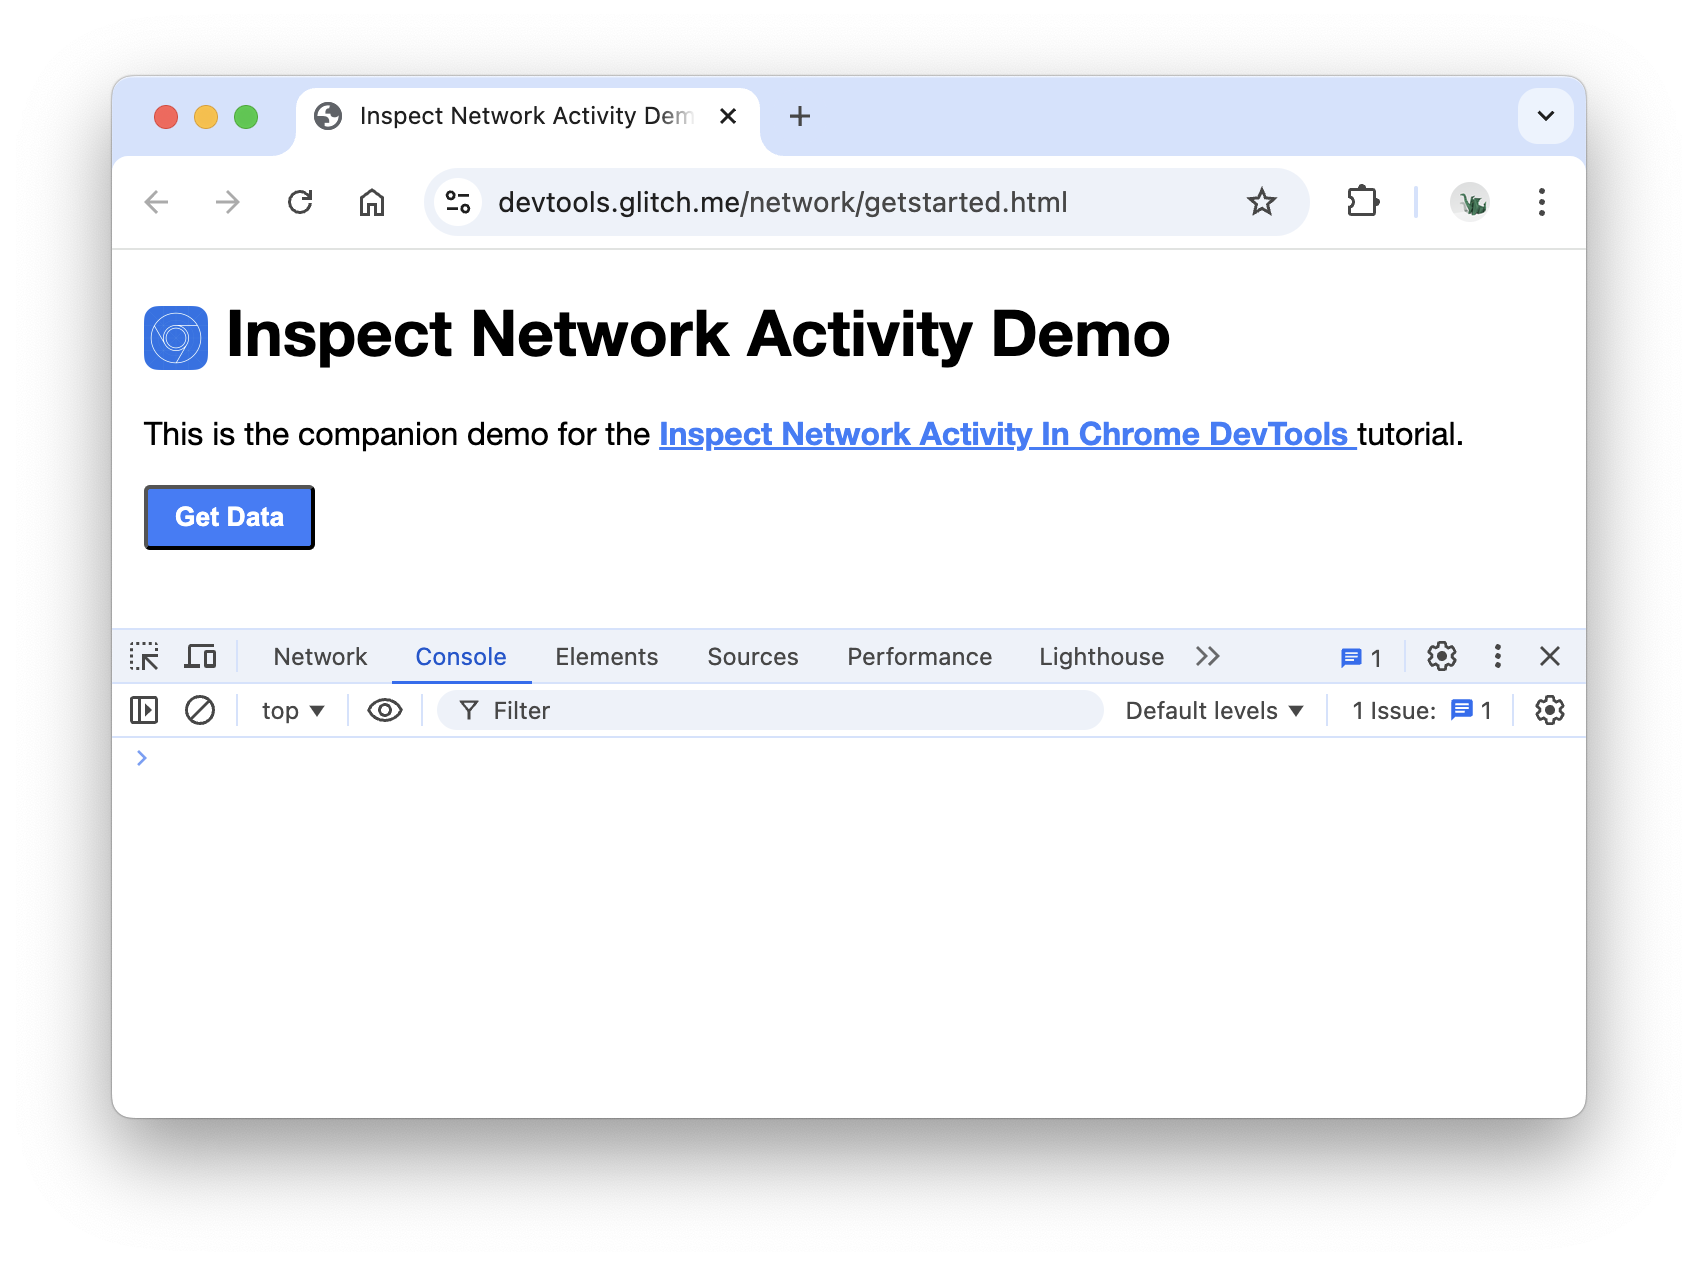
You might prefer to dock DevTools to the bottom of your window.
Click the Network tab. The Network panel opens.
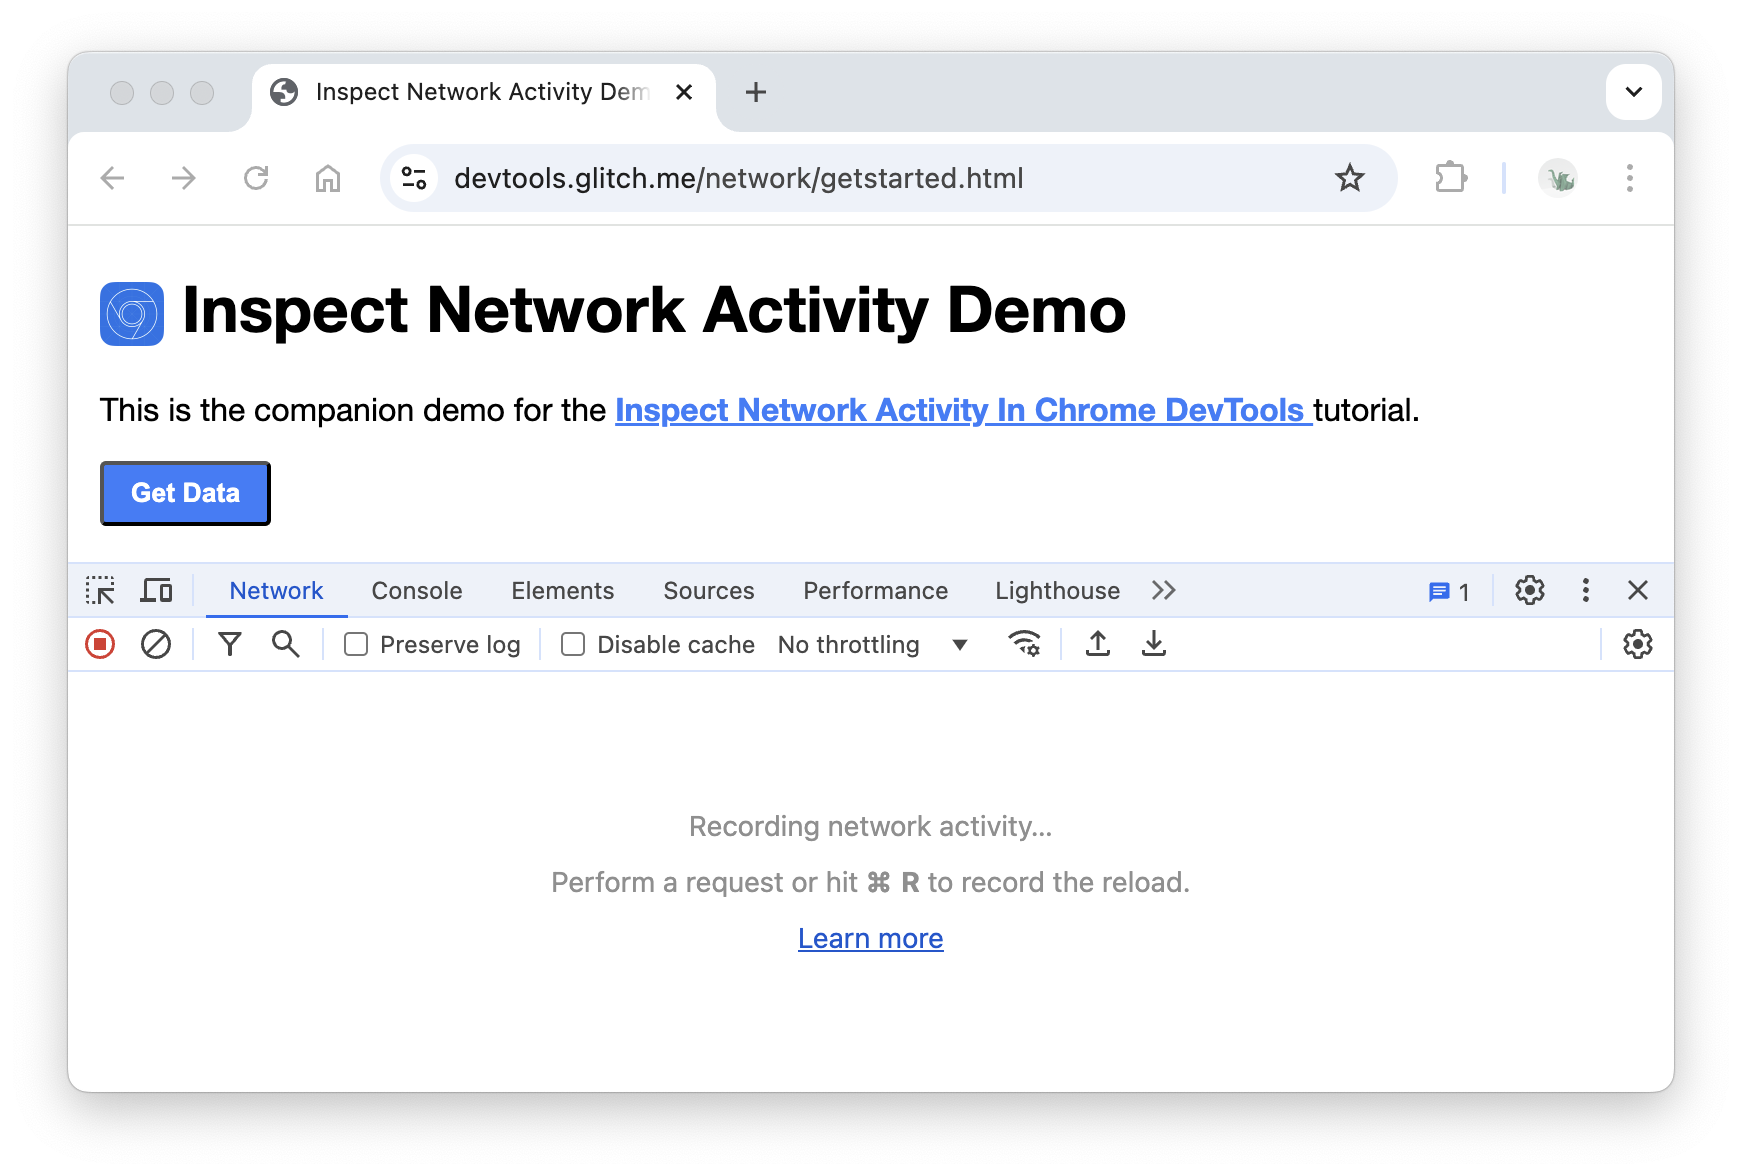
Right now the Network panel is empty. That's because DevTools only logs network activity while it's open and no network activity has occurred since you opened DevTools.
Log network activity
To view the network activity that a page causes:
Reload the page. The Network panel logs all network activity in the Network Log.
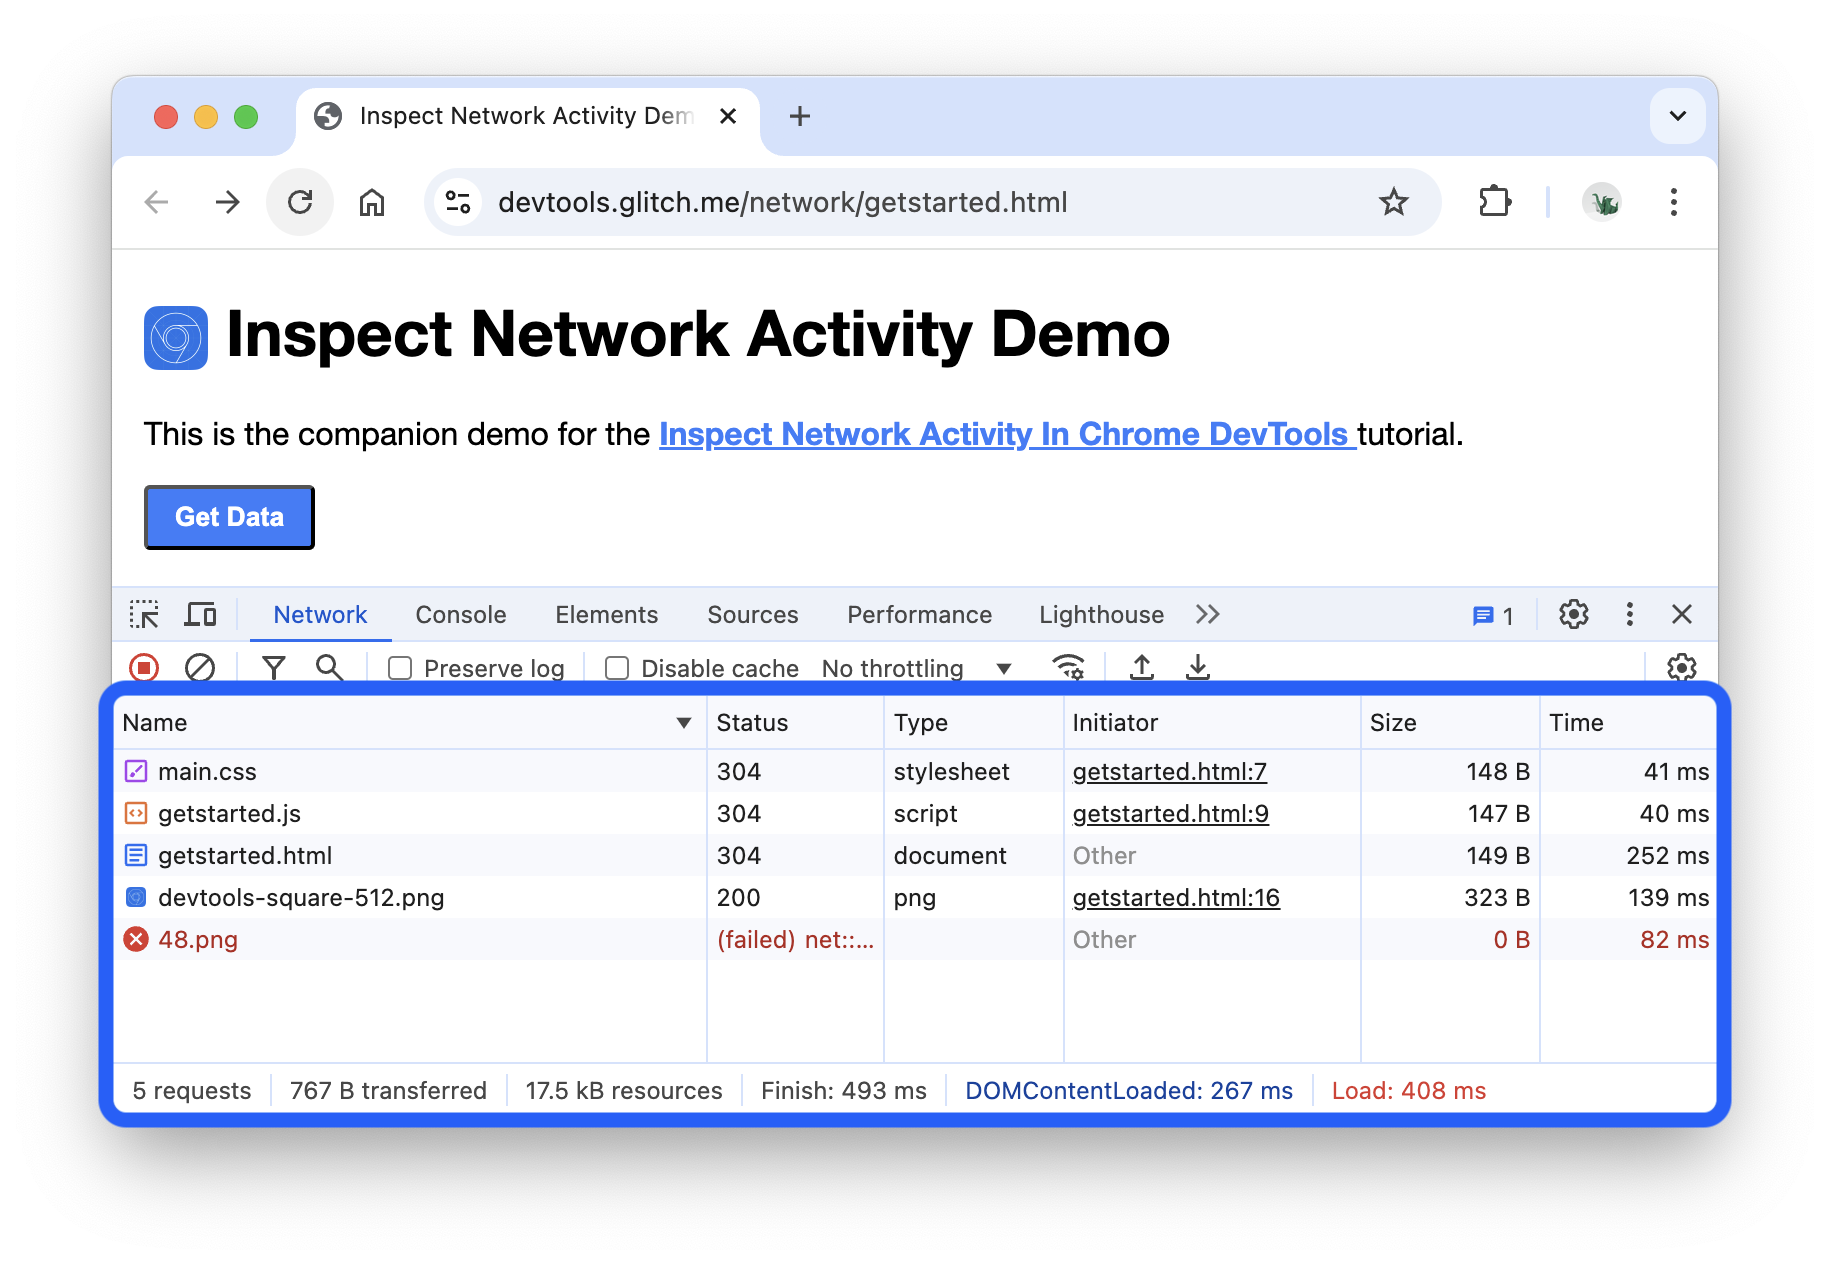
Each row of the Network Log represents a resource. By default the resources are listed chronologically. The top resource is usually the main HTML document. The bottom resource is whatever was requested last.
Each column represents information about a resource. The default columns are:
- Status: The HTTP response code.
- Type: The resource type.
- Initiator: What caused a resource to be requested. Clicking a link in the Initiator column takes you to the source code that caused the request.
- Size: Resource amount transferred over the network.
- Time: How long the request took.
So long as you've got DevTools open, it will record network activity in the Network Log. To demonstrate this, first look at the bottom of the Network Log and take note of the last activity.
Now, click the Get Data button in the demo.
Look at the bottom of the Network Log again. There's a new resource called
getstarted.json. Clicking the Get Data button caused the page to request this file.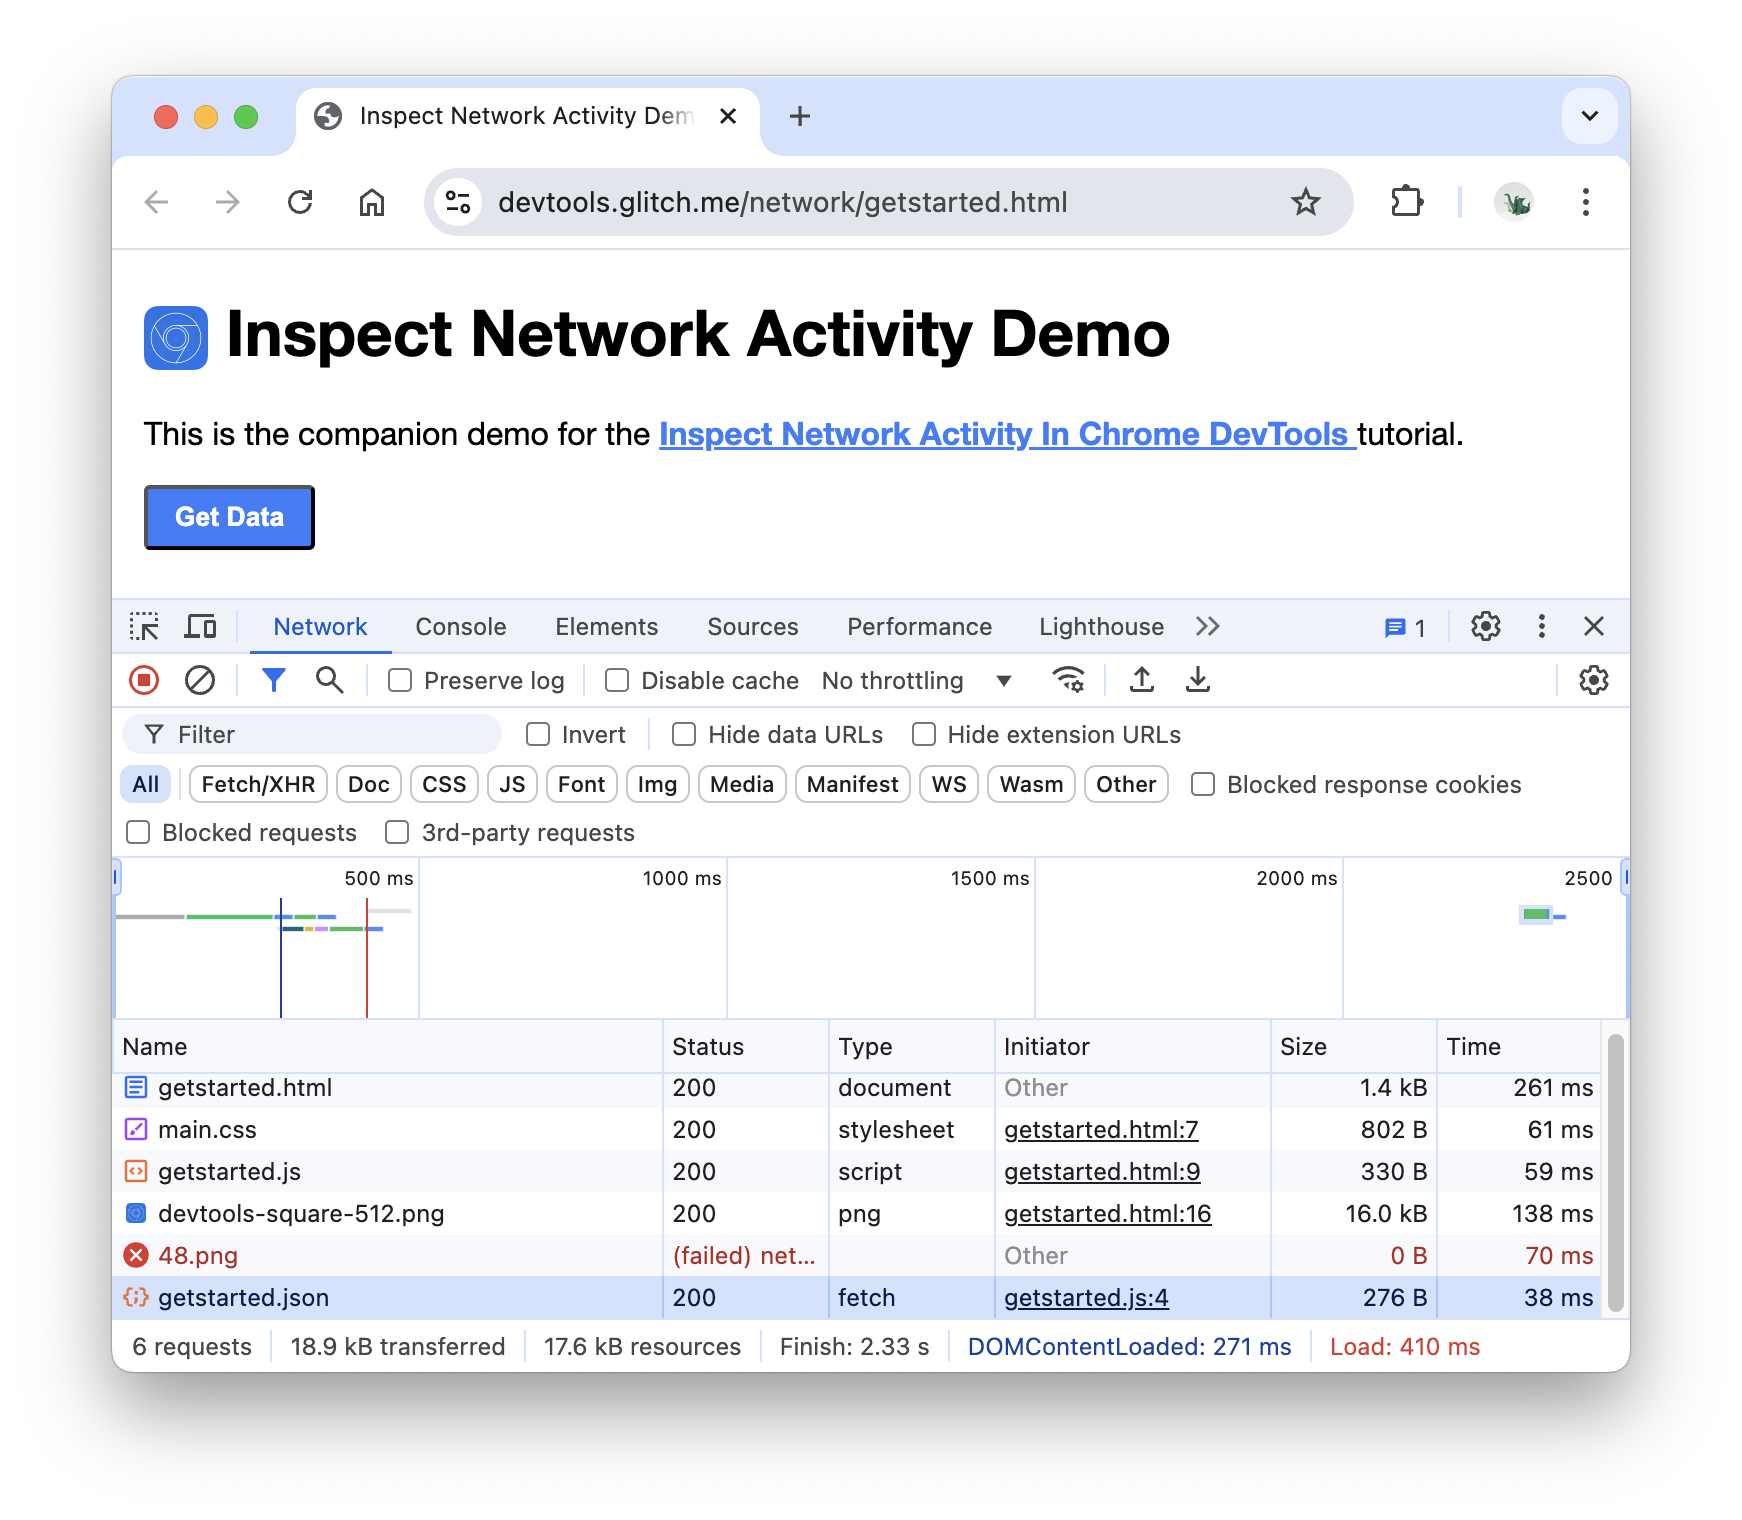
Show more information
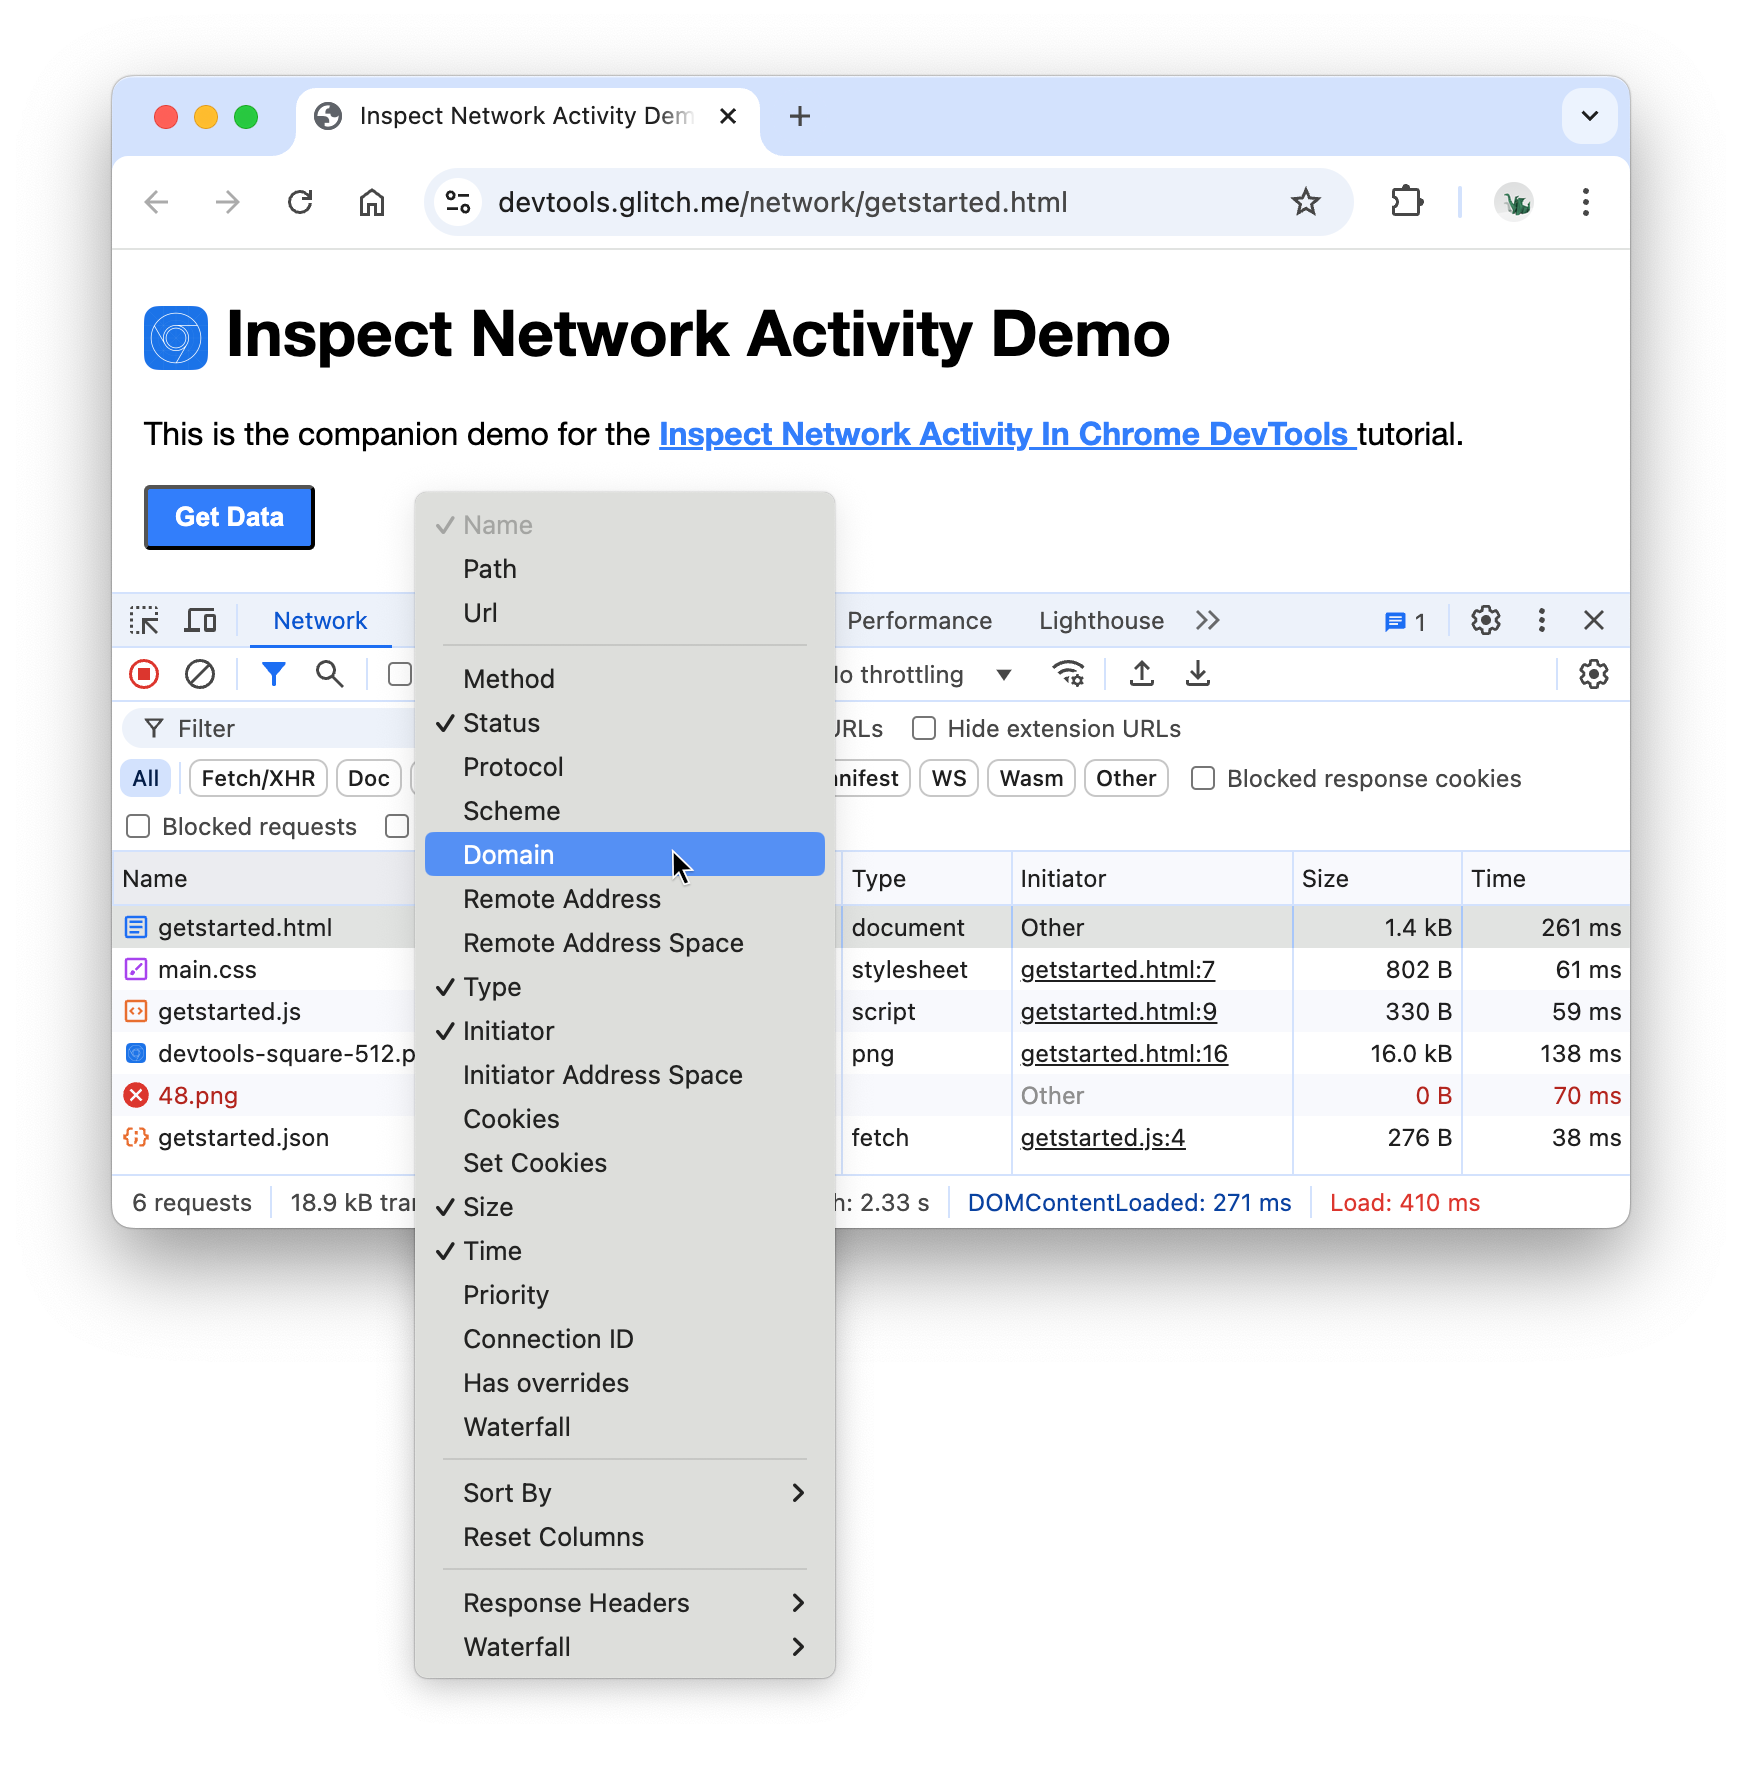
The columns of the Network Log are configurable. You can hide columns that you're not using. There are also many columns that are hidden by default which you may find useful.
Right-click the header of the Network Log table and select Domain. The domain of each resource is now shown.
Simulate a slower network connection
The network connection of the computer that you use to build sites is probably faster than the network connections of the mobile devices of your users. By throttling the page you can get a better idea of how long a page takes to load on a mobile device.
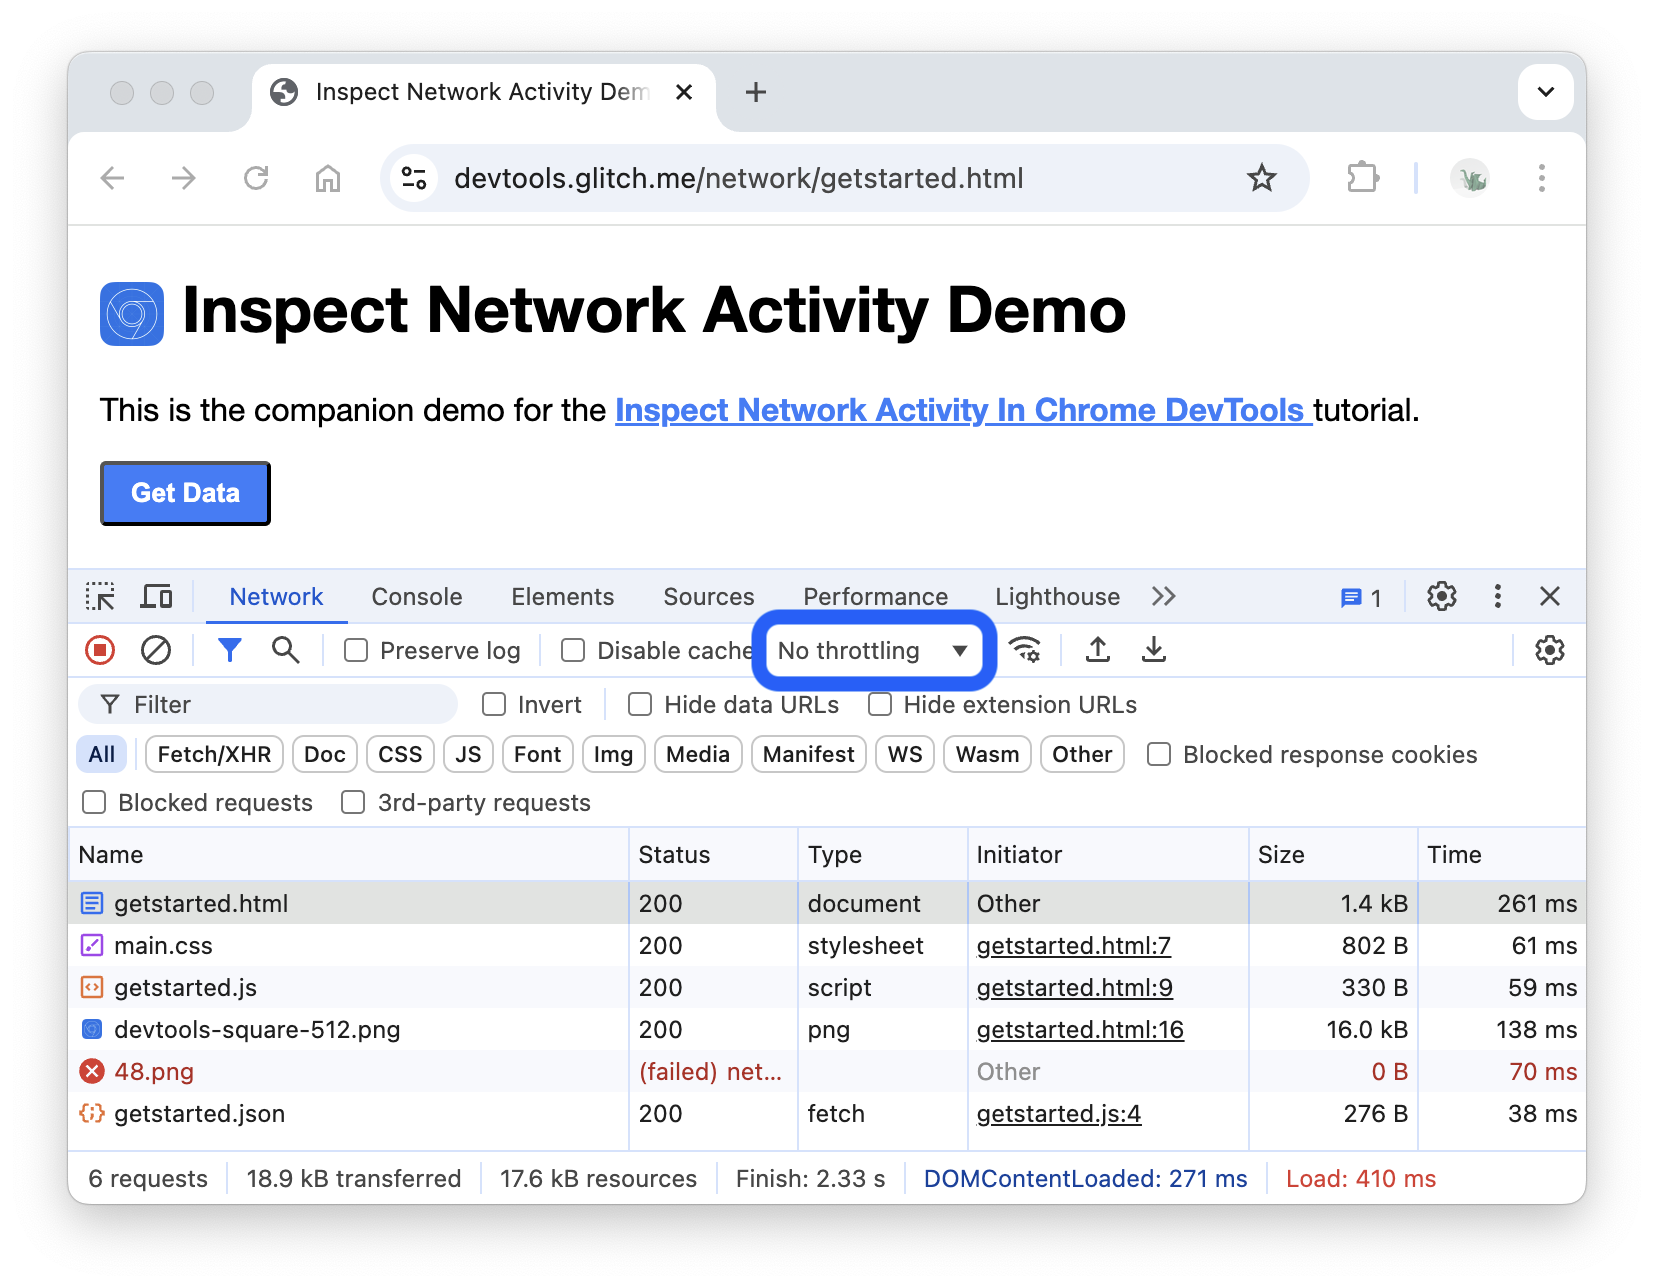
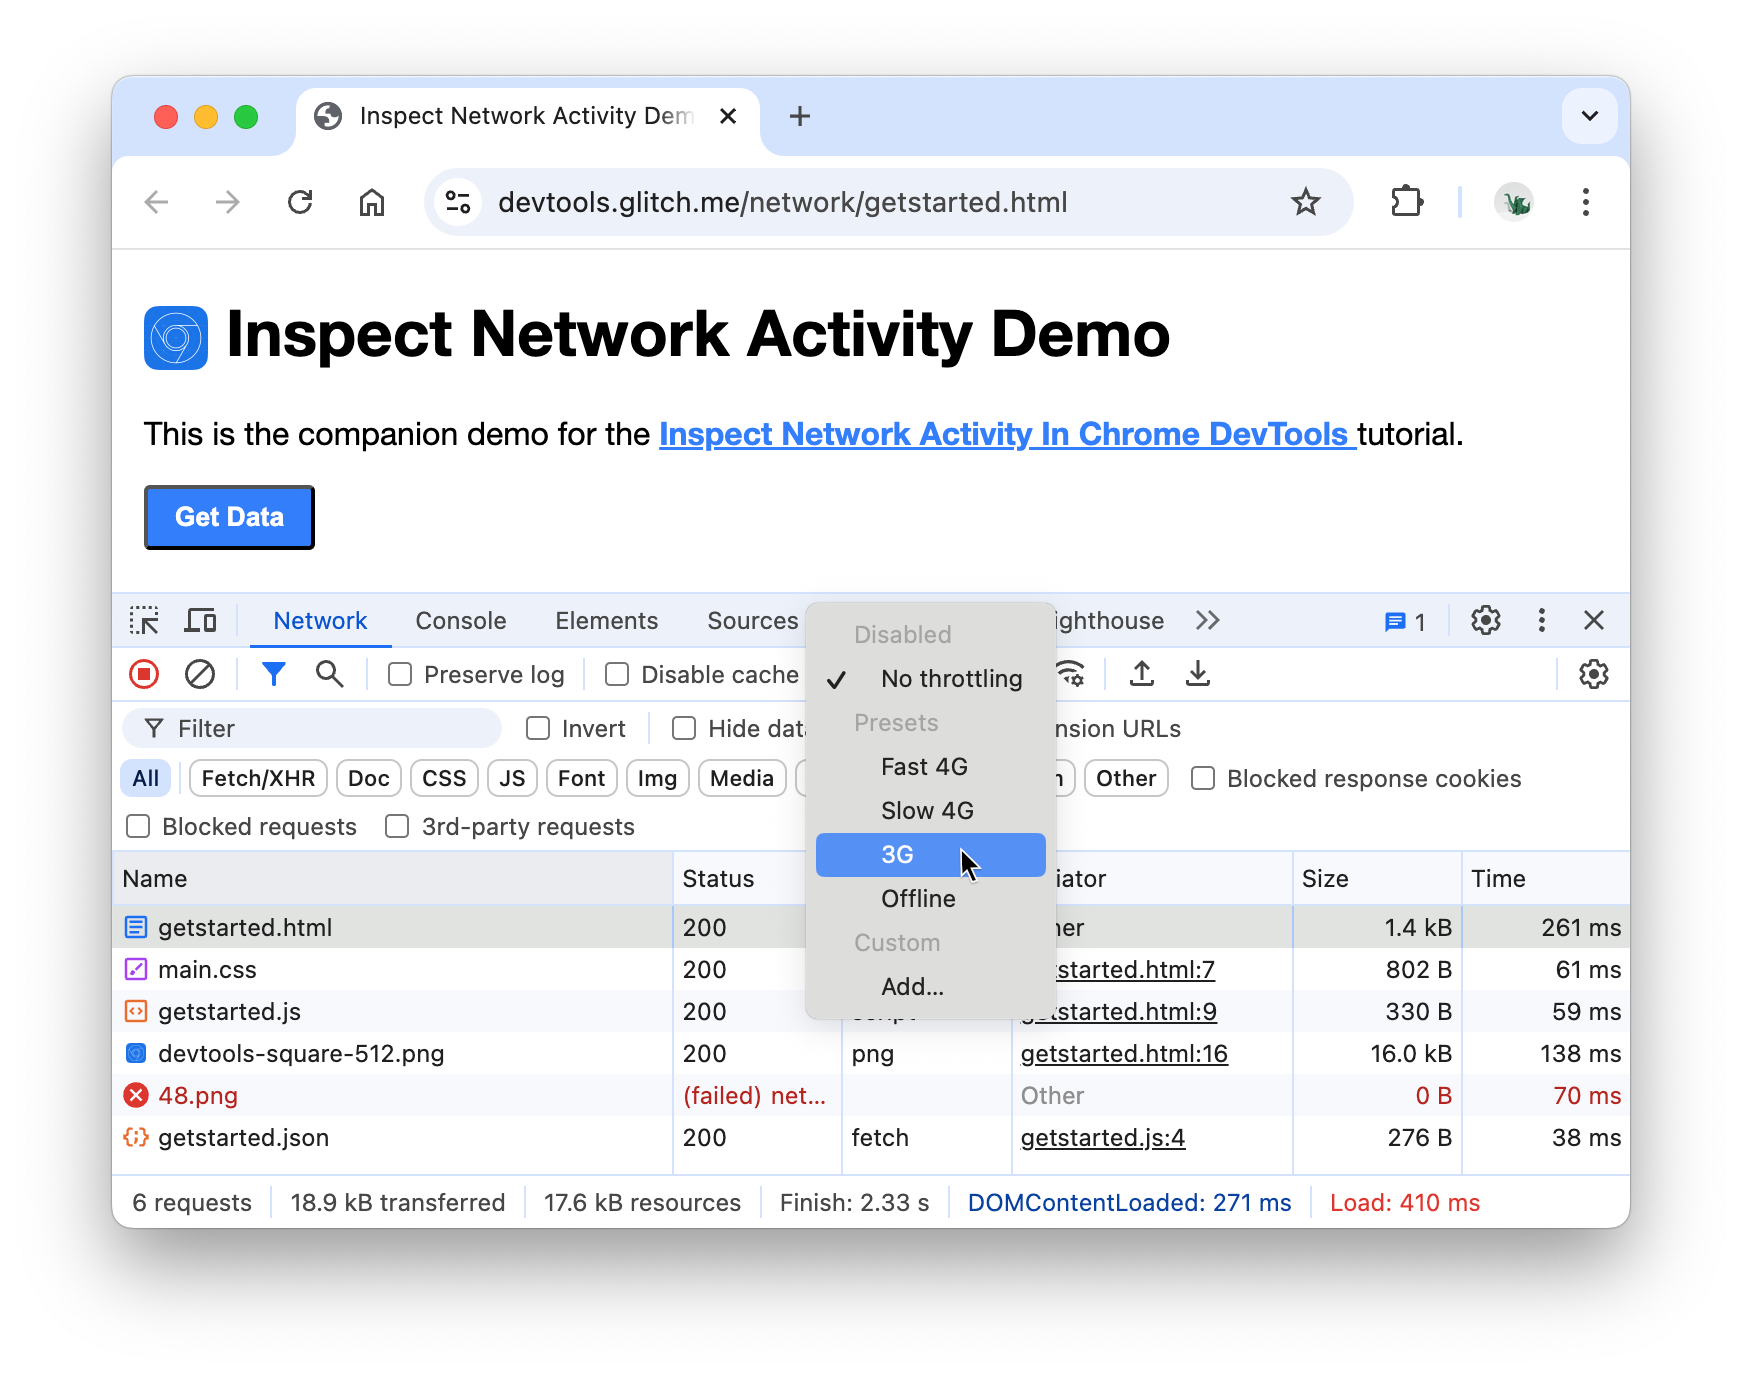
Click the Throttling drop-down, which is set to No throttling by default.
Select 3G.
Long-press Reload and then select Empty Cache And Hard Reload.
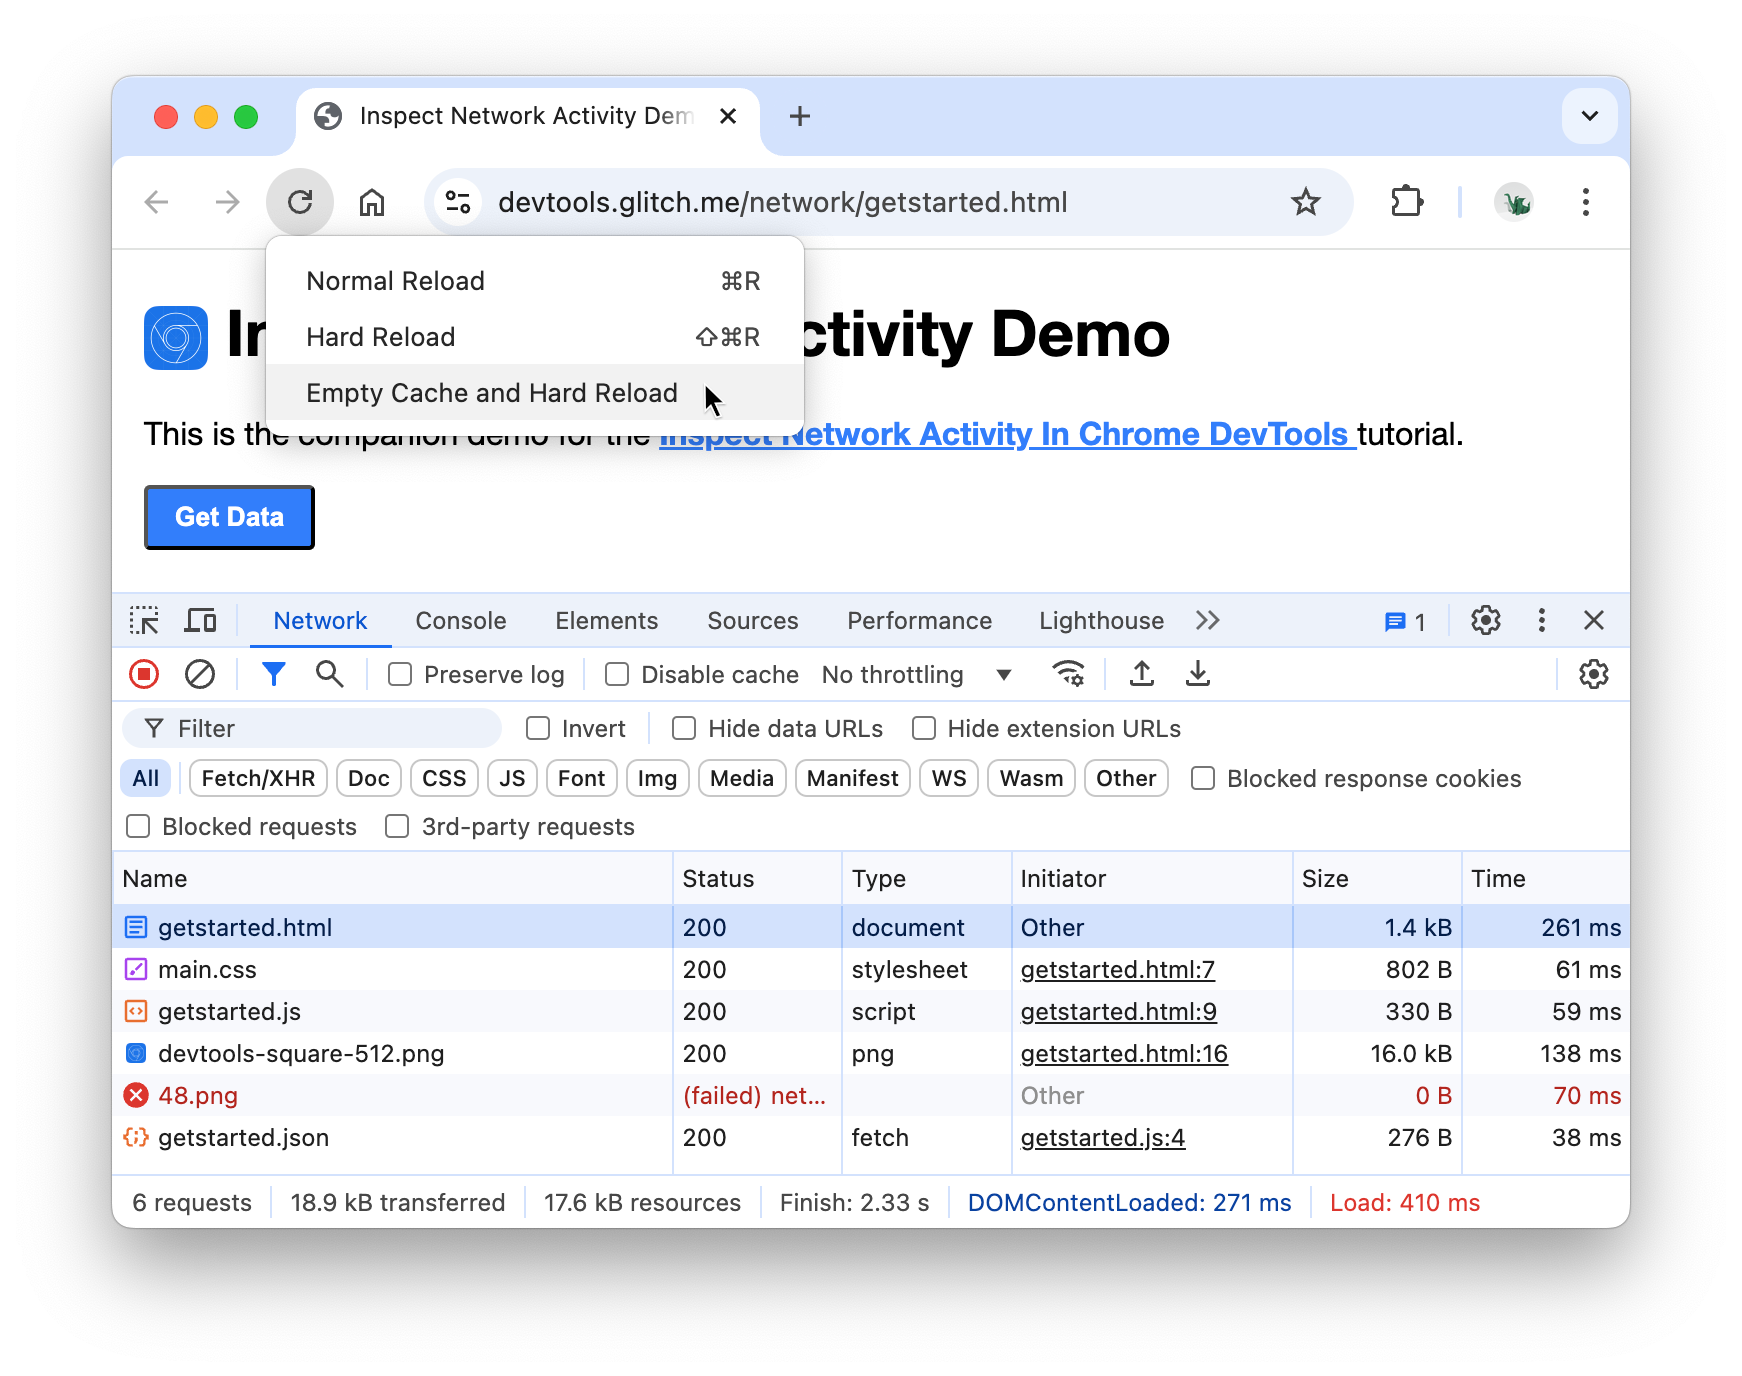
On repeat visits, the browser usually serves some files from its cache, which speeds up the page load. Empty Cache And Hard Reload forces the browser to go to the network for all resources. This is helpful when you want to see how a first-time visitor experiences a page load.
Capture screenshots
Screenshots capture how your page looks at different times while it loads, and reports what resources are loaded at each interval.
To capture screenshots, follow these steps:
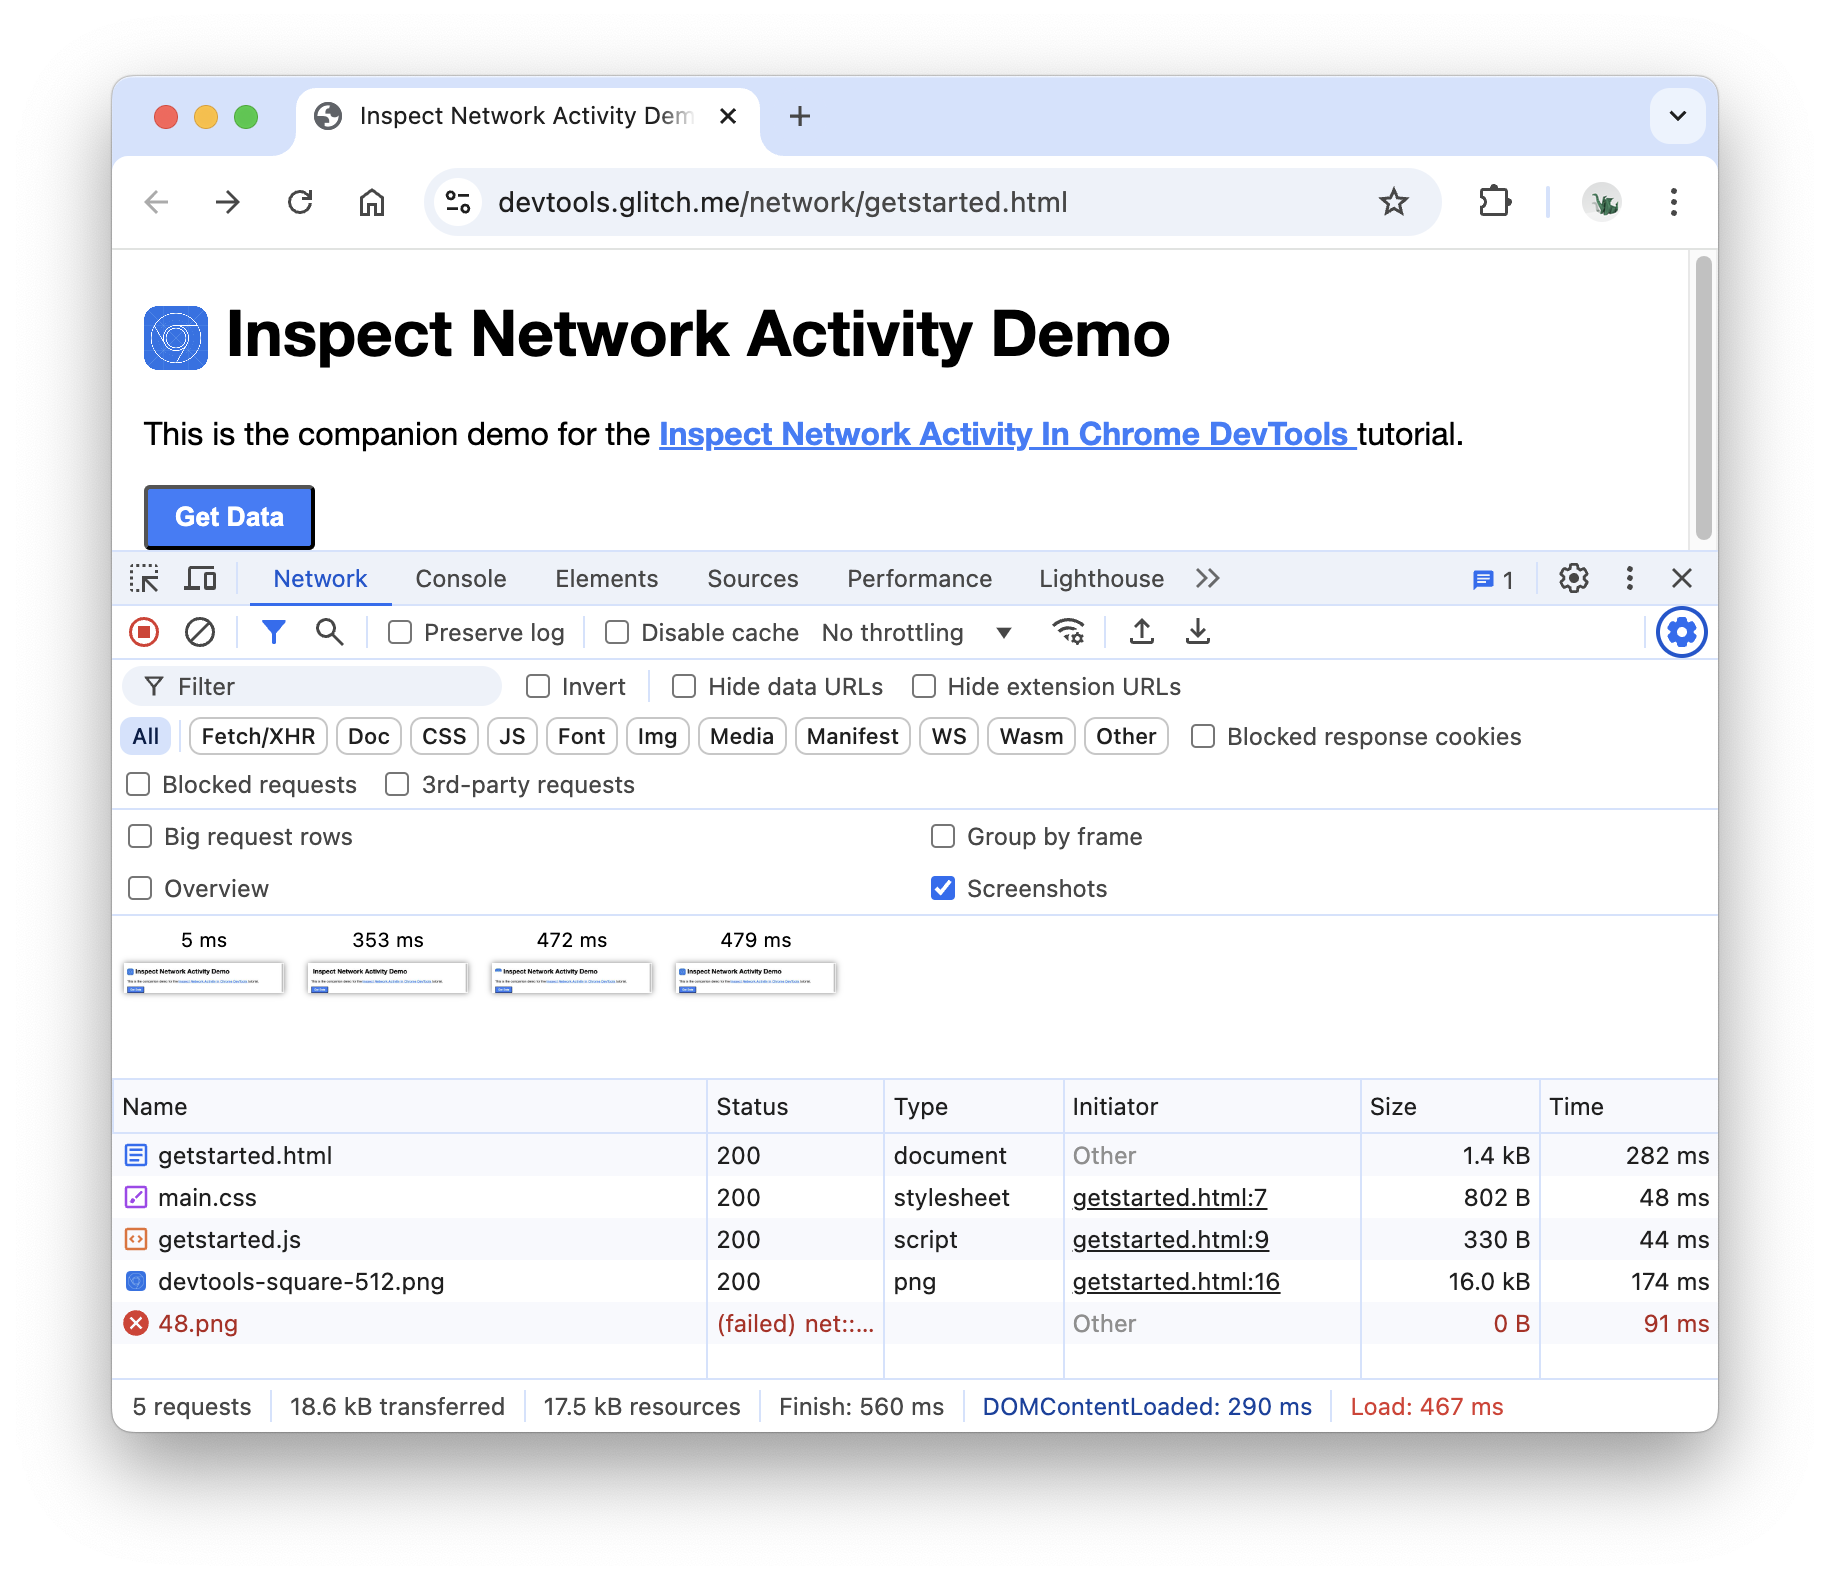
Click Network Settings .
Enable the Screenshots checkbox.
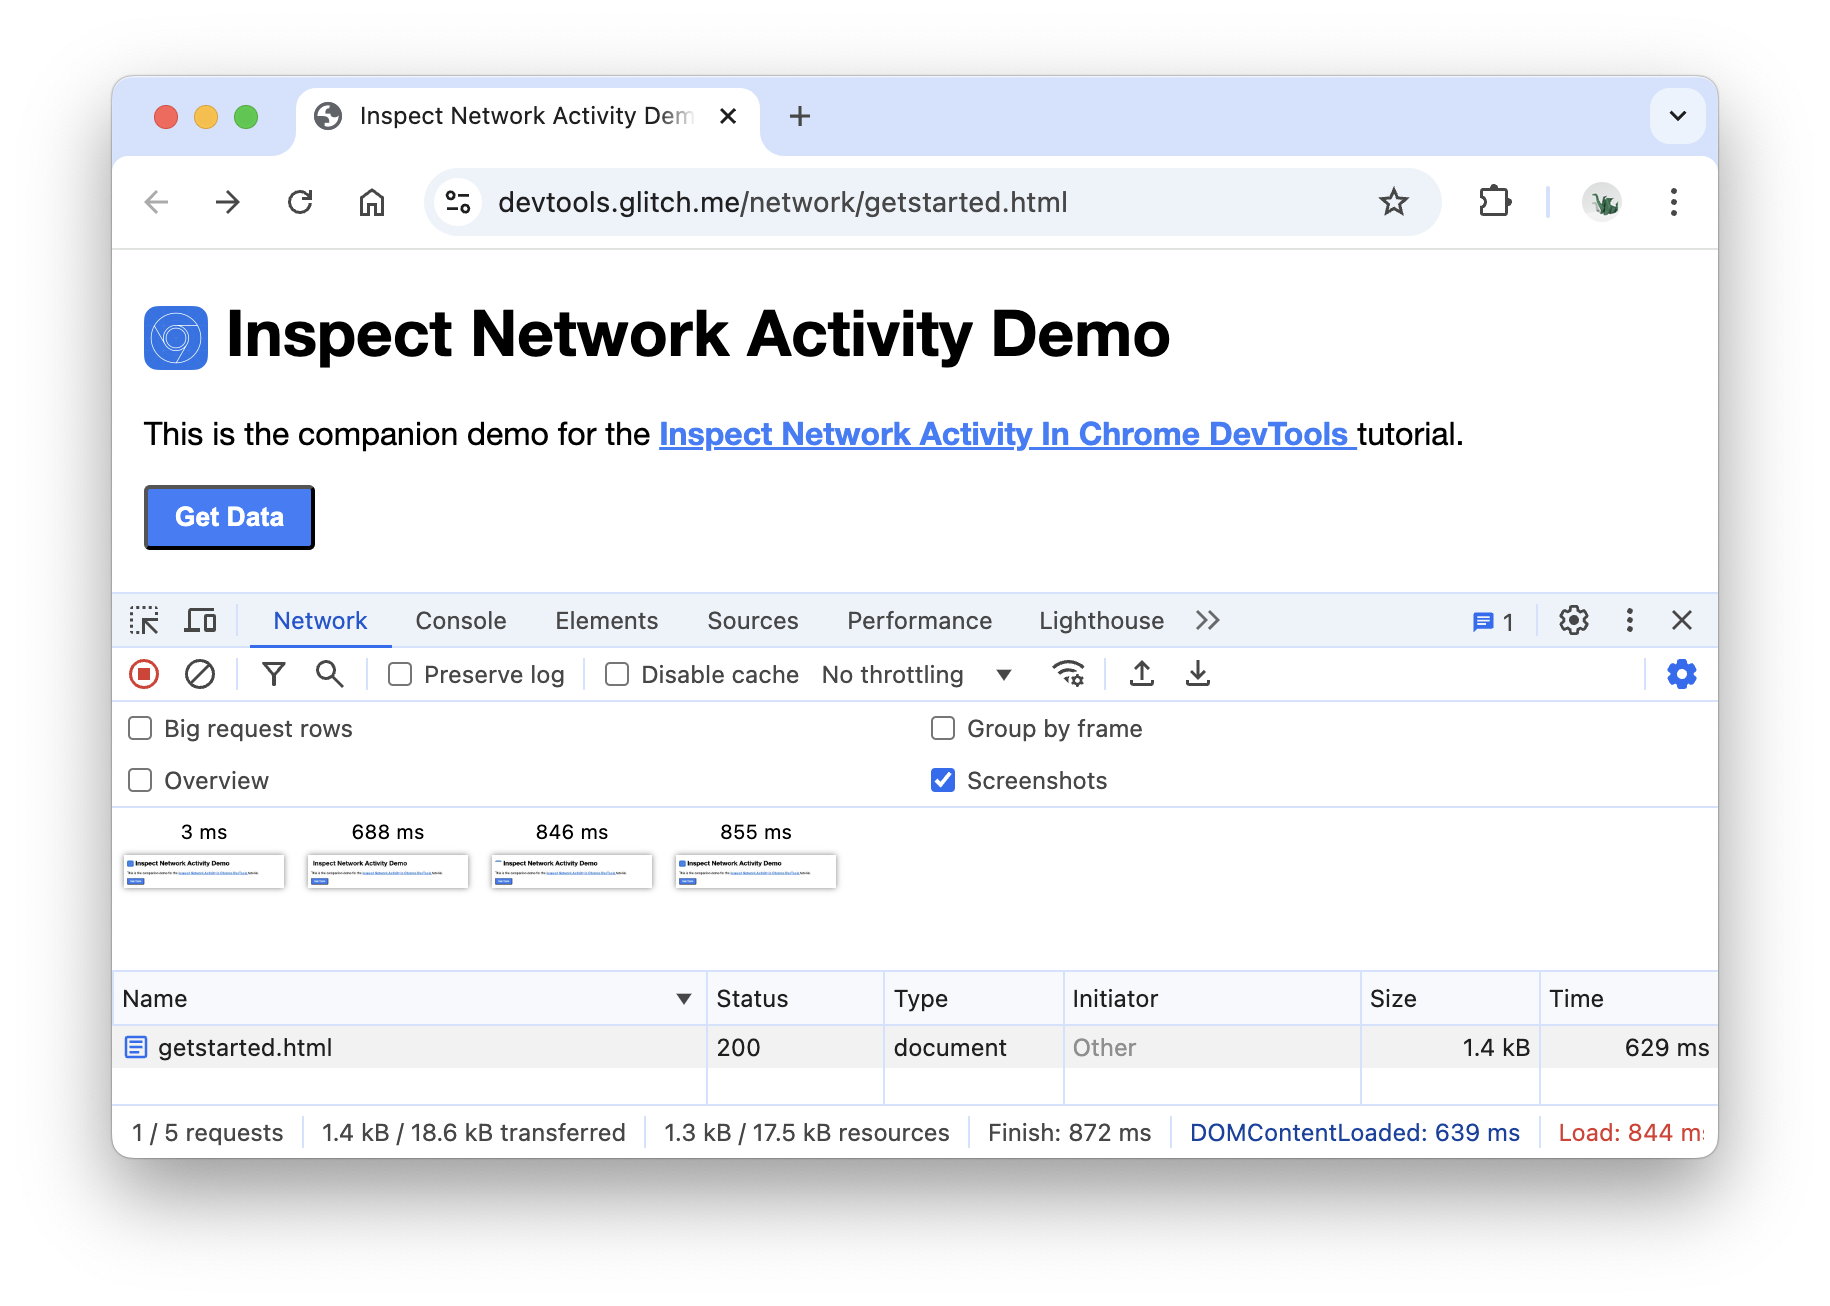
Reload the page again using the Empty Cache And Hard Reload workflow. See Simulate a slower connection if you need a reminder on how to do this. The Screenshots tab provides thumbnails of how the page looked at various points during the loading process.
Click the first thumbnail. DevTools shows you what network activity was occurring at that moment in time.
Toggle the Screenshots checkbox to close the Screenshots tab.
Reload the page again.
Inspect a resource's details
Click a resource to learn more information about it. Try it now:
Click
getstarted.html. The Headers tab is shown. Use this tab to inspect HTTP headers.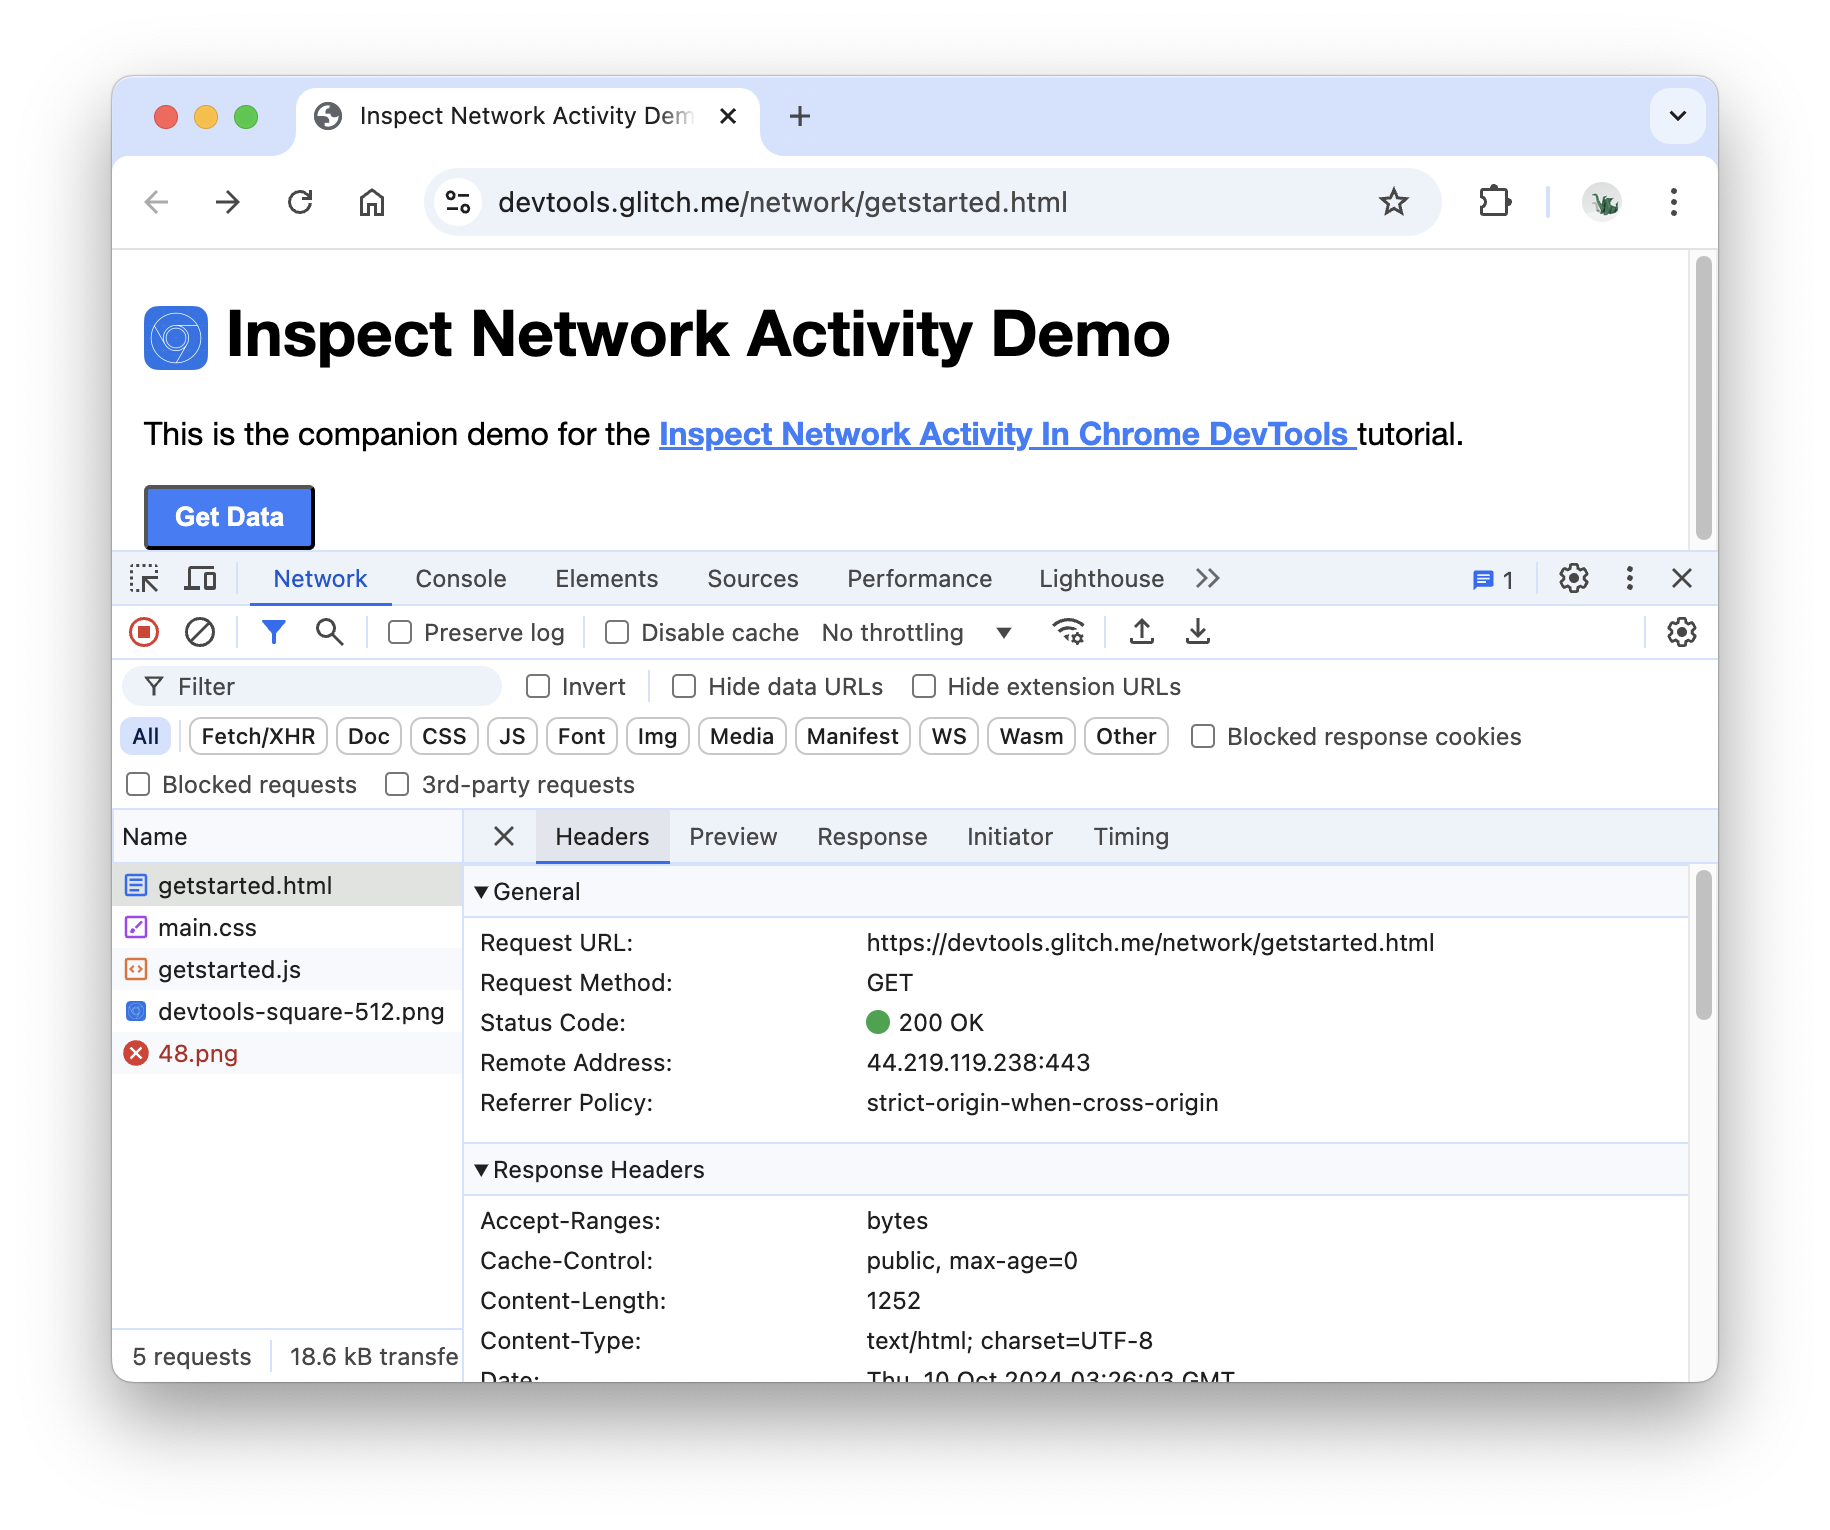
Click the Preview tab to view a basic HTML rendering.
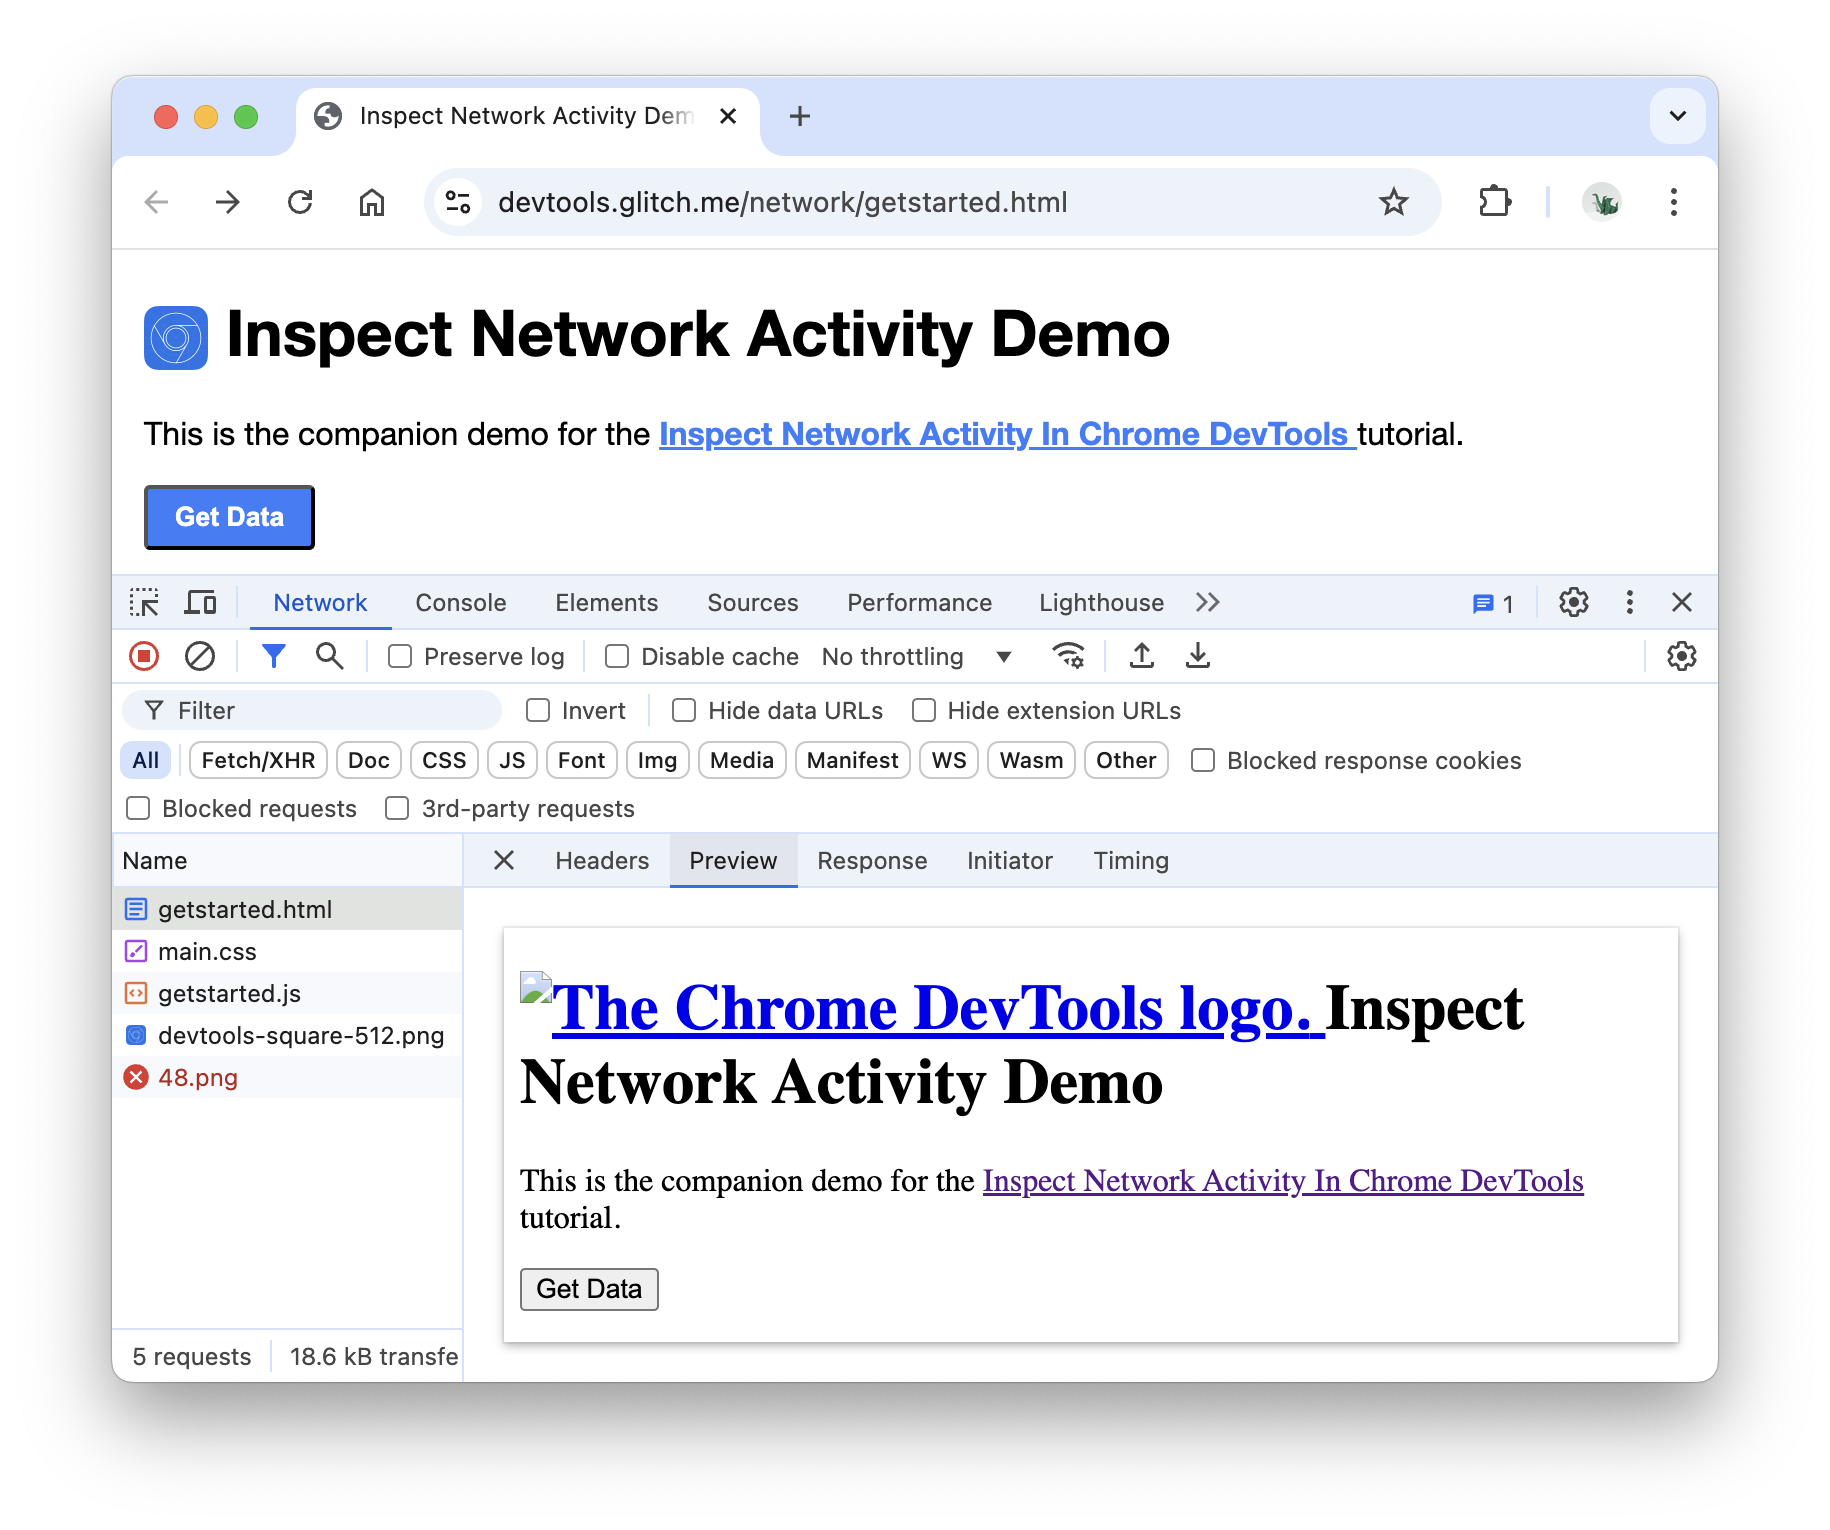
This tab is helpful when an API returns an error code in HTML and it's easier to read the rendered HTML than the HTML source code, or when inspecting images.
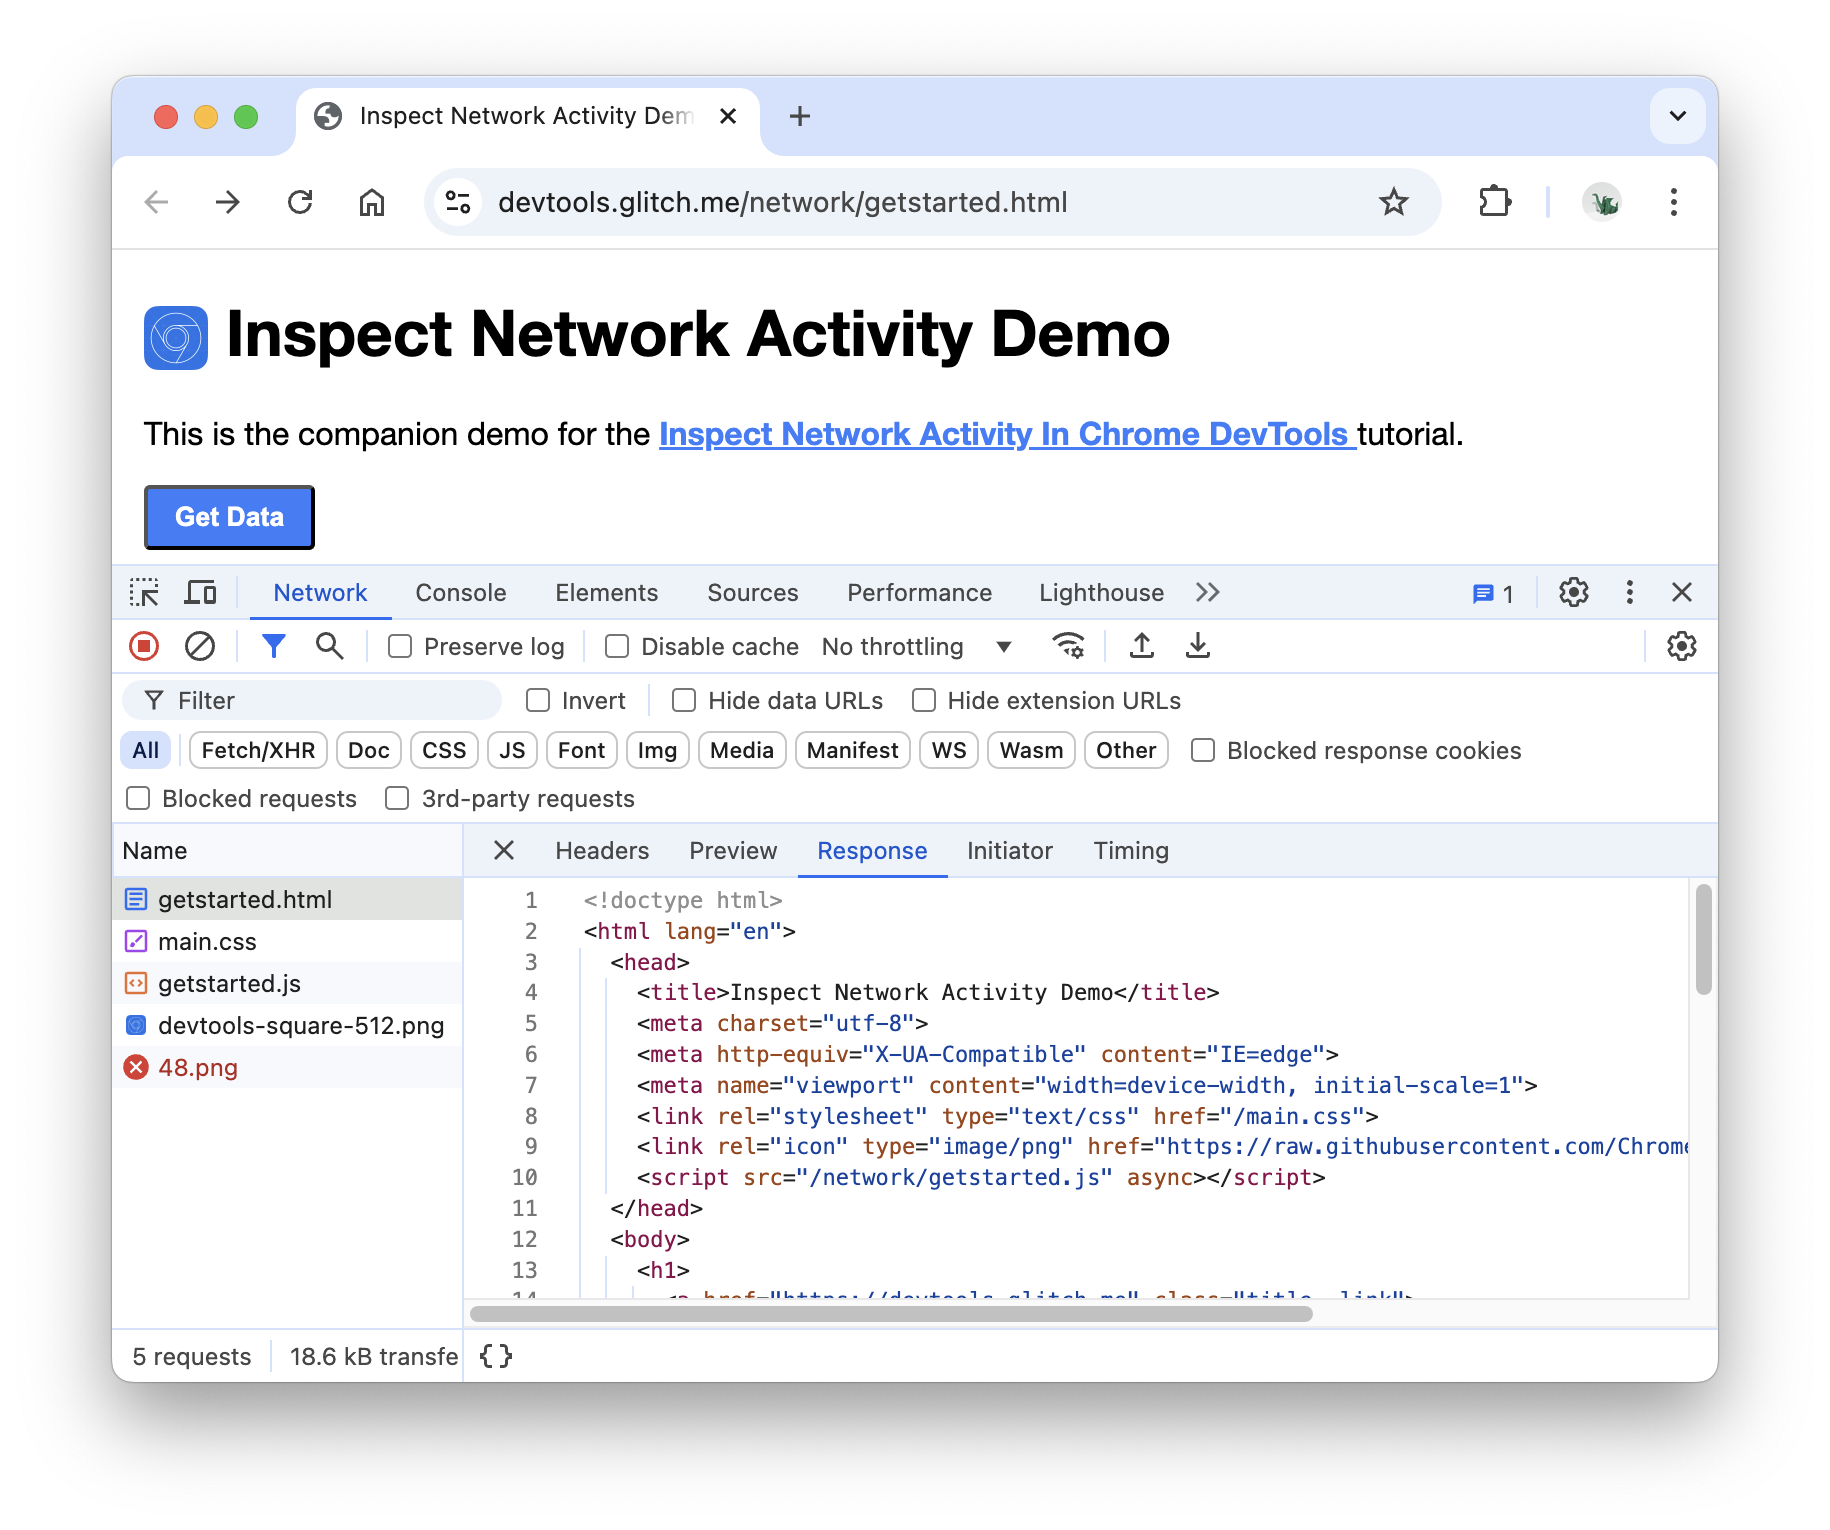
Click the Response tab to view the HTML source code.
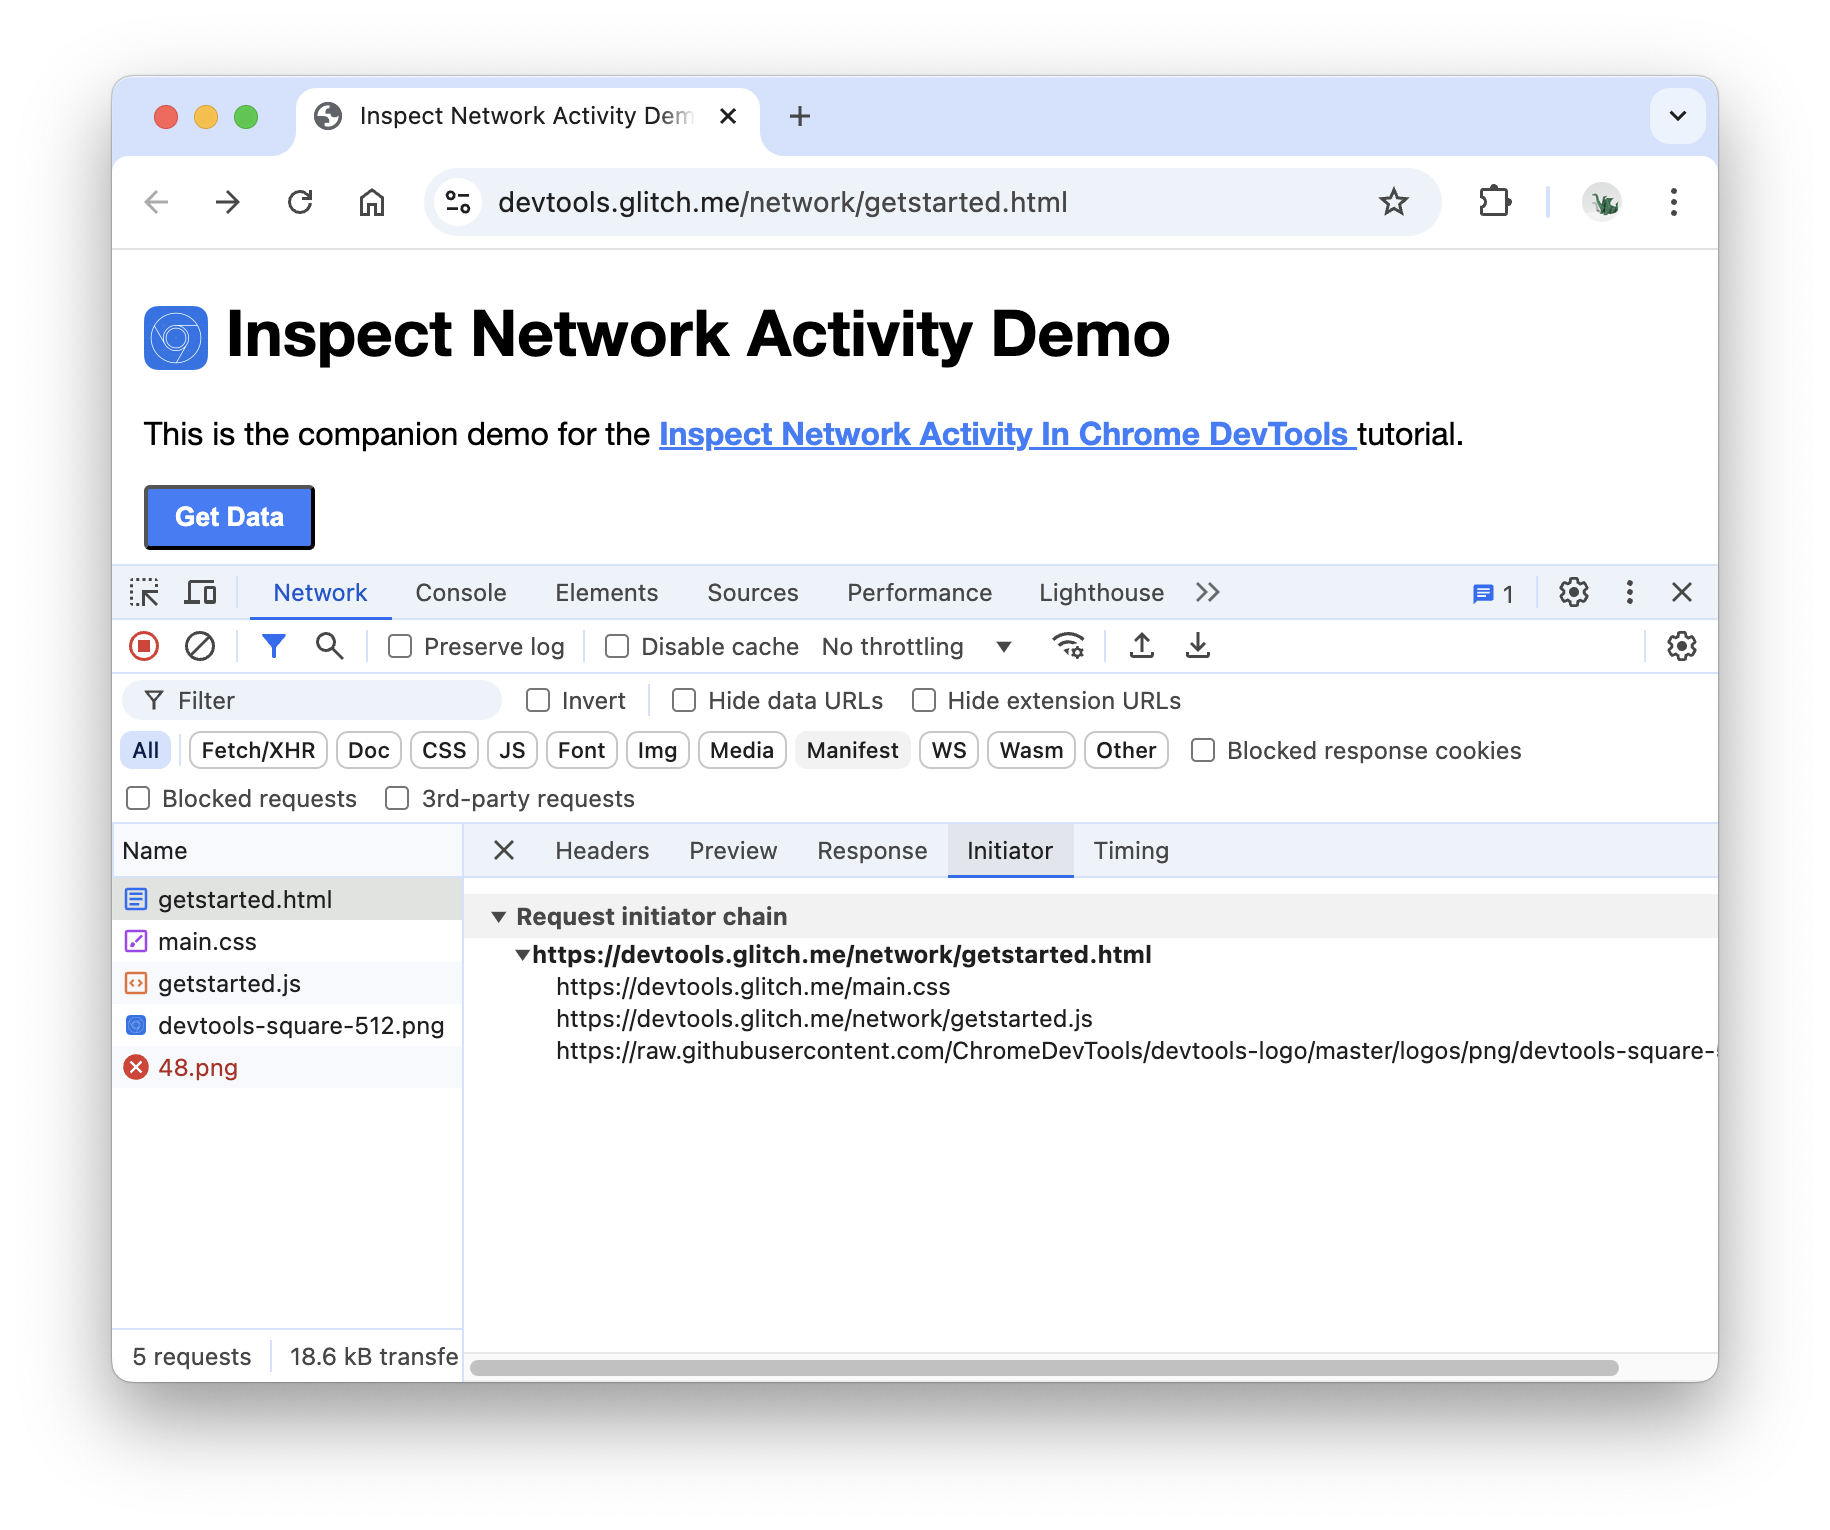
Click the Initiator tab to view a tree that maps the request initiator chain.
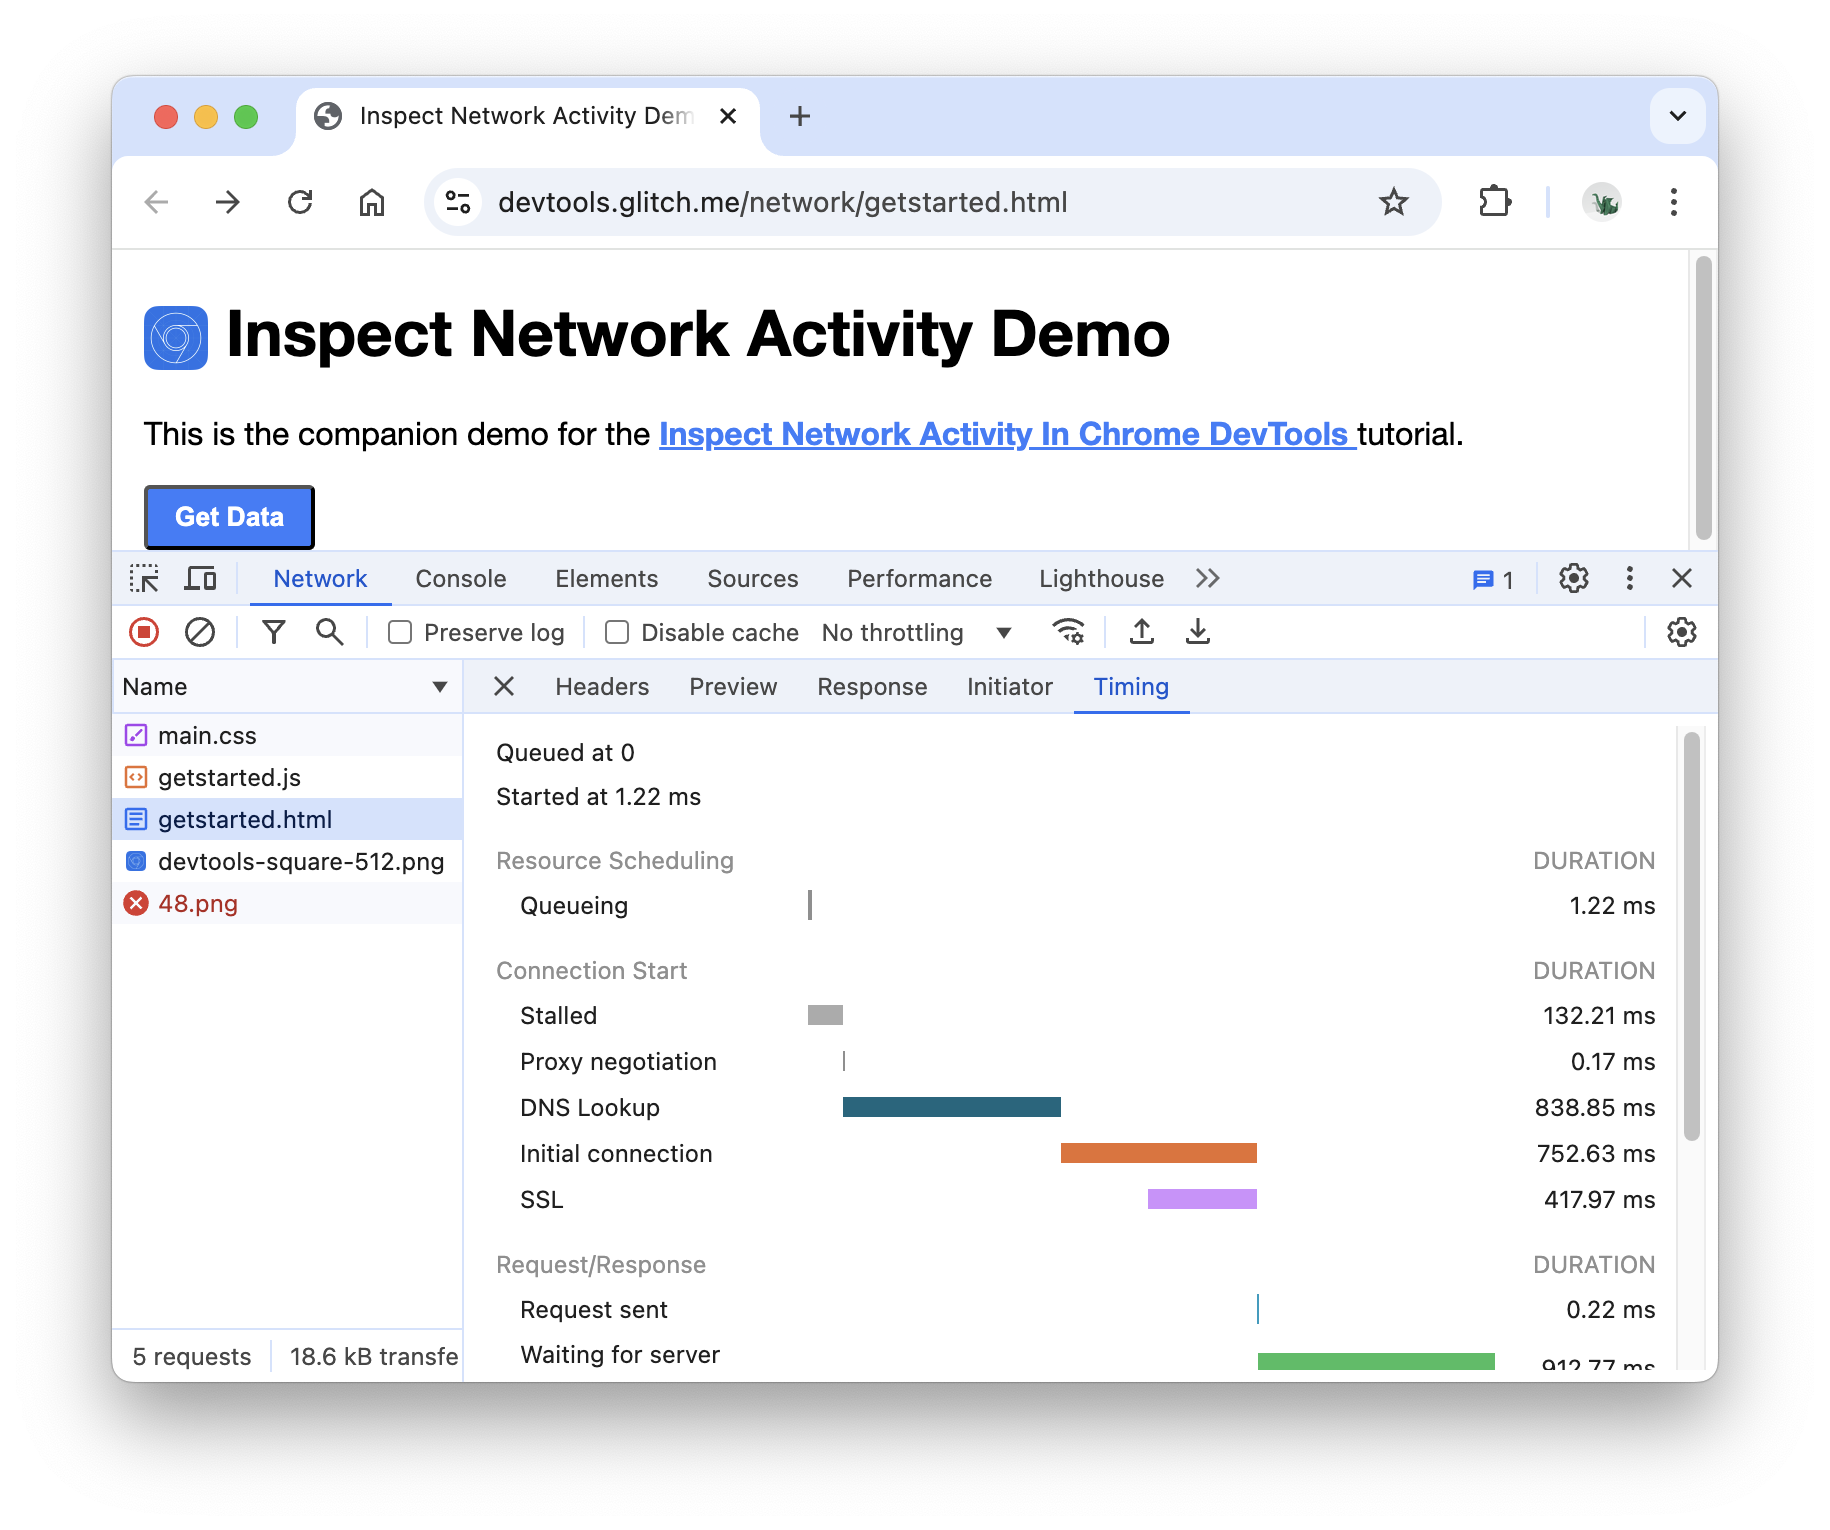
Click the Timing tab to view a breakdown of the network activity for this resource.
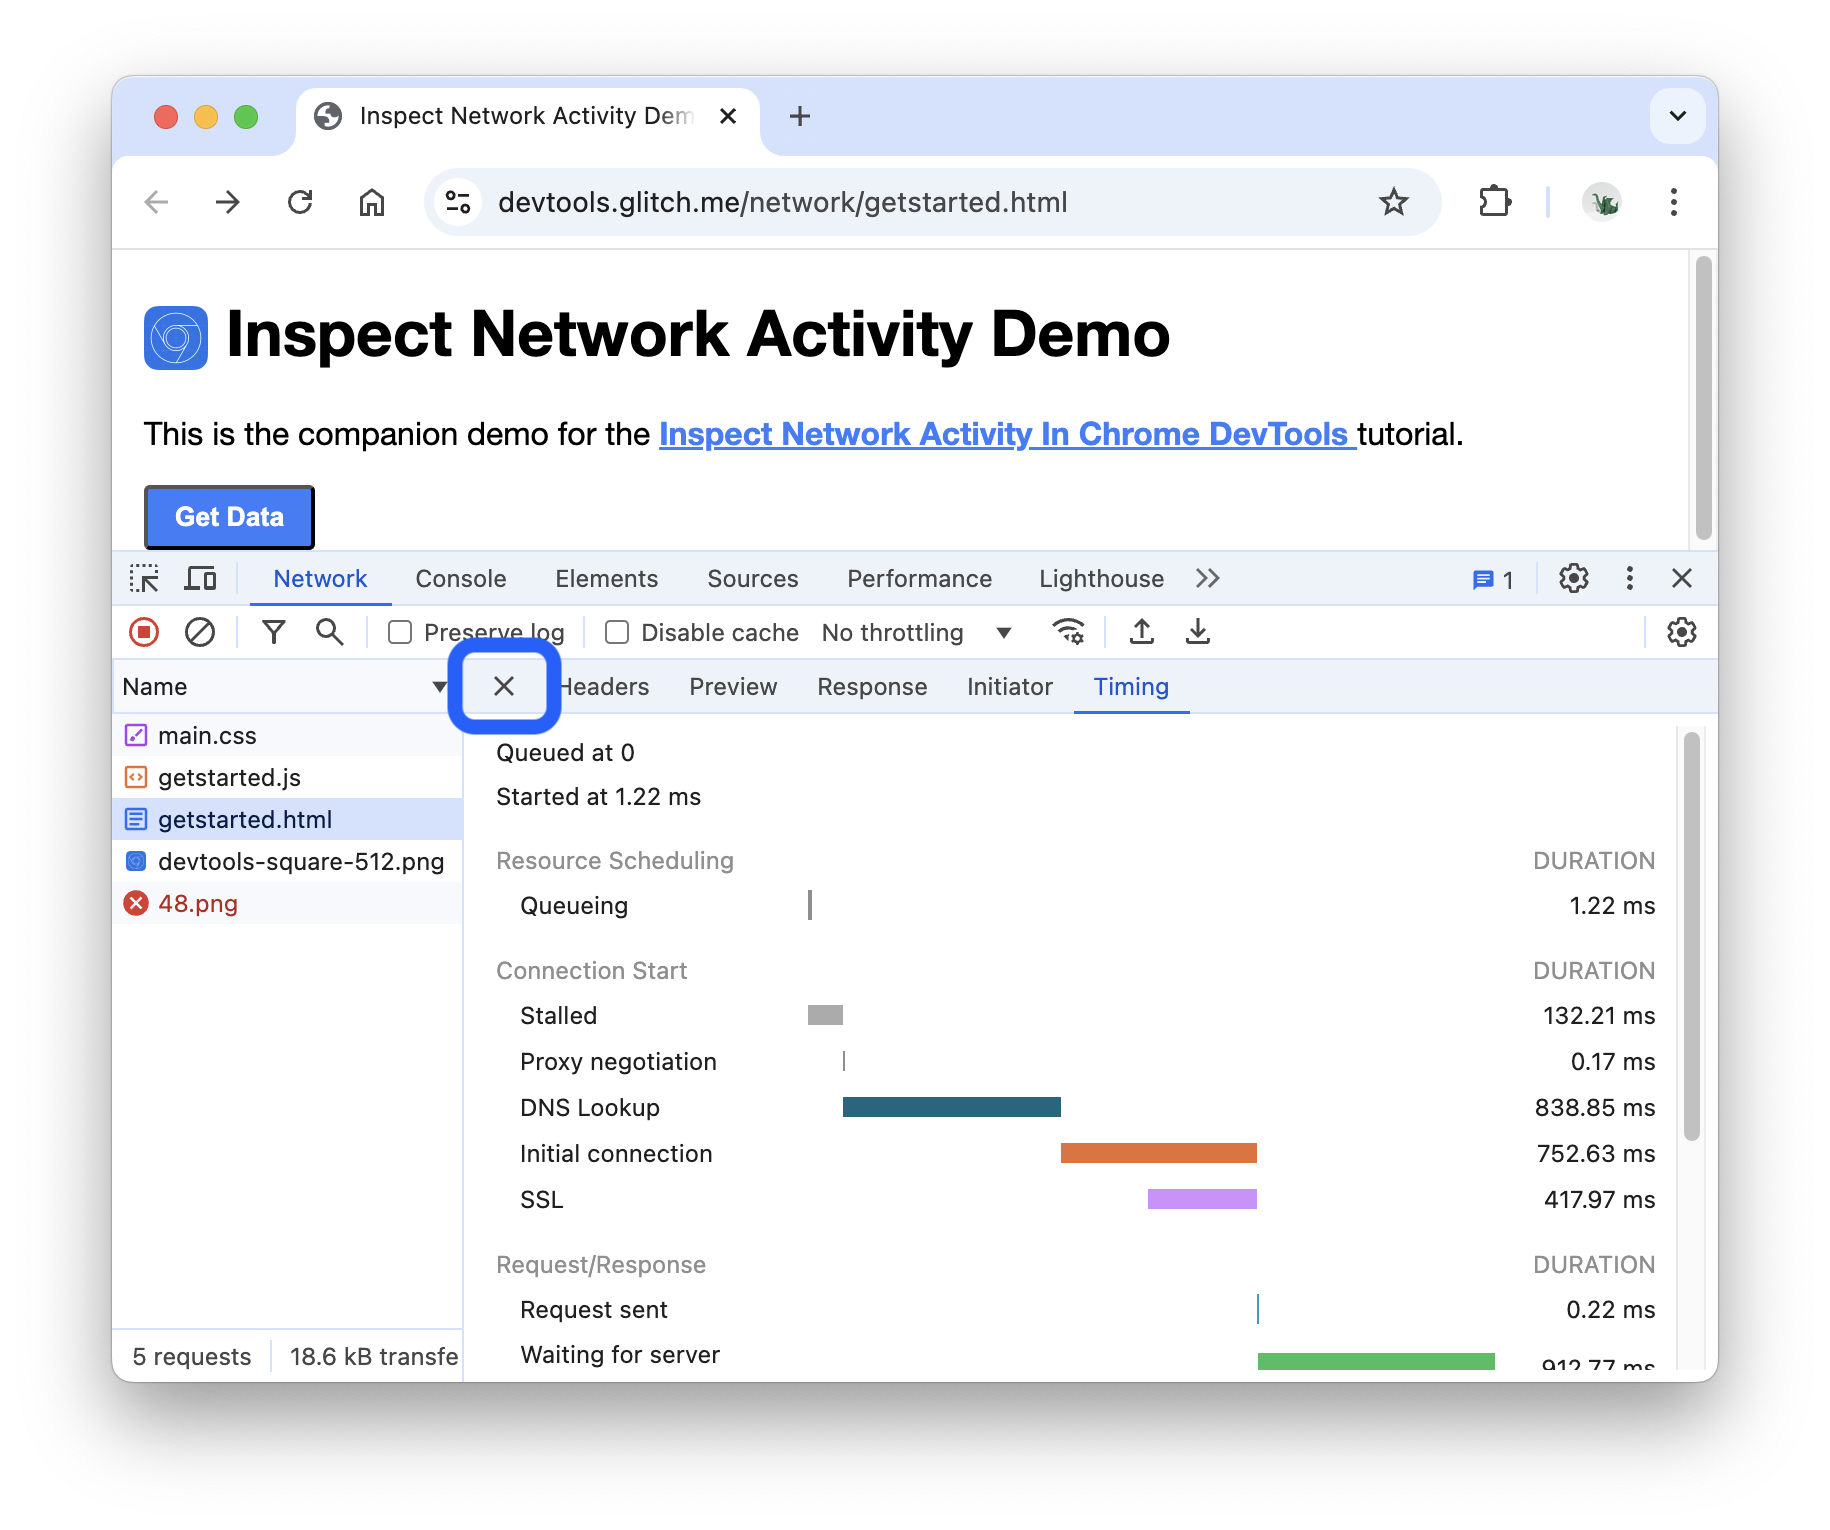
Click Close to view the Network Log again.
Search network headers and responses
Use the Search tab when you need to search the HTTP headers and responses of all resources for a certain string or regular expression.
For example, suppose you want to check if your resources are using reasonable cache policies.
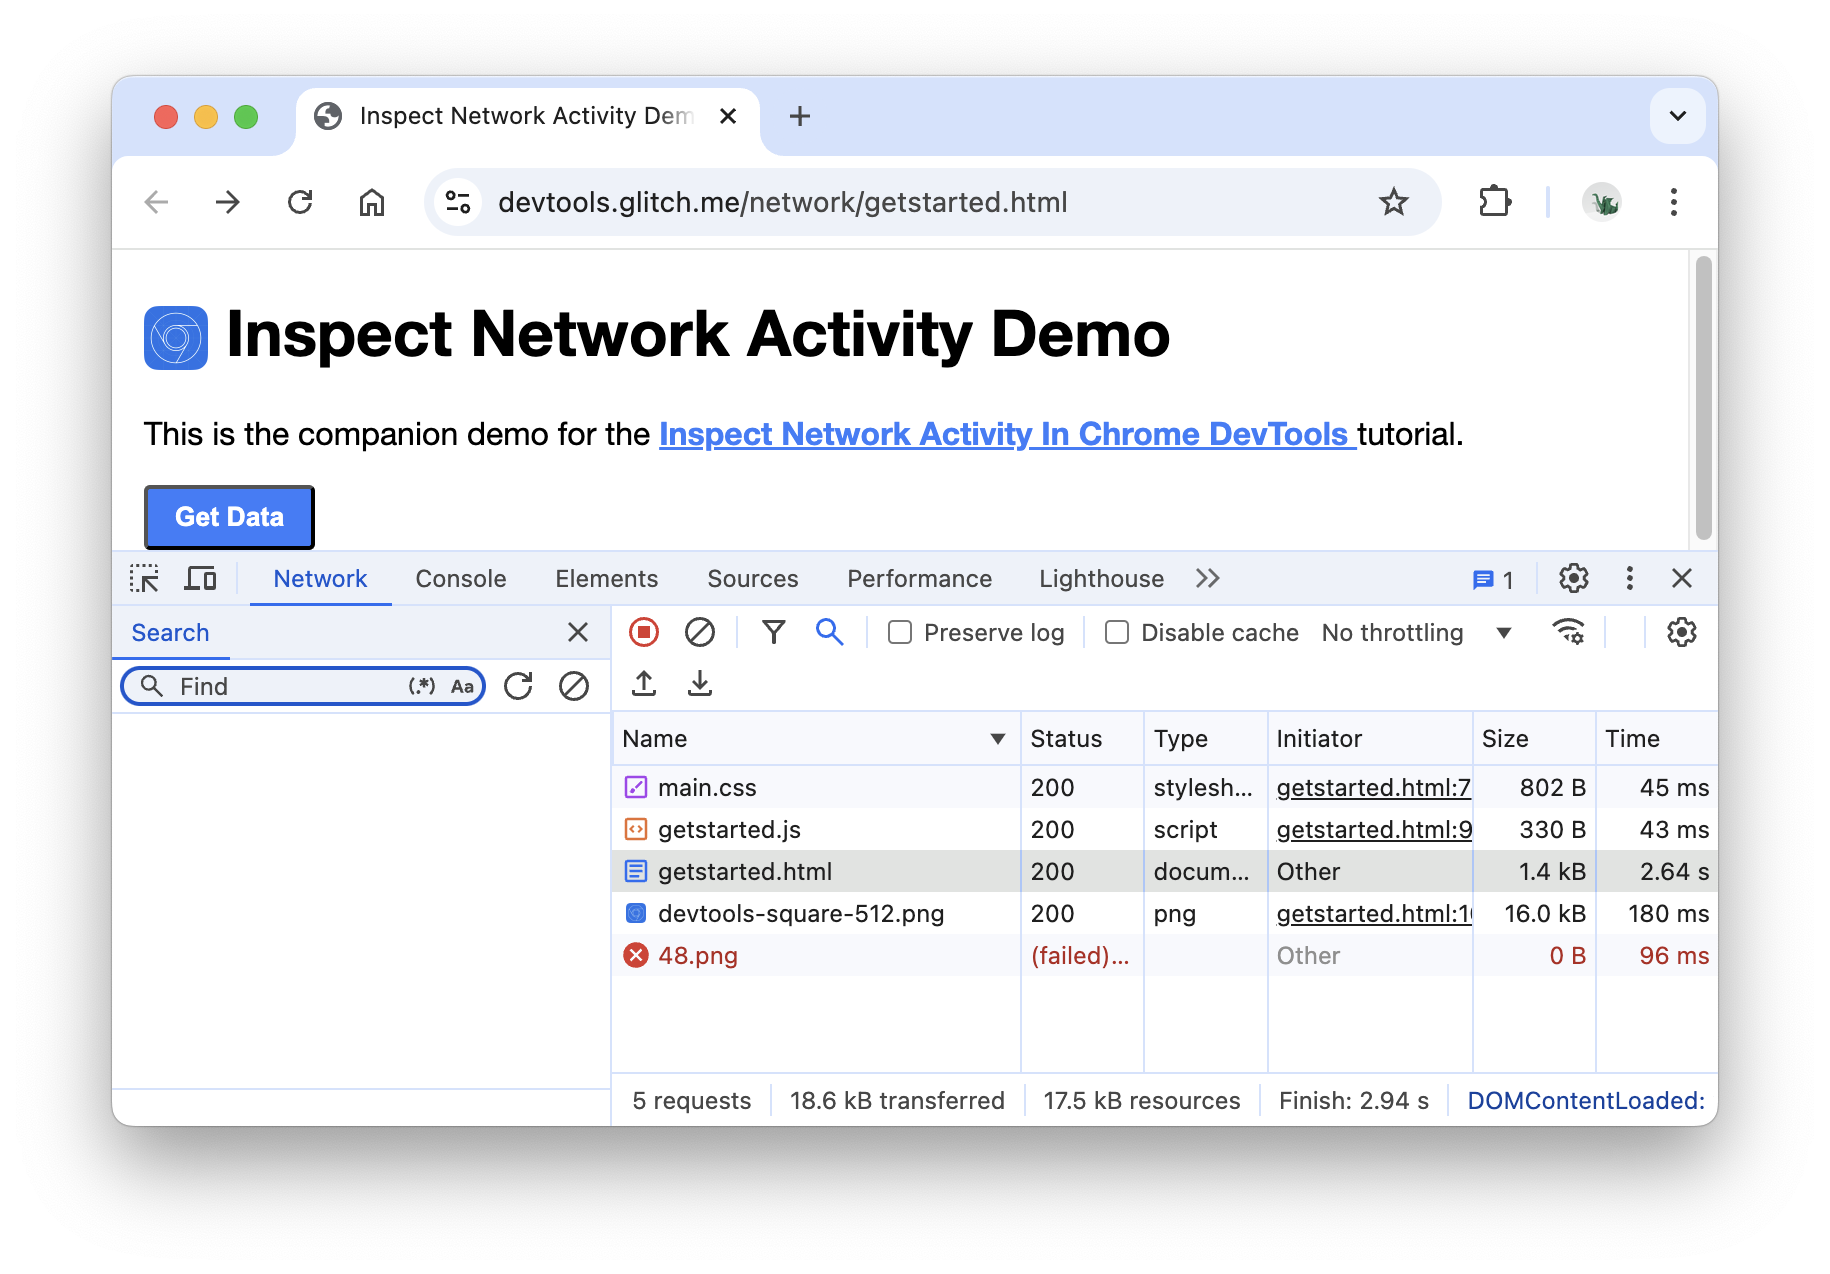
Click Search in the panel's action bar or press Command + F (macOS) or Control + F (Windows / Linux).
The Search tab opens to the left of the Network log.
Type
Cache-Controland press Enter. The Search tab lists all instances ofCache-Controlthat it finds in resource headers or content.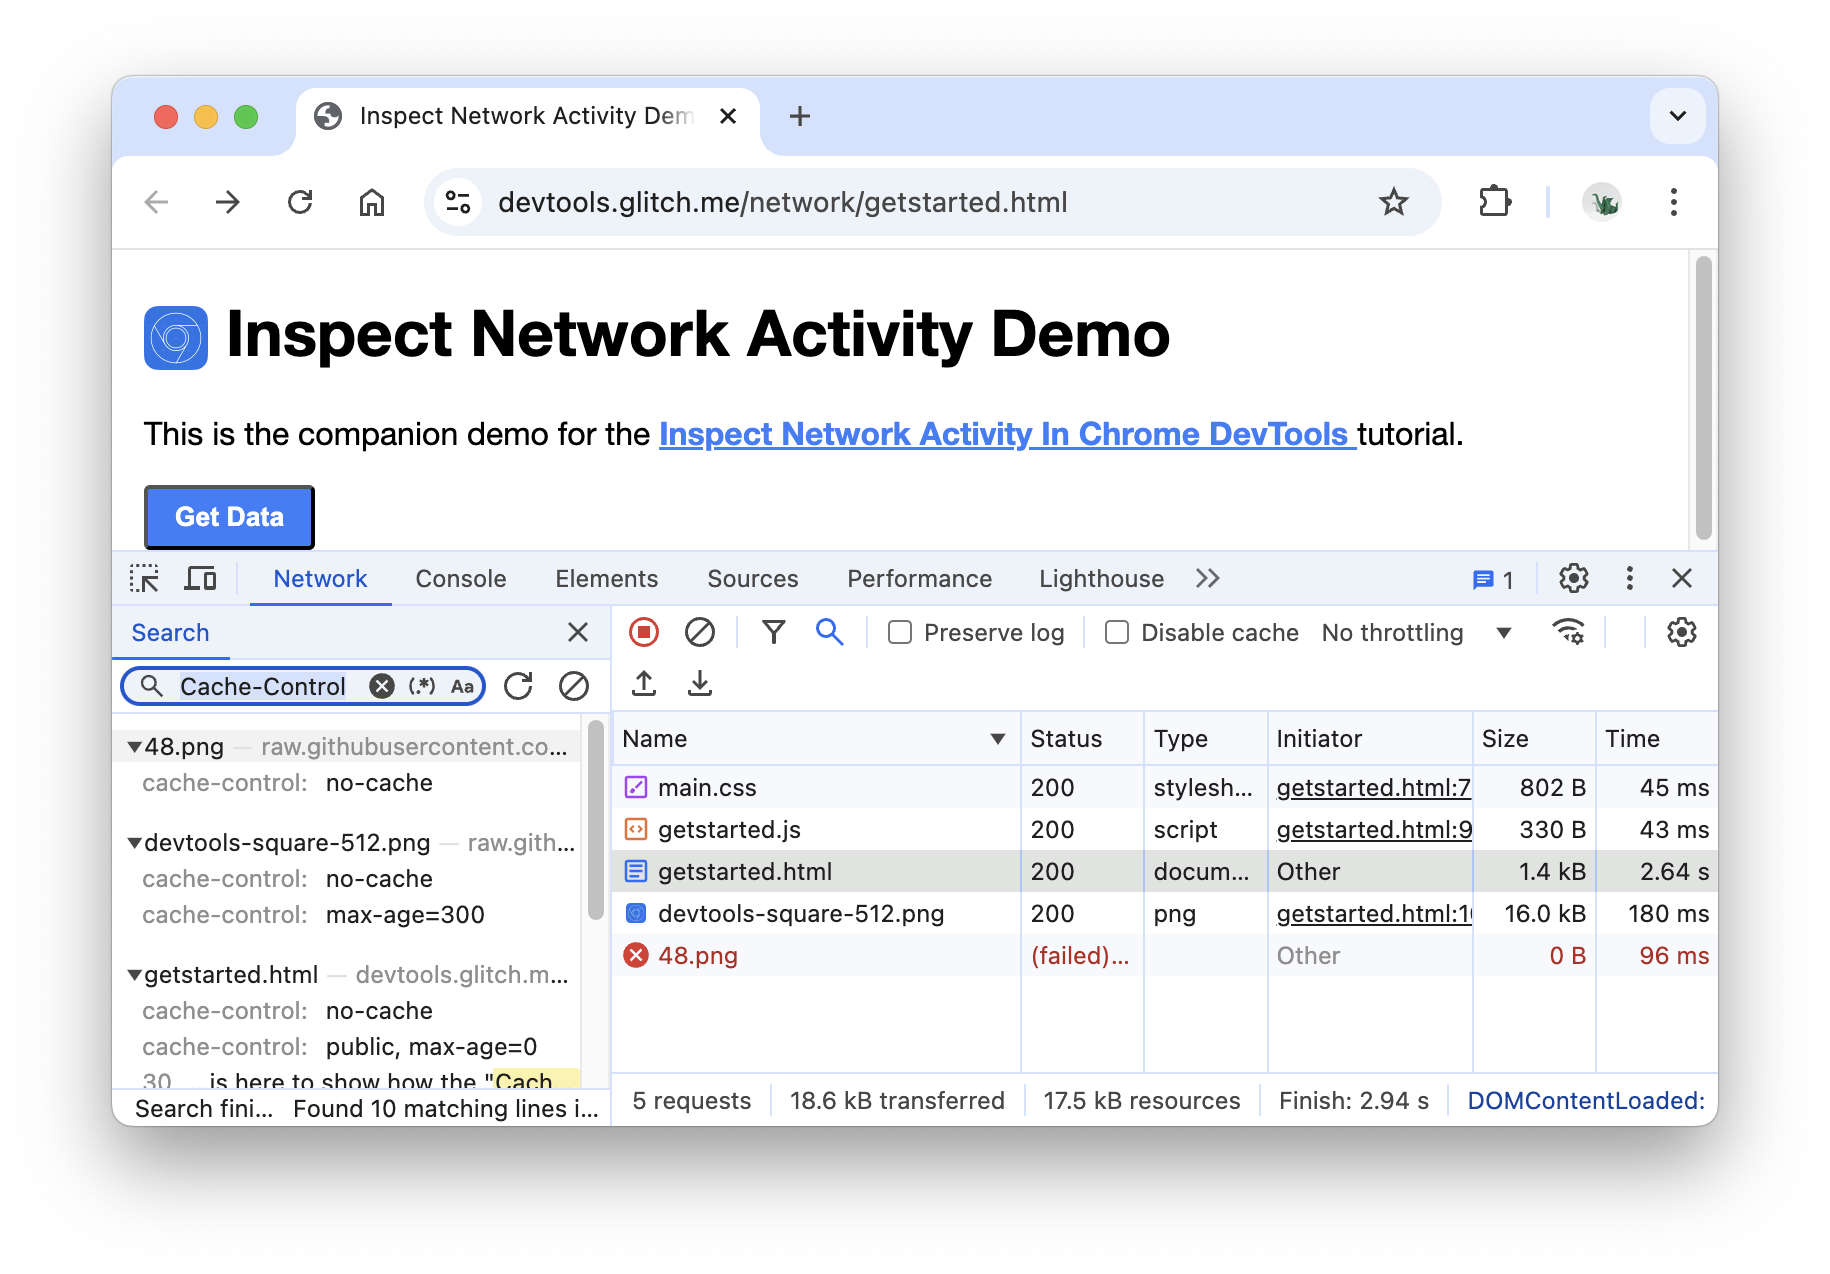
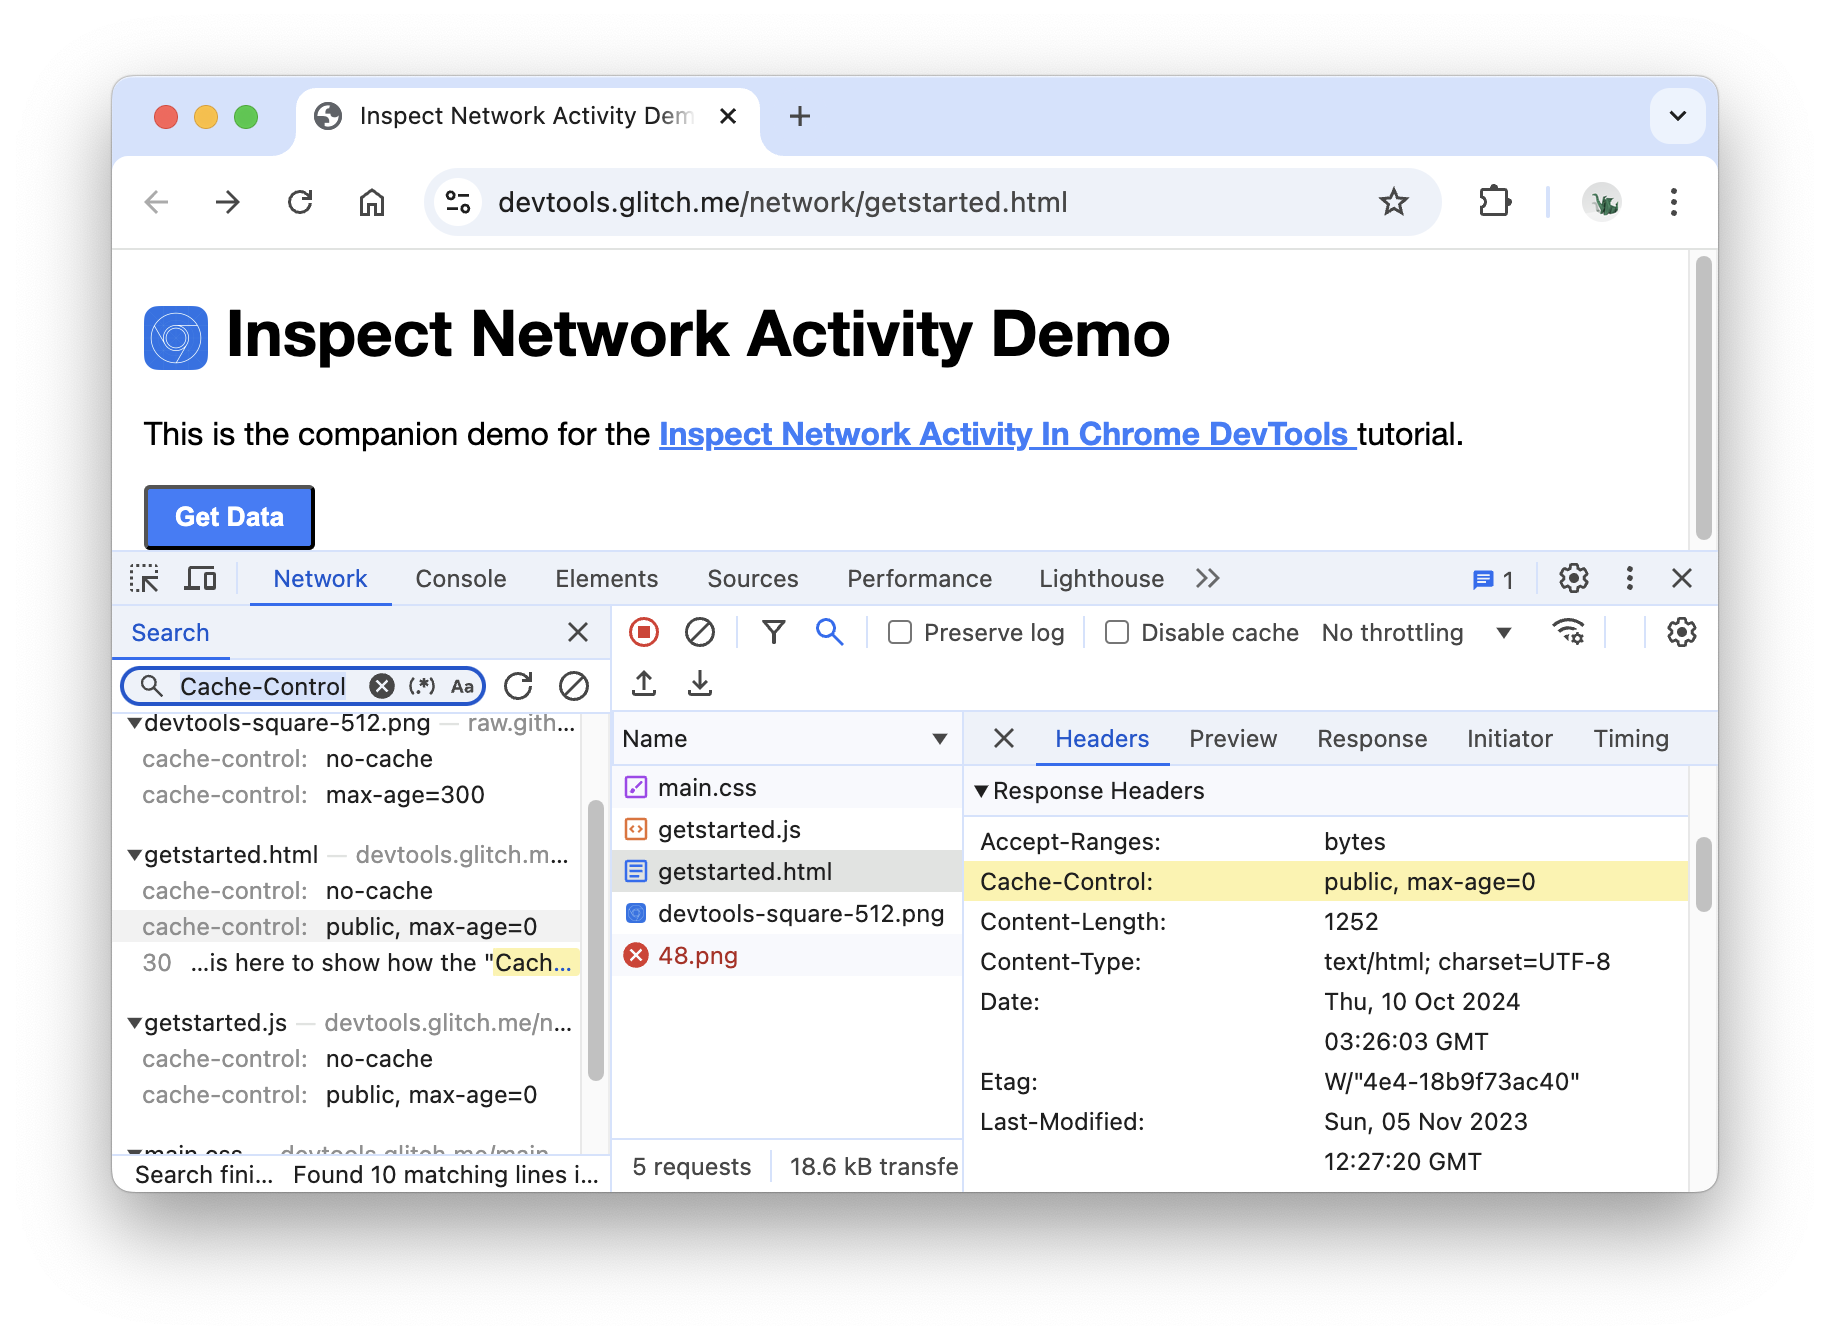
Click a result to view it. If the query was found in a header, the Headers tab opens. If the query was found in content, the Response tab opens.
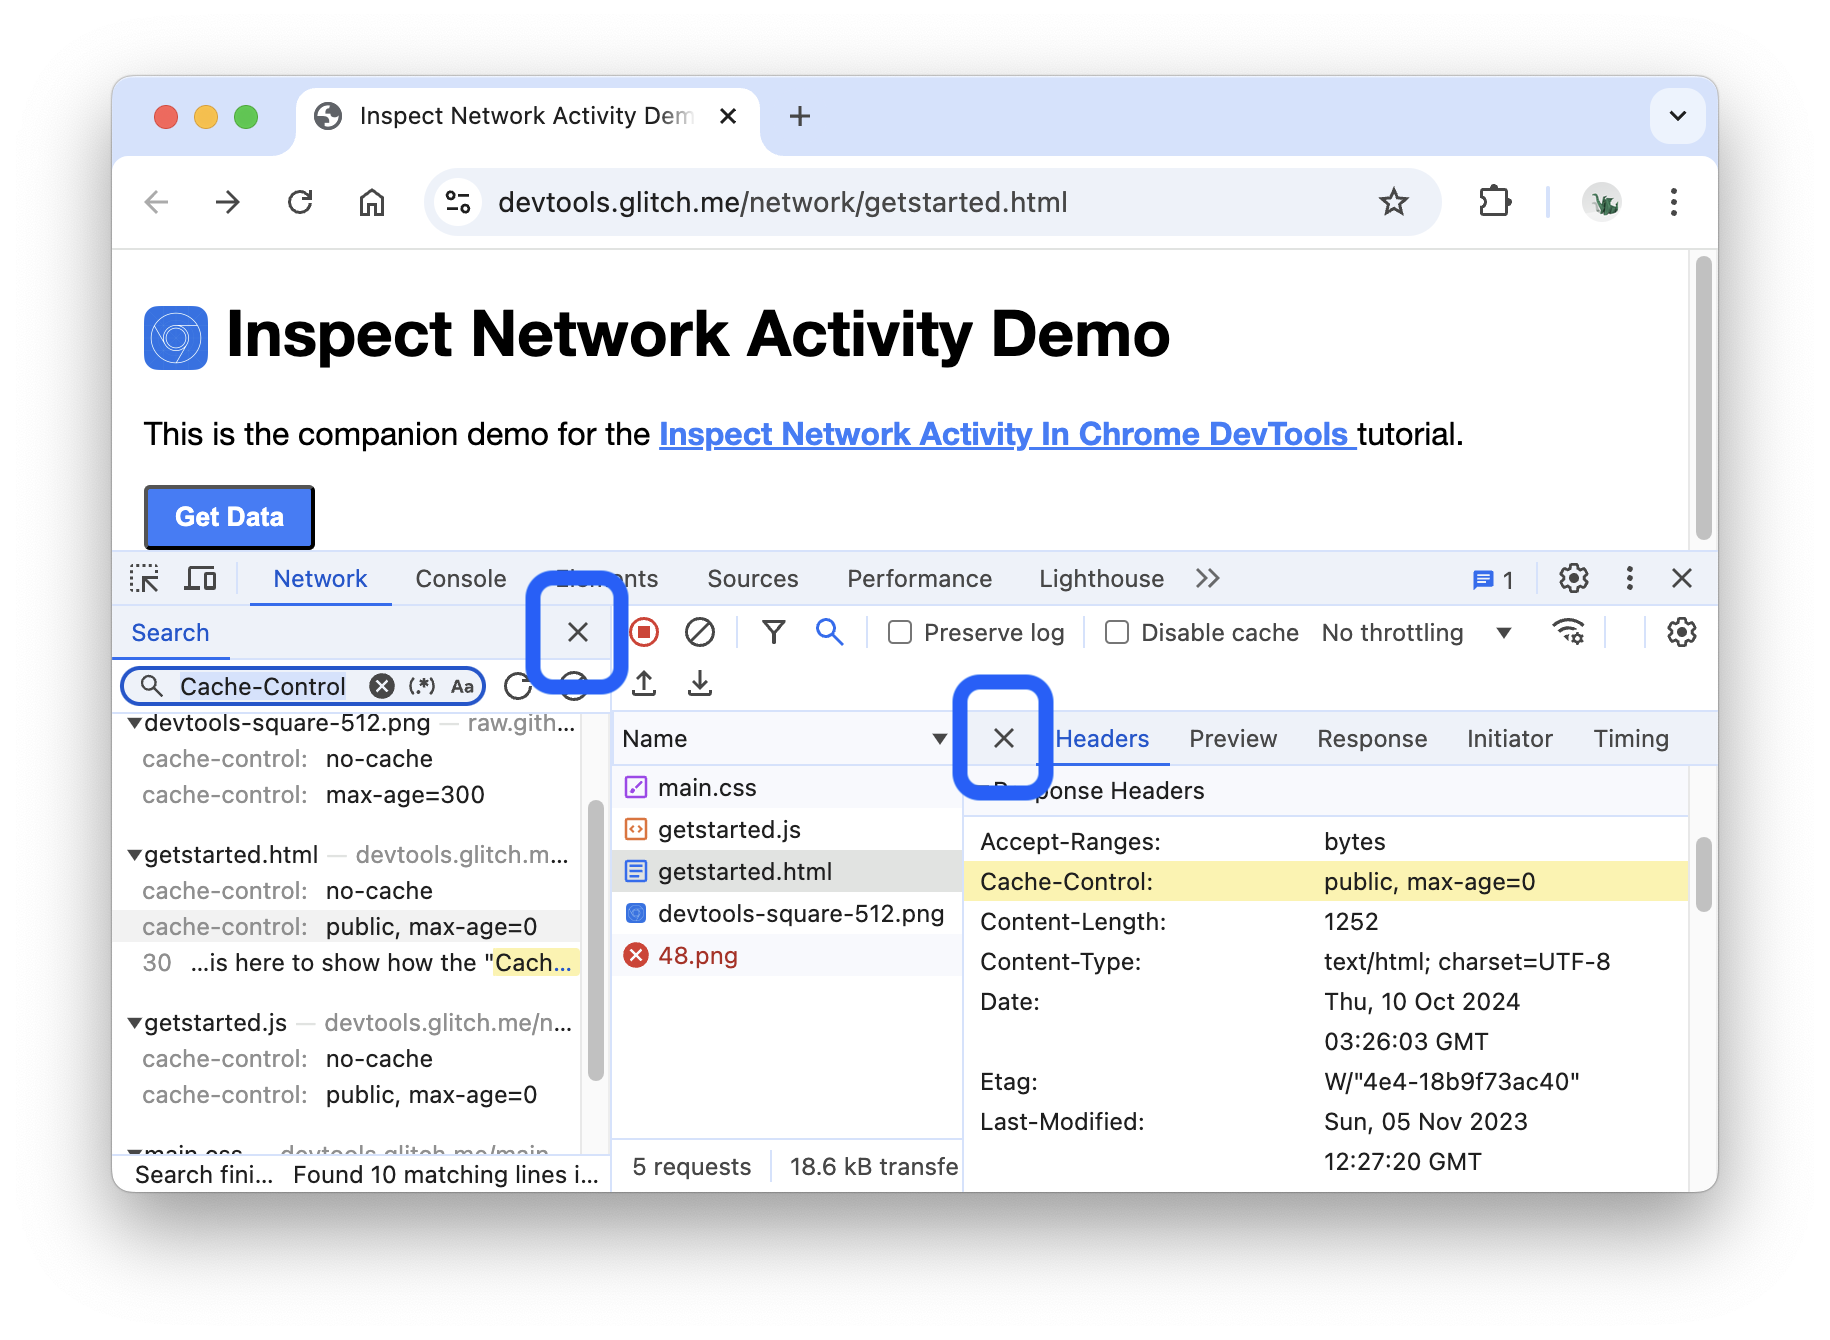
Close the Search tab and the Headers tab.
Filter resources
DevTools provides numerous workflows for filtering out resources that aren't relevant to the task at hand.
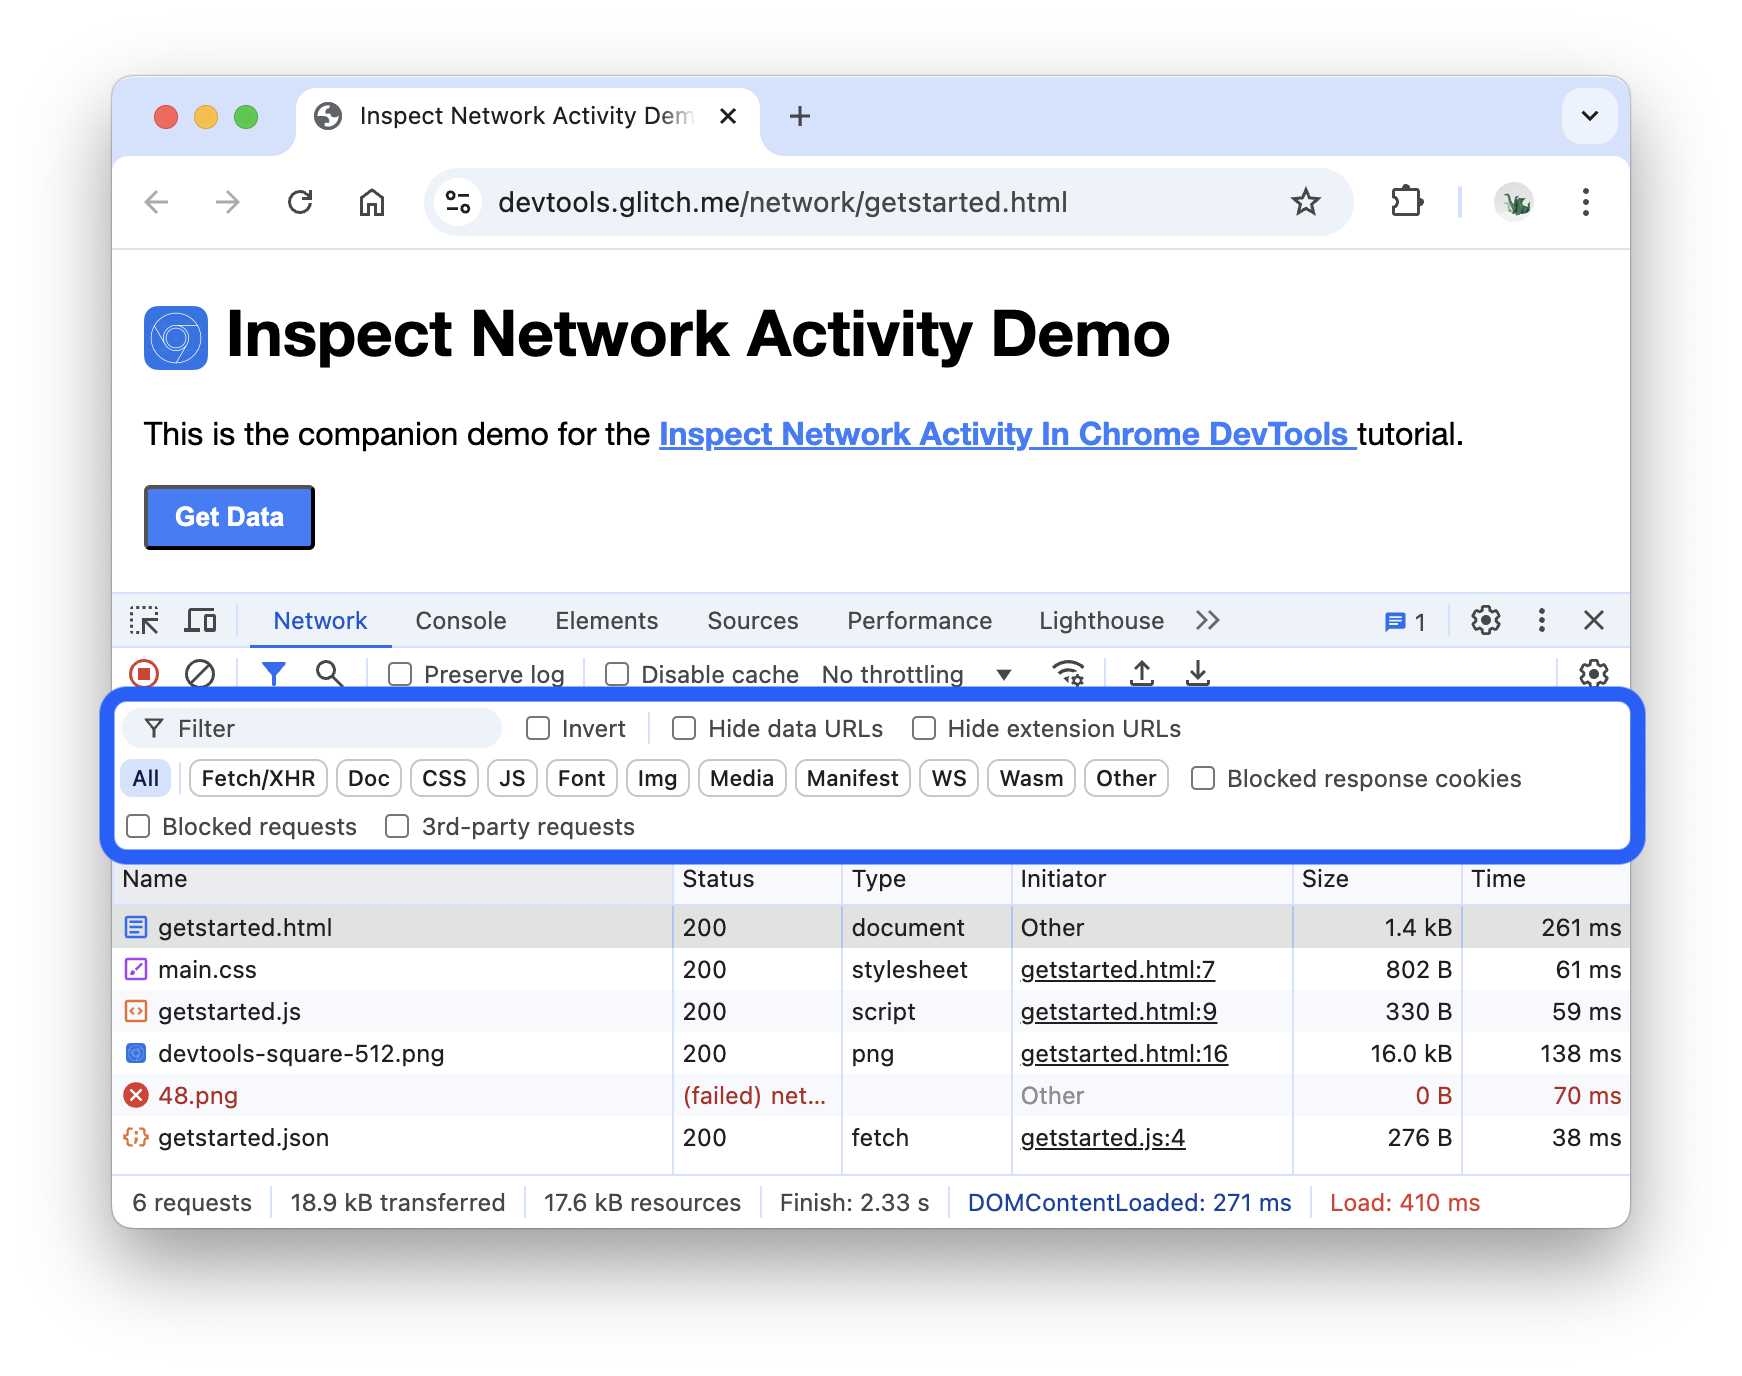
The Filters toolbar should be enabled by default. If not:
- Click Filter to show it.
Filter by string, regular expression, or property
The Filter input box supports many different types of filtering.
Type
pnginto the Filter input box. Only the files that contain the textpngare shown. In this case the only files that match the filter are the PNG images.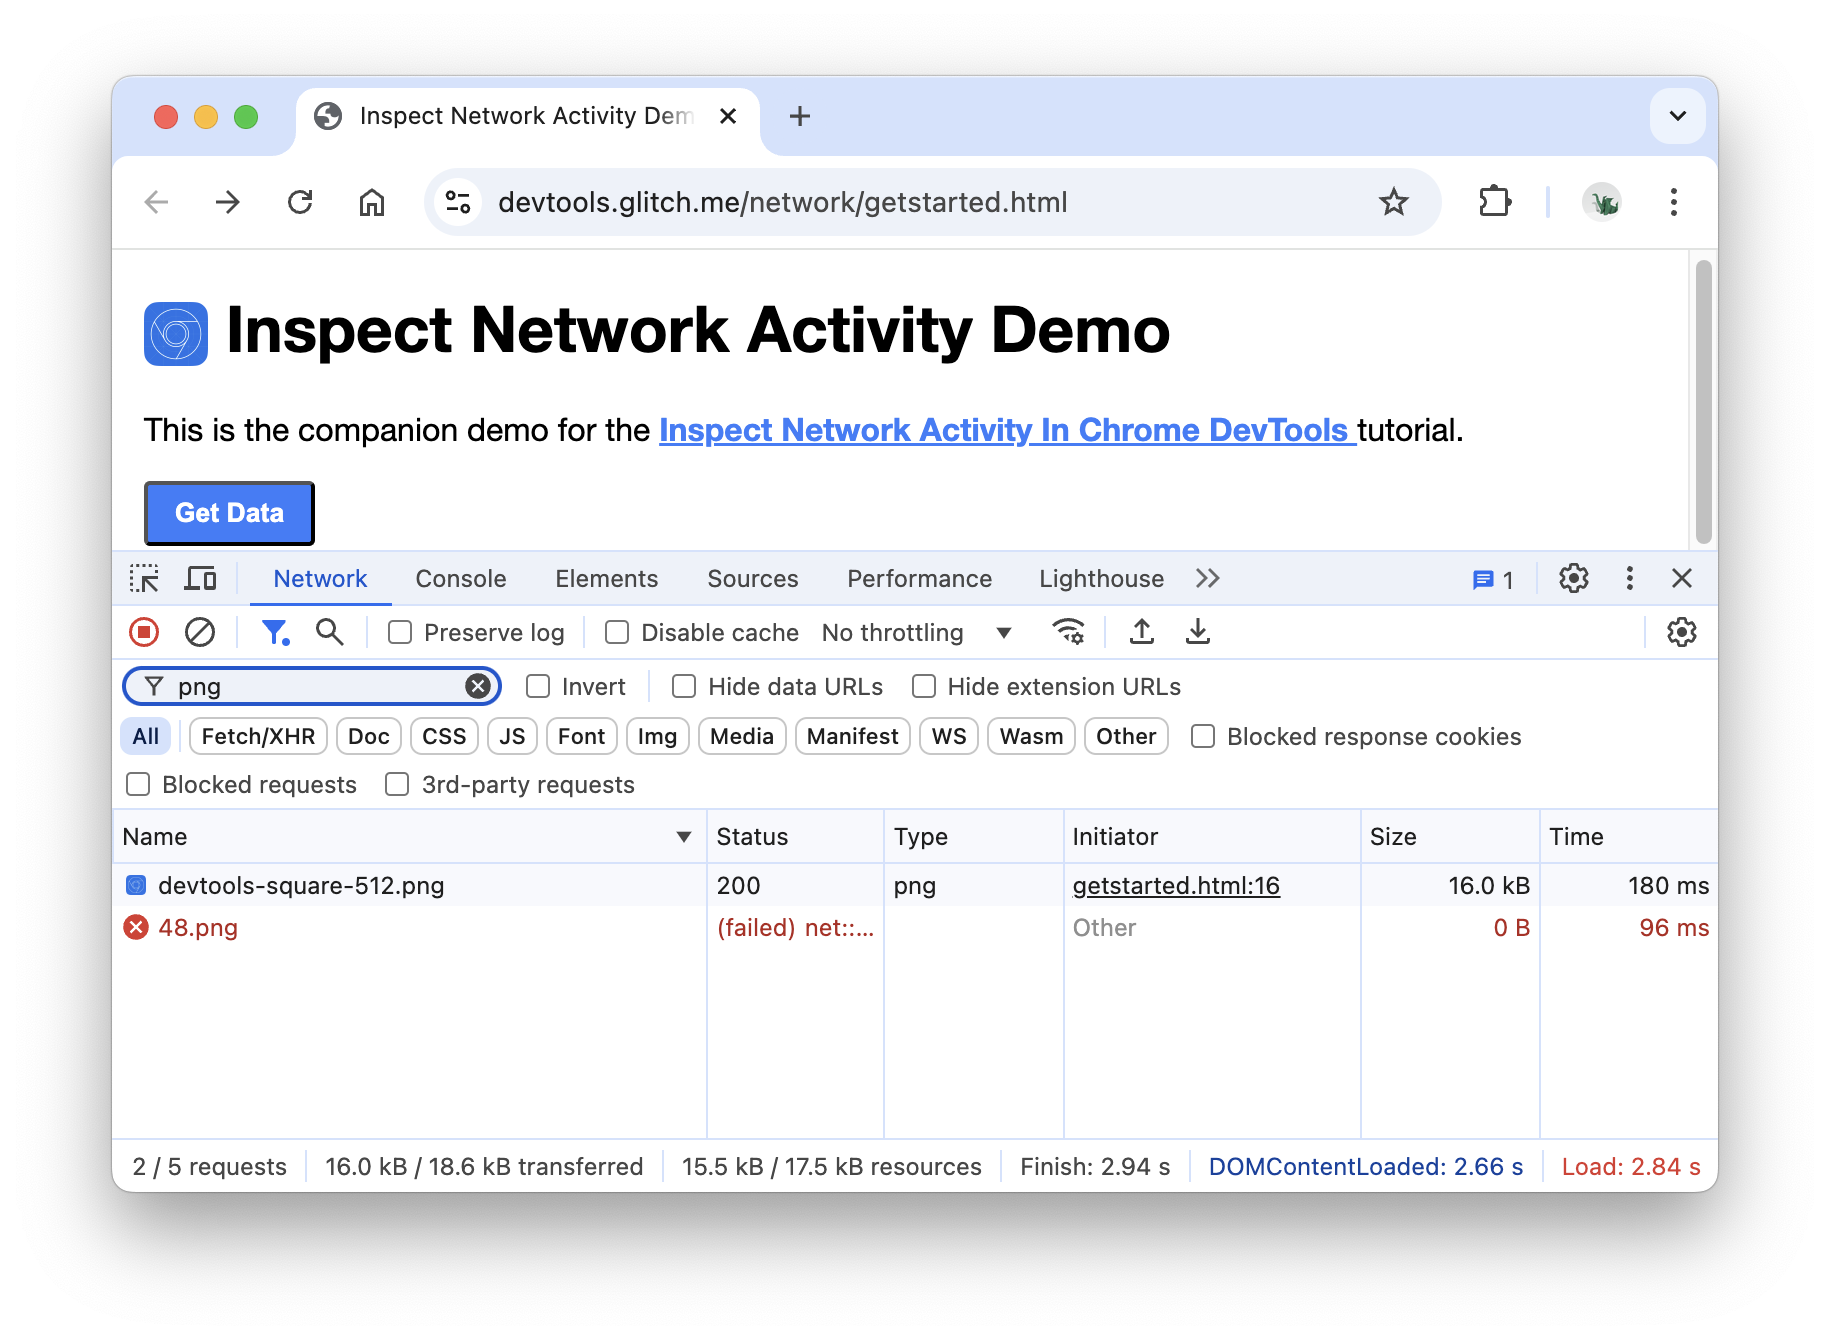
Type
/.*\.[cj]s+$/. DevTools filters out any resource with a filename that doesn't end with ajor acfollowed by 1 or morescharacters.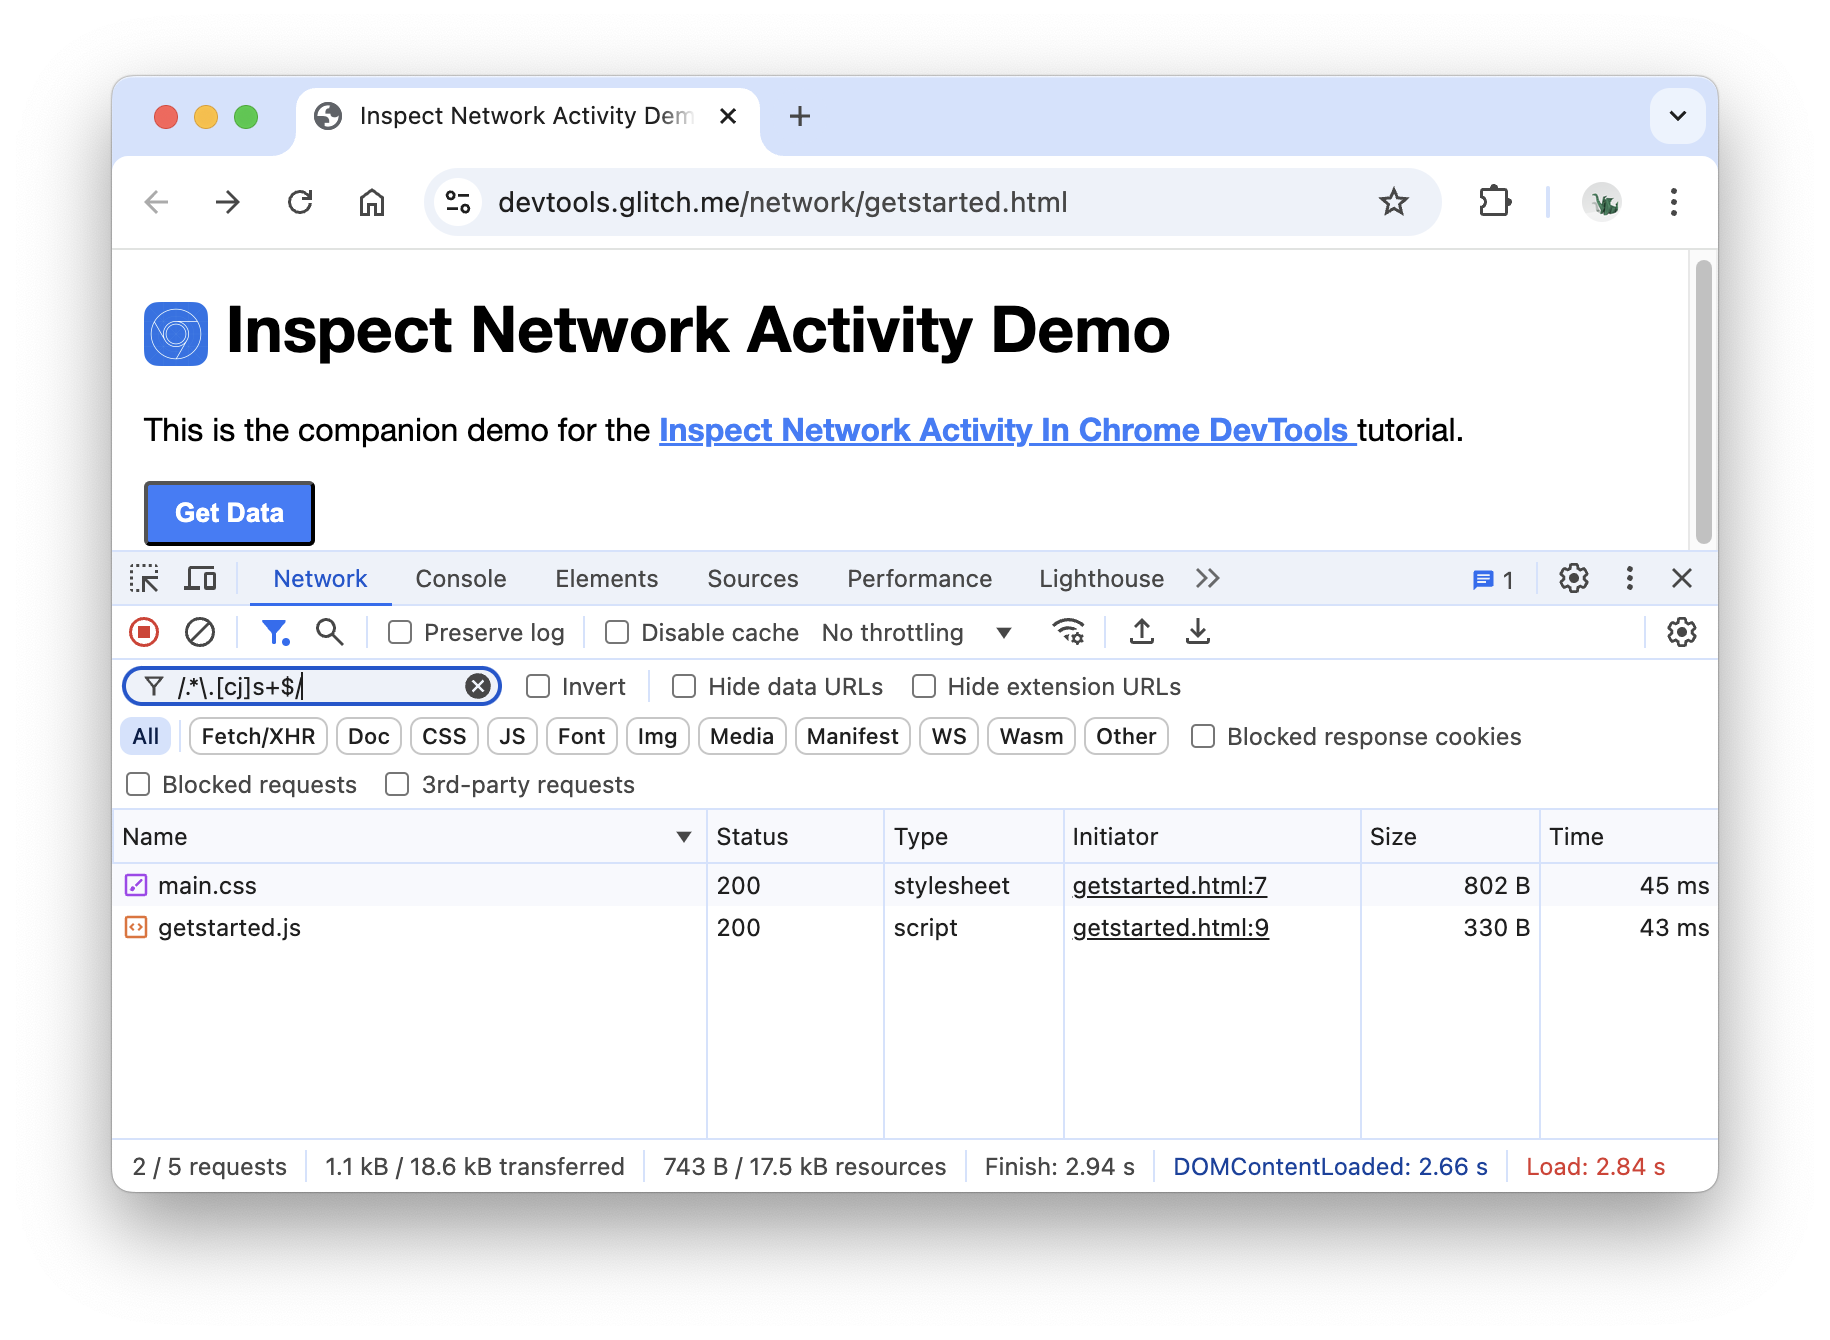
Type
-main.css. DevTools filters outmain.css. If any other file matched the pattern they would also be filtered out.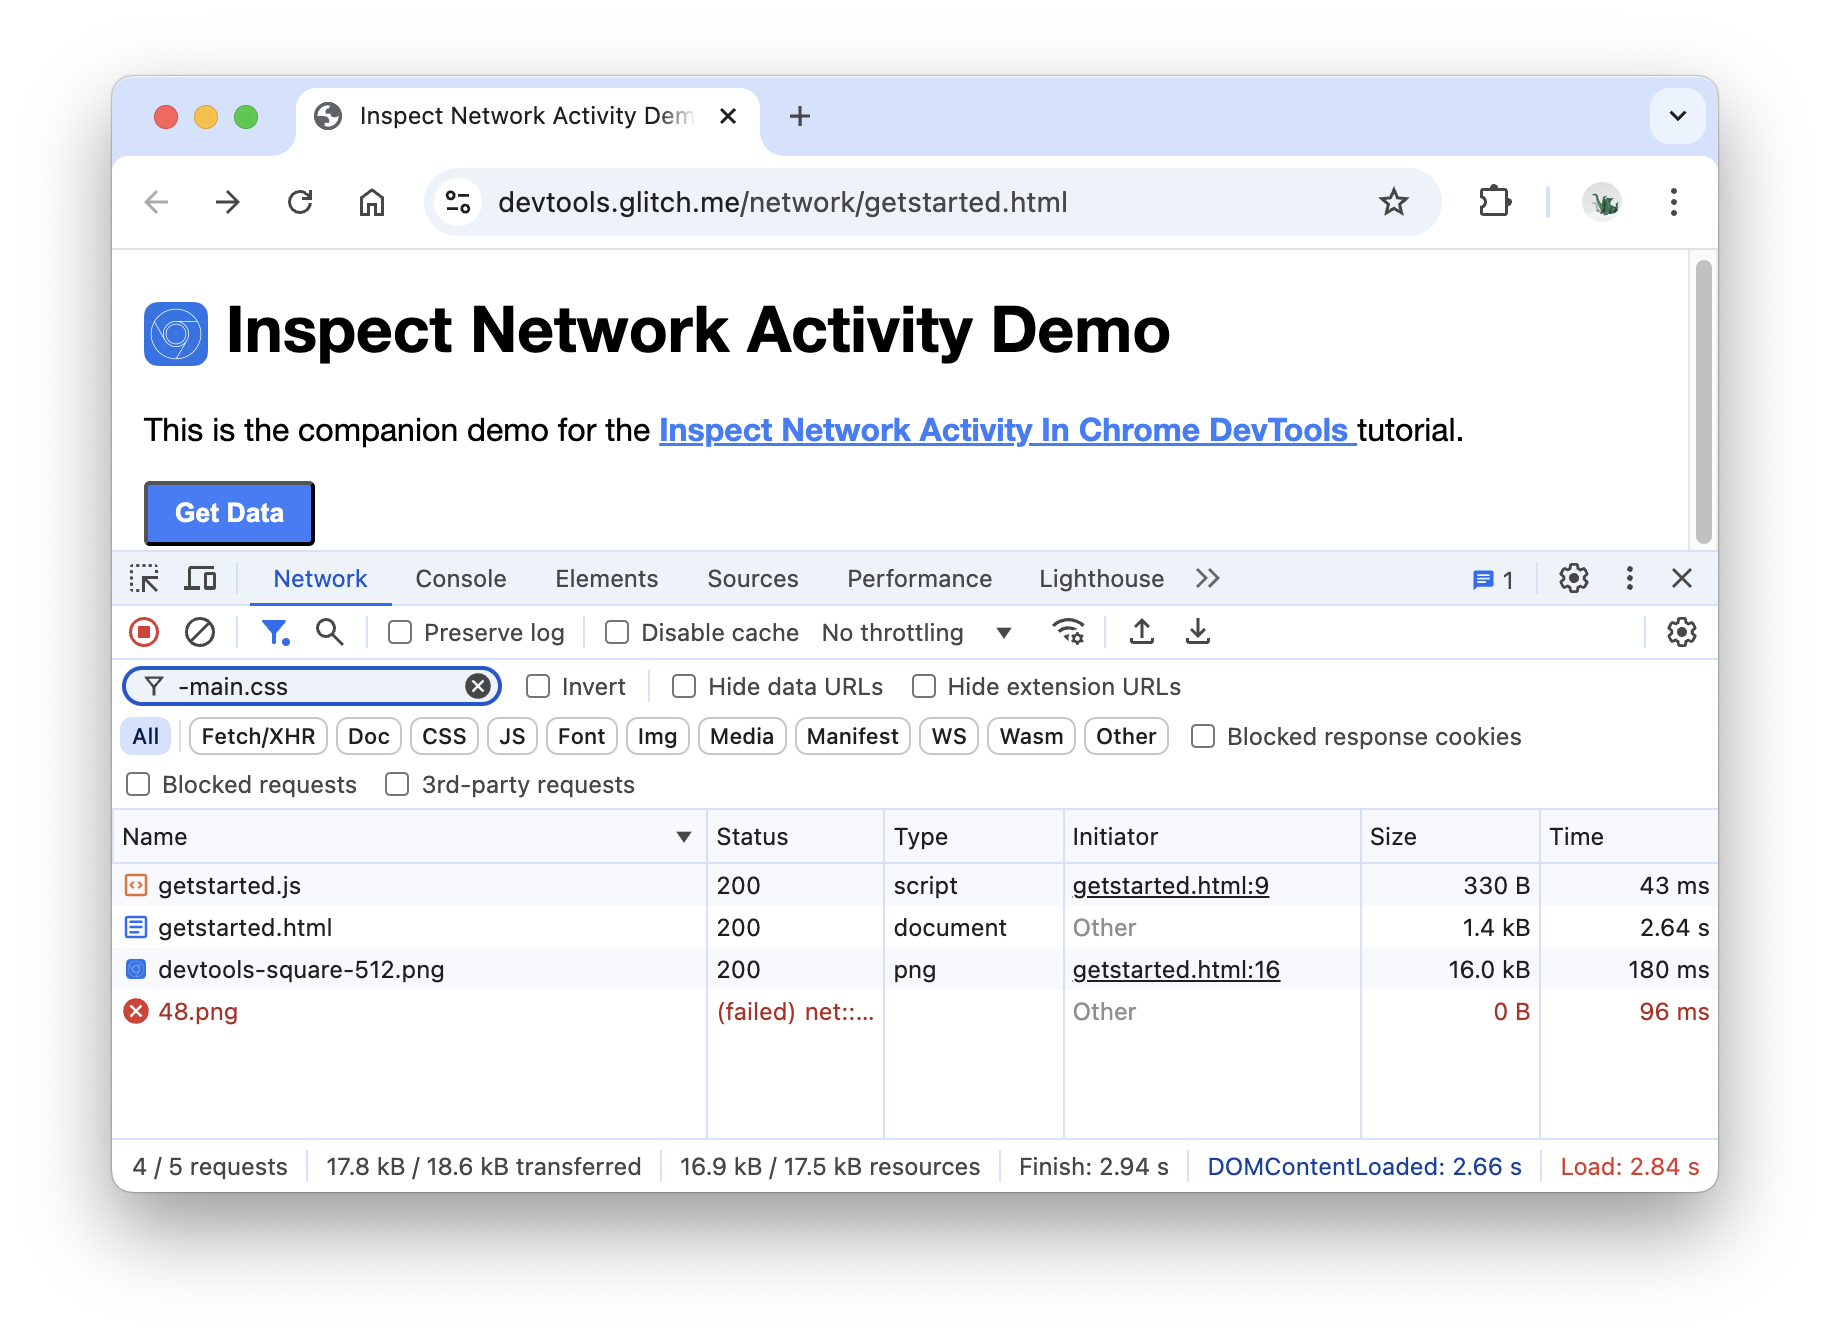
Type
domain:raw.githubusercontent.cominto the Filter text box. DevTools filters out any resource with a URL that does not match this domain.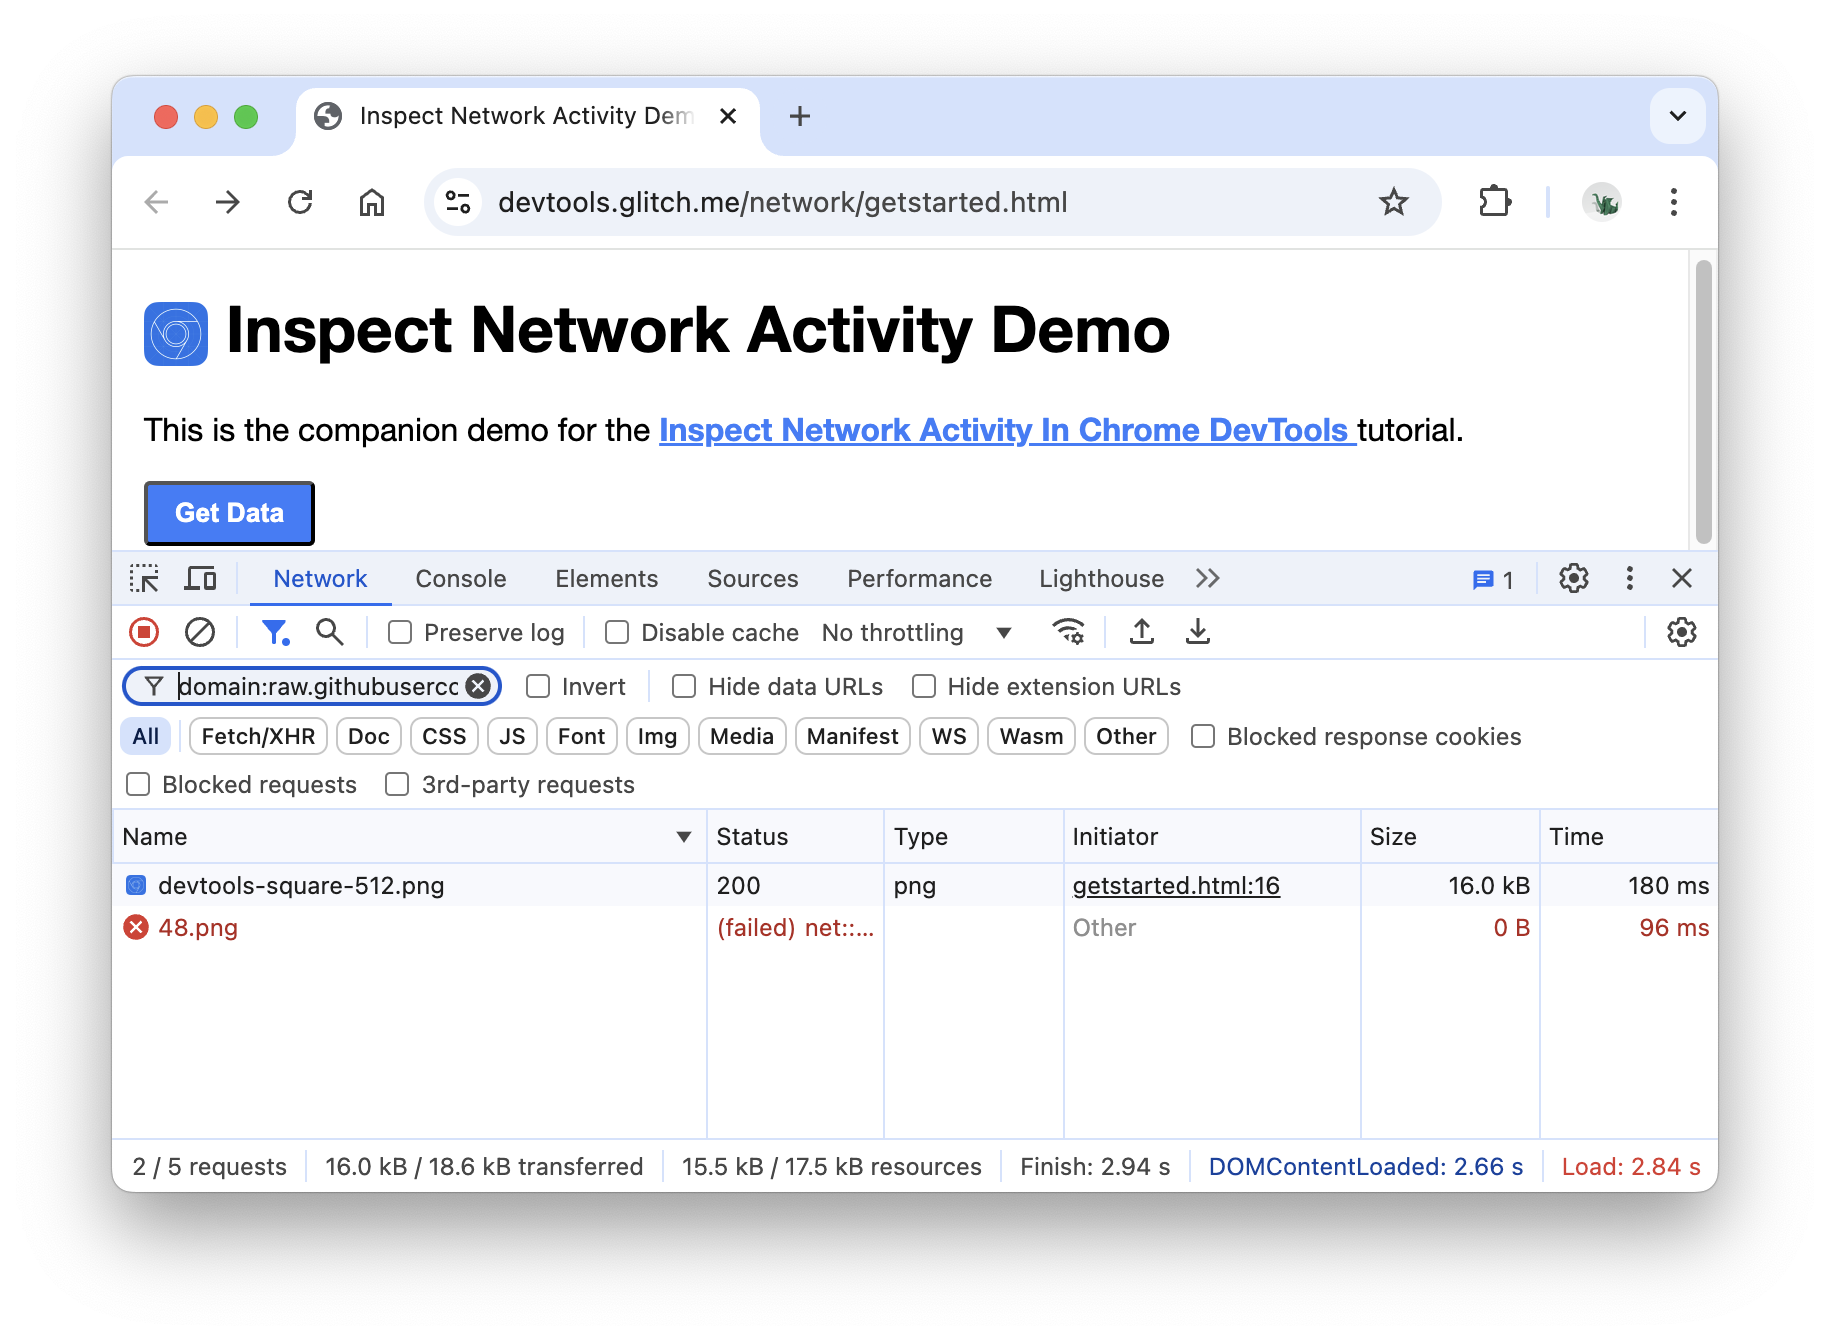
See Filter requests by properties for the full list of filterable properties.
Clear the Filter input box of any text.
Filter by resource type
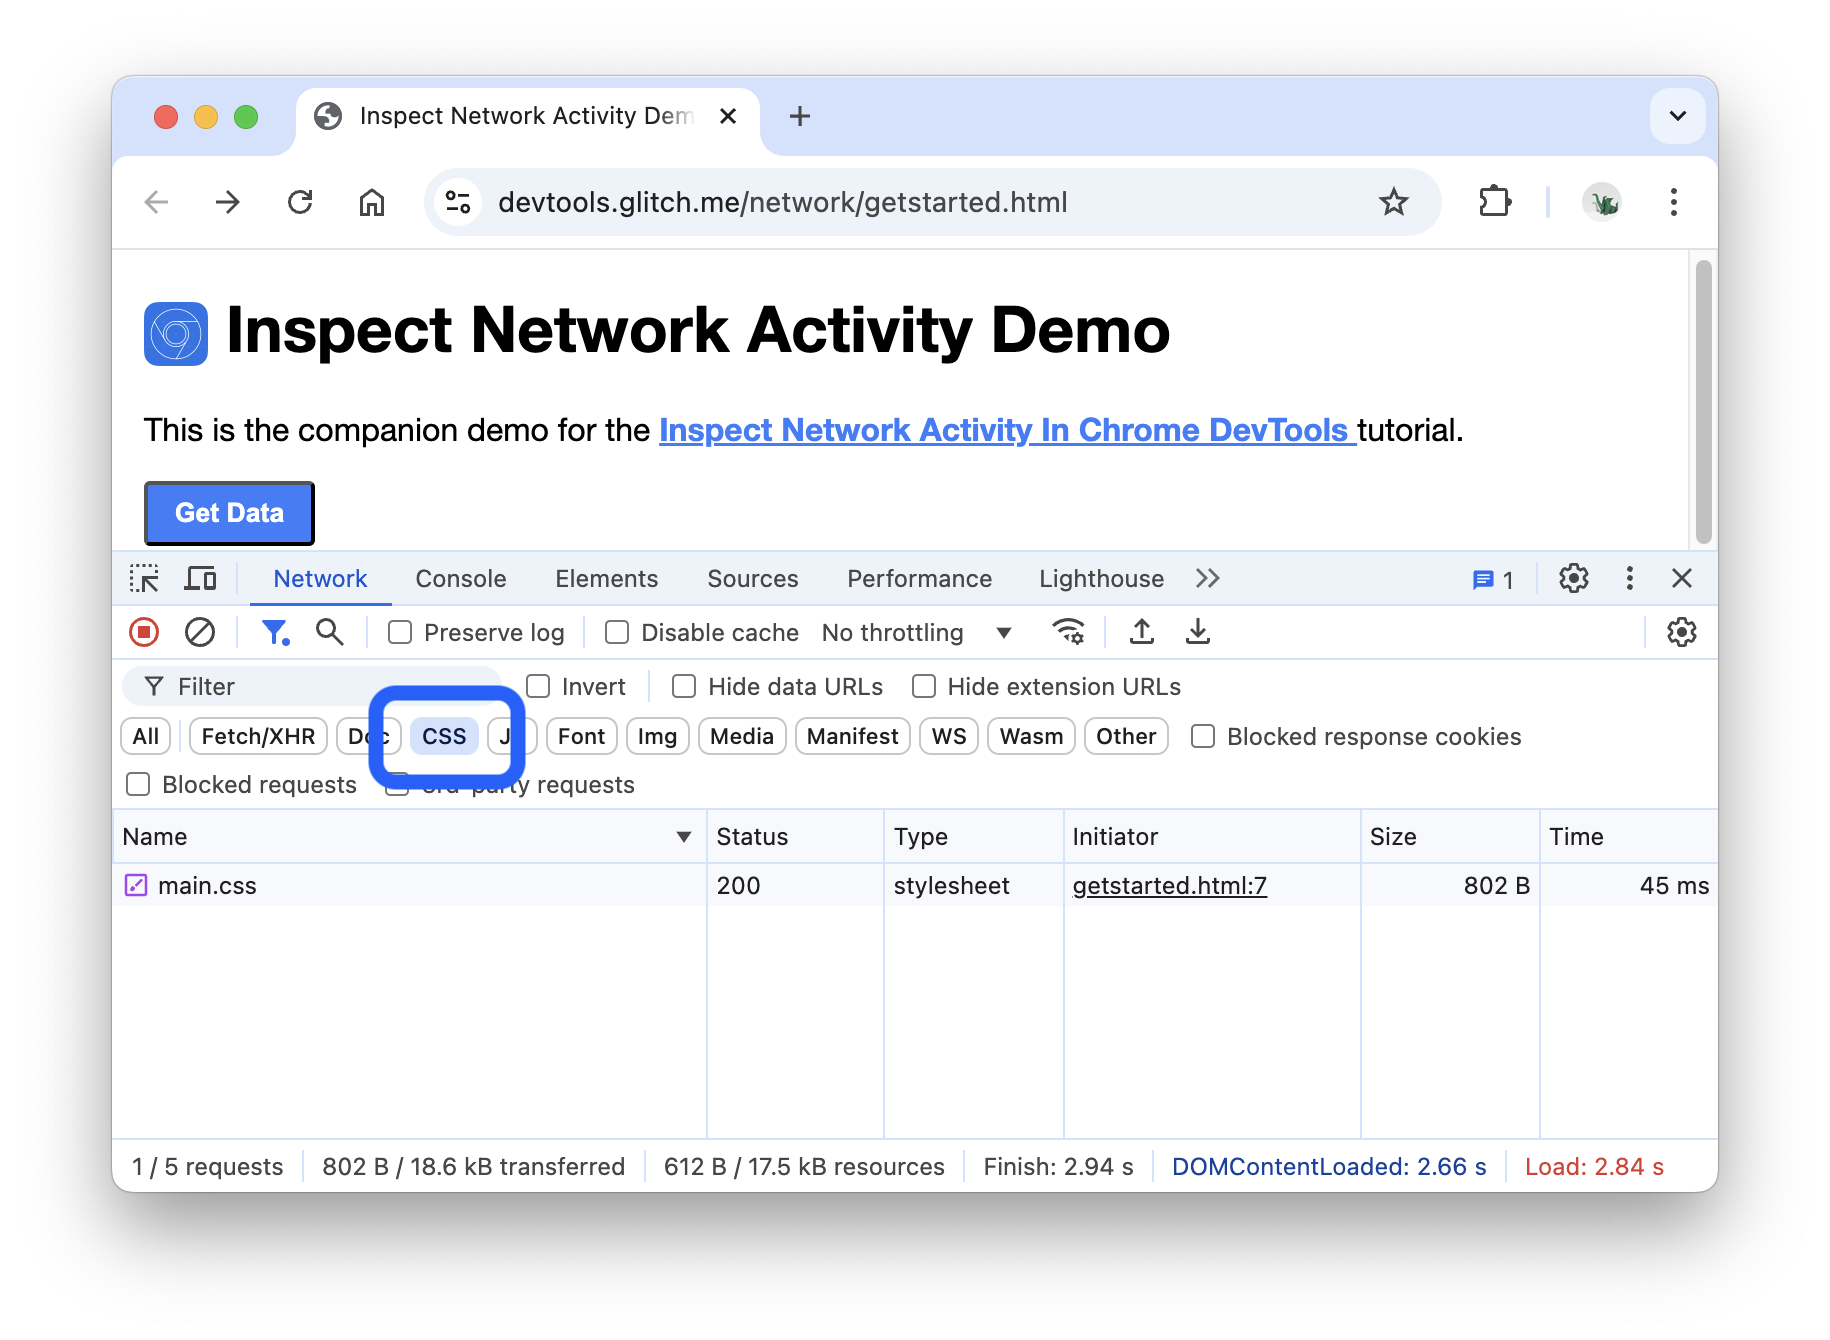
To focus in on a certain type of file, such as stylesheets:
Click CSS. All other file types are filtered out.
To also see scripts, hold Control or Command (Mac) and then click JS.
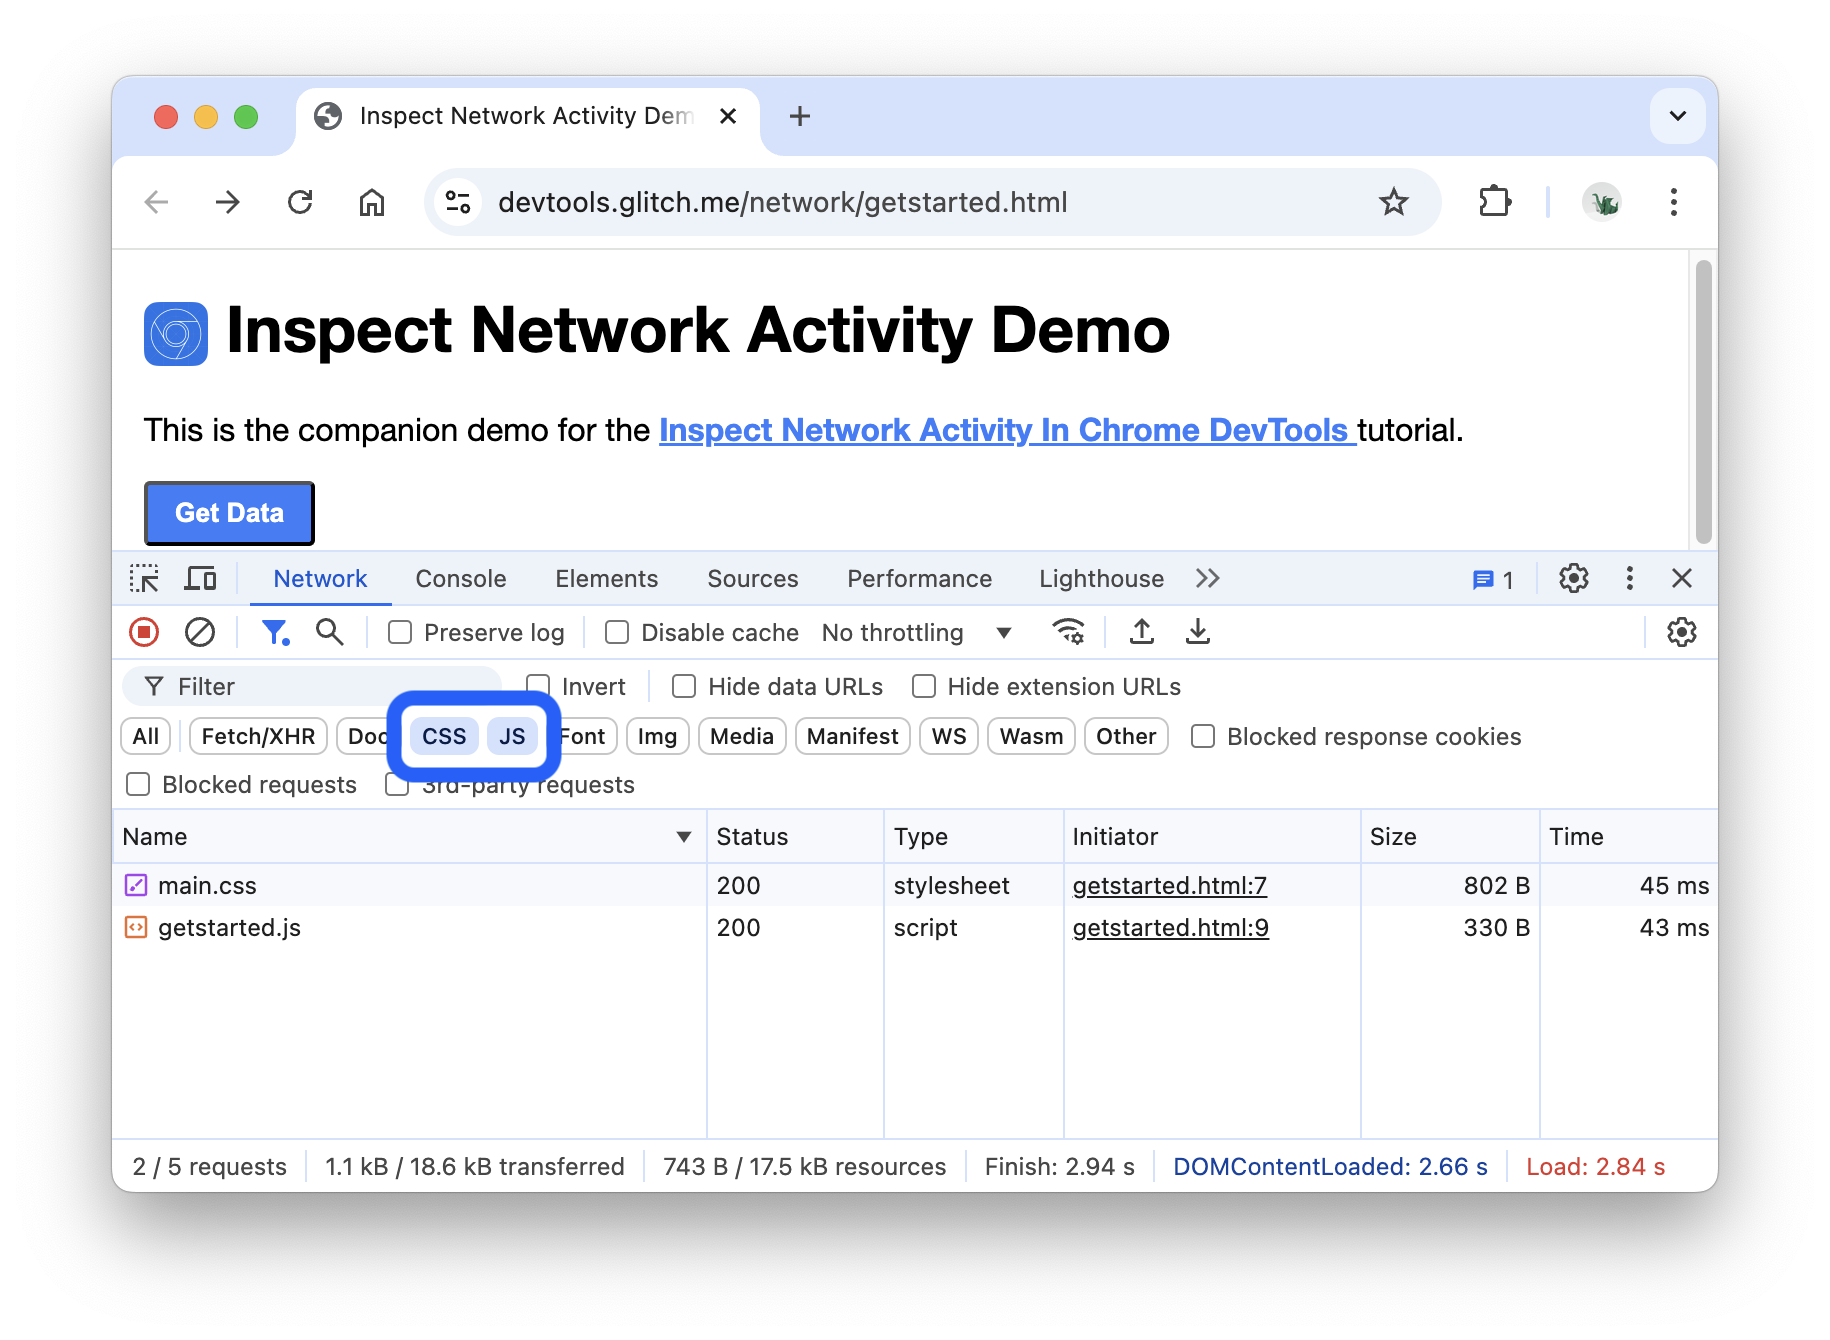
Click All to remove the filters and see all resources again.
See Filter requests for other filtering workflows.
Block requests
How does a page look and behave when some of its resources aren't available? Does it fail completely, or is it still somewhat functional? Block requests to find out:
Press Control+Shift+P or Command+Shift+P (Mac) to open the Command Menu.
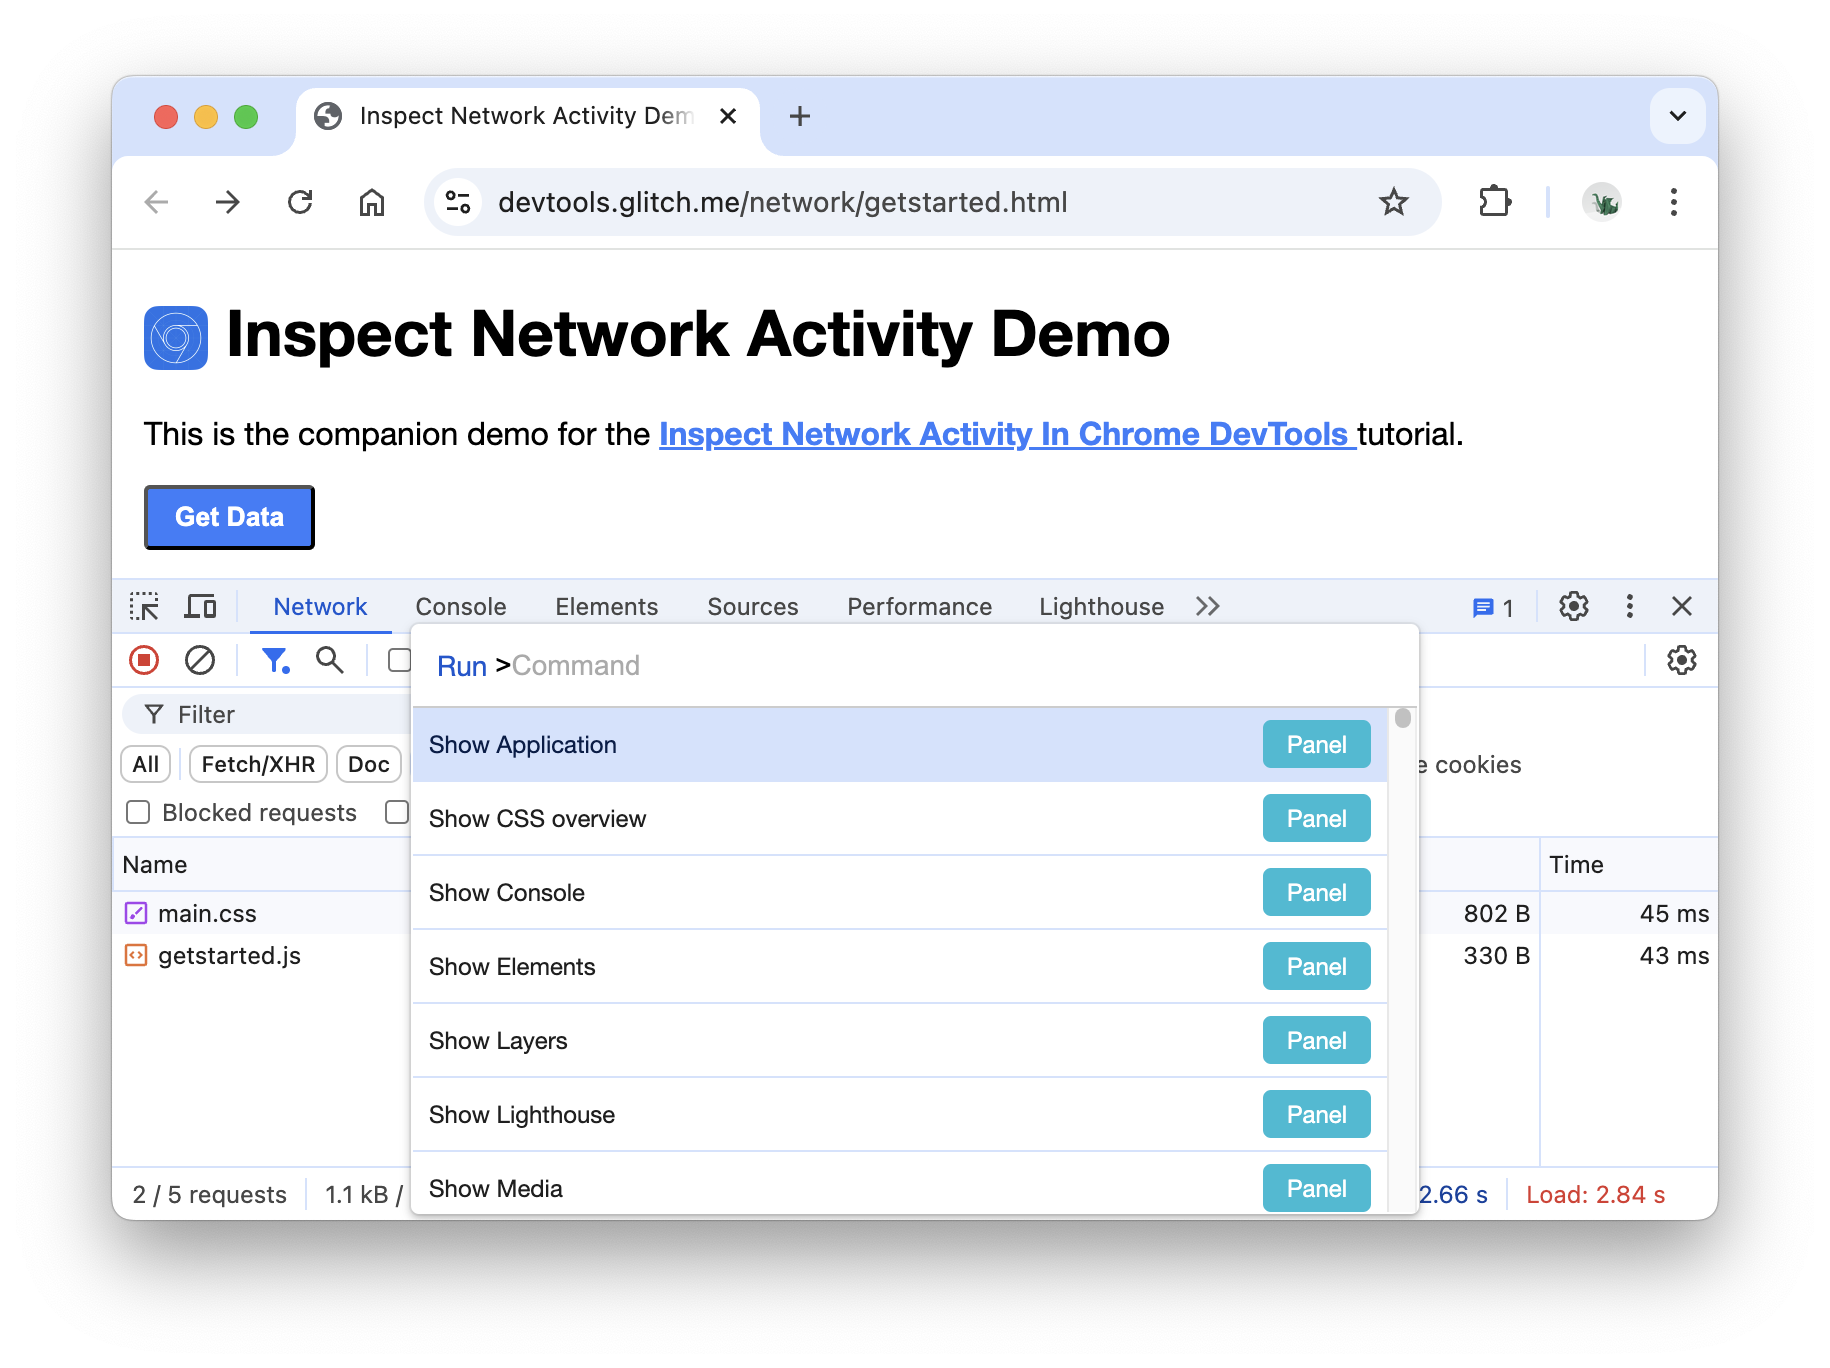
Type
block, select Show Request Blocking, and press Enter.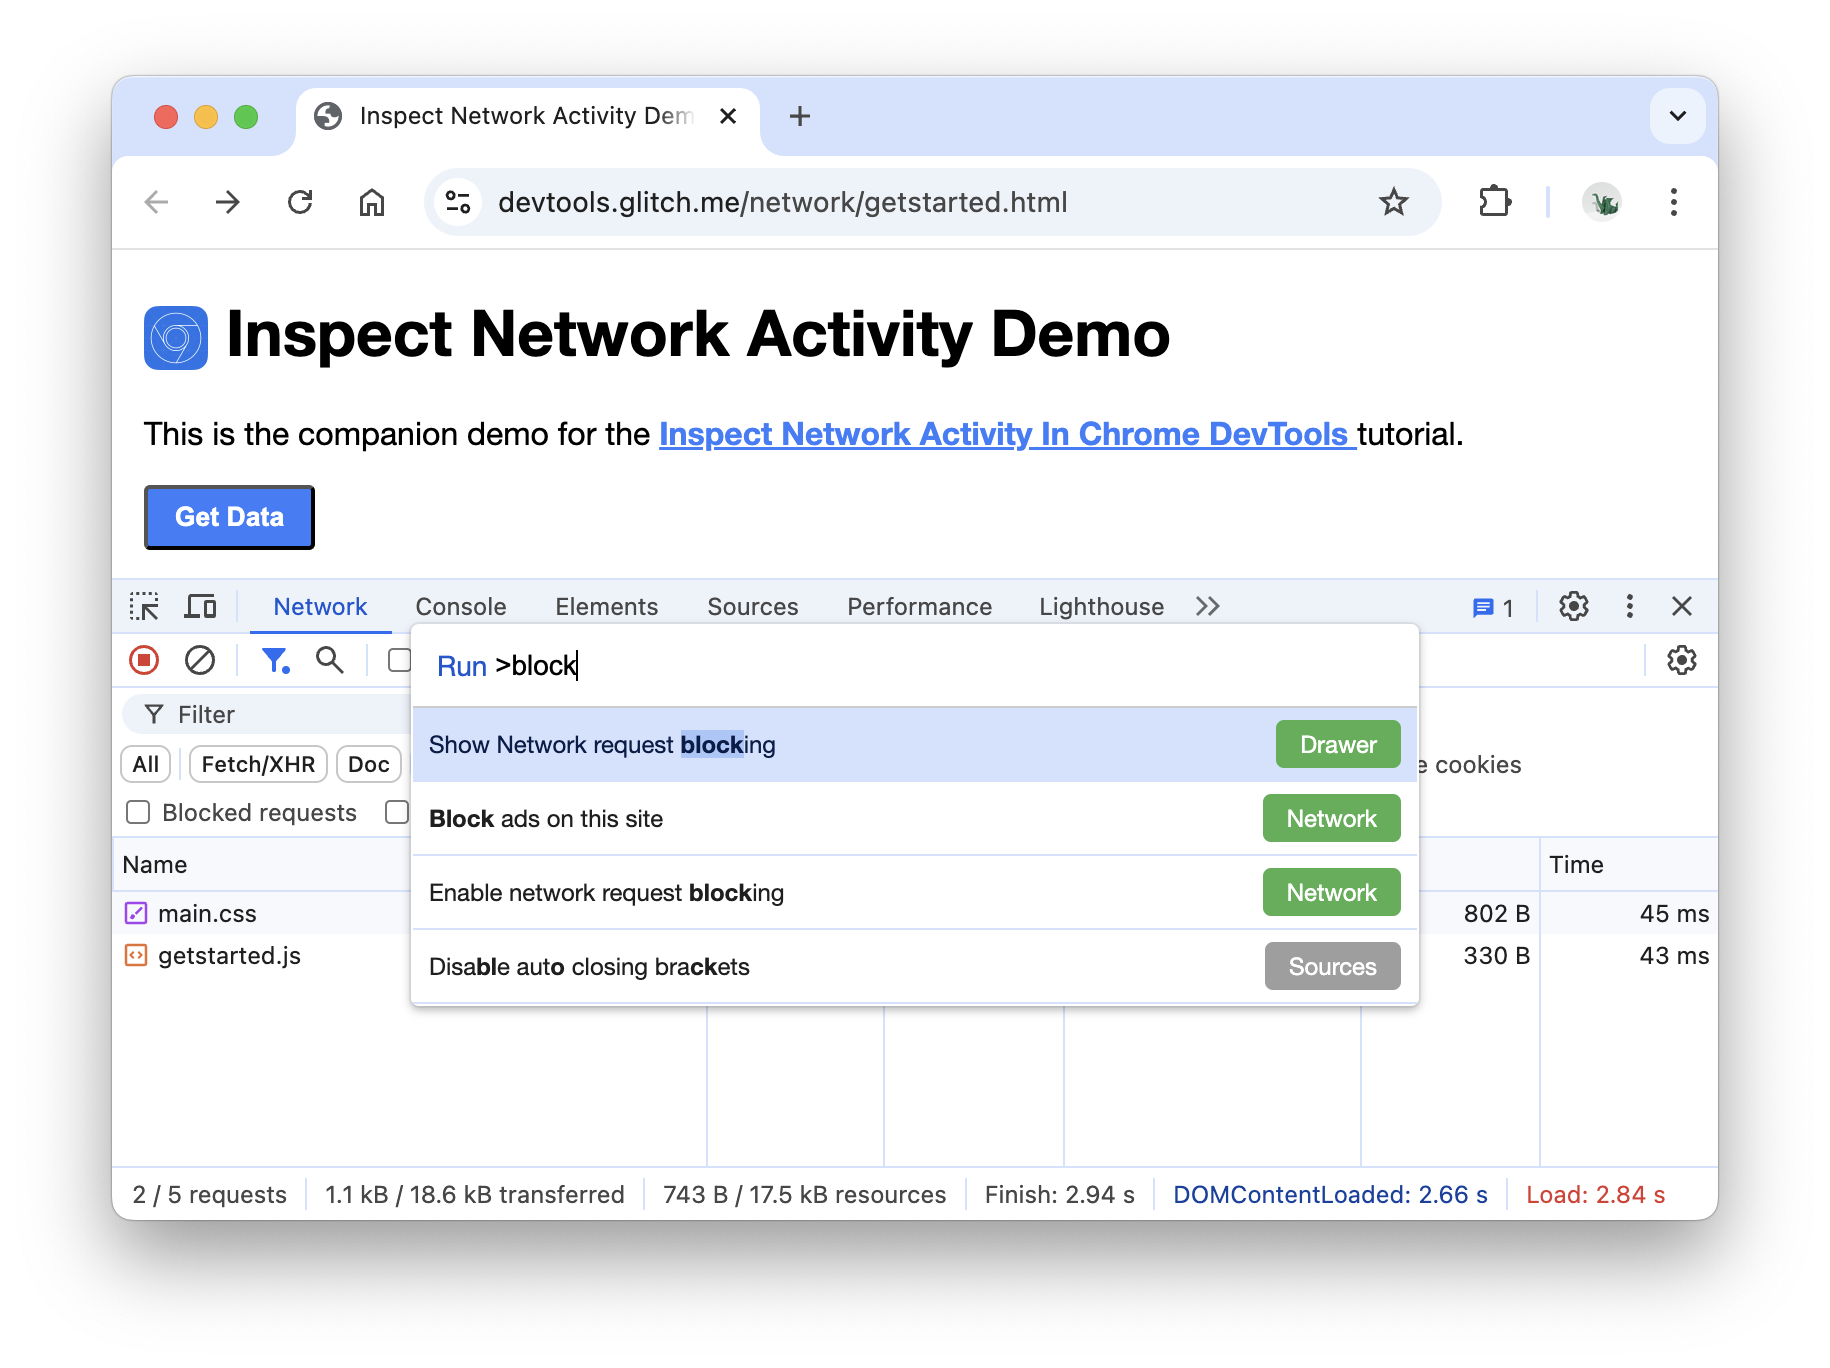
Click the Add Pattern button.
Type
main.css.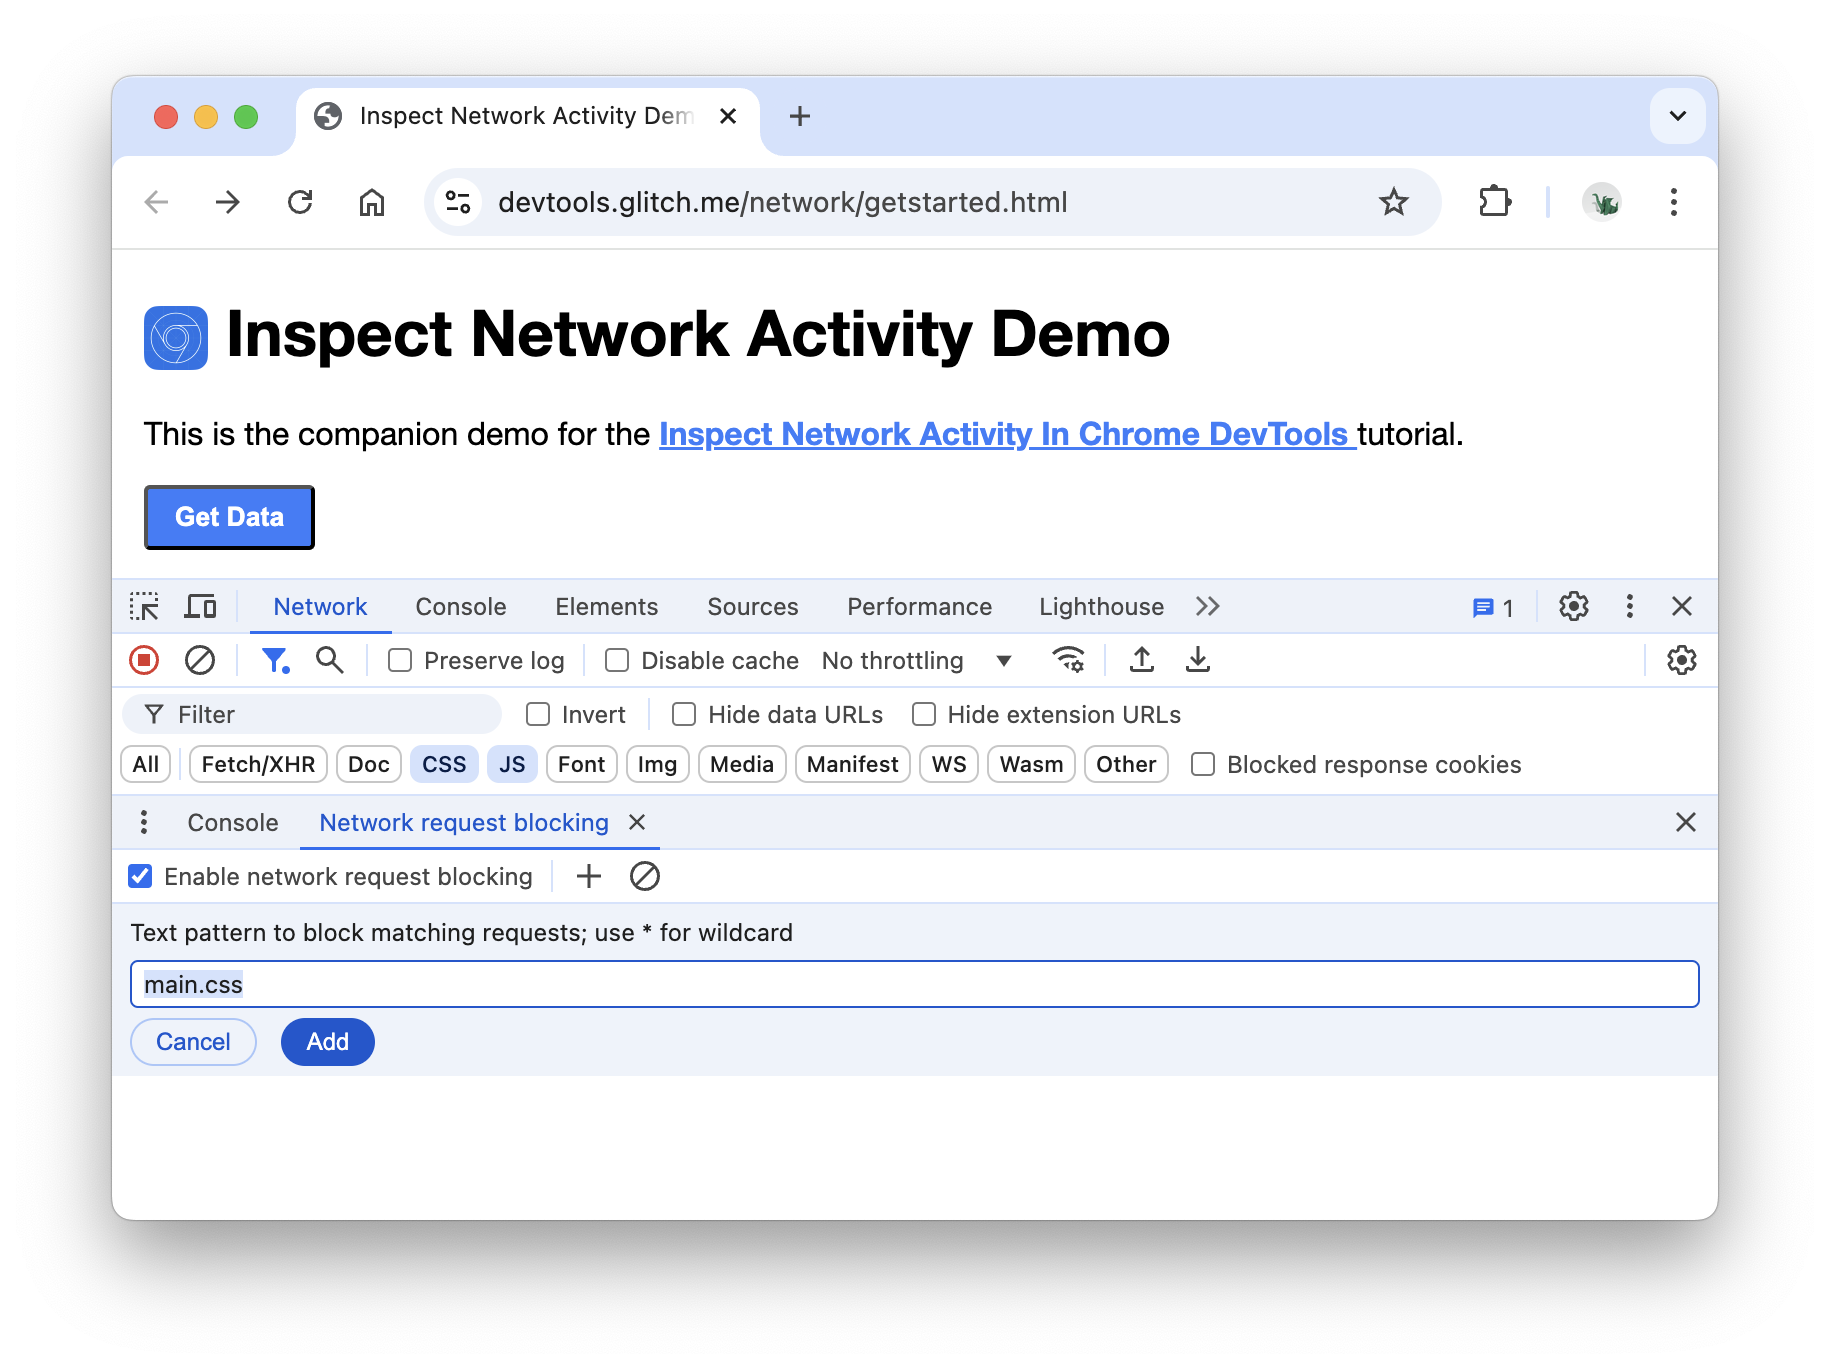
Click Add.
Reload the page. As expected, the page's styling is slightly messed up because its main style sheet has been blocked. Note the
main.cssrow in the Network Log. The red text means that the resource is blocked.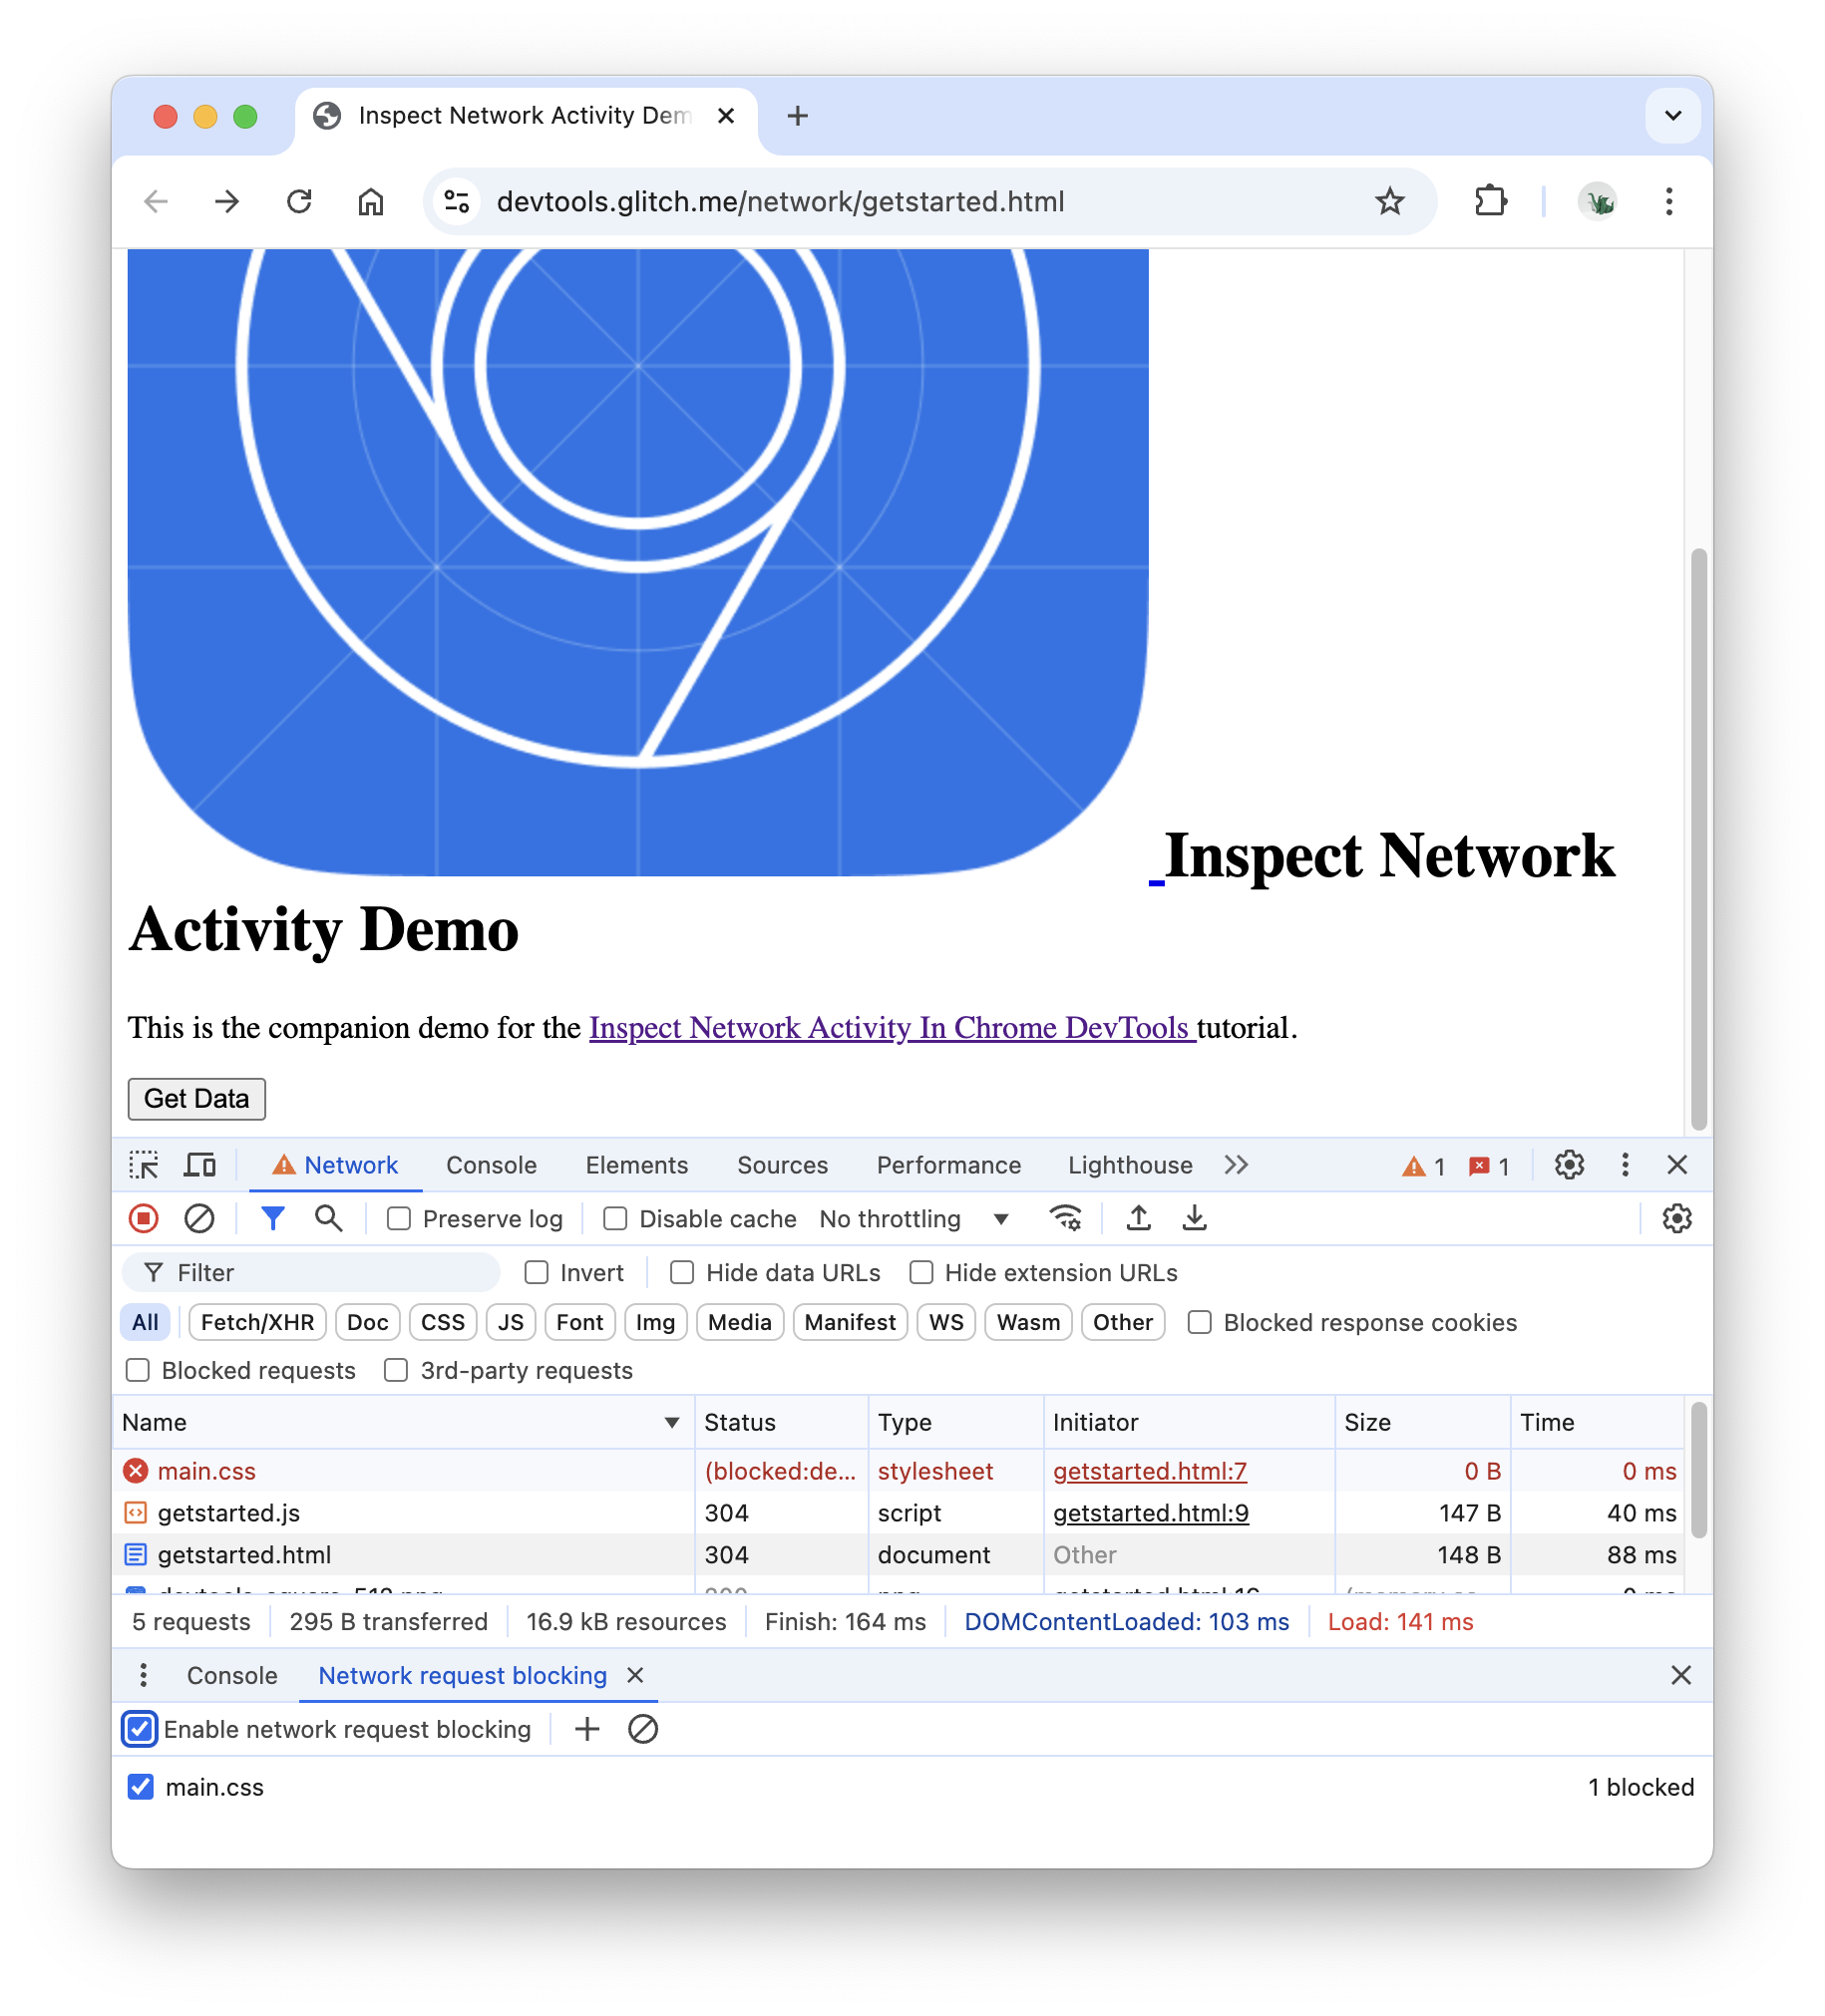
Clear the Enable request blocking checkbox.
To discover more DevTools features related to inspecting network activity, check out the Network Reference.