Overview
Want deeper insights into your application's performance beyond the browser's built-in metrics? The Performance panel now empowers you to bring your own performance data directly into the timeline. Whether you're a framework author needing to visualize internal processes, a library developer tracking the impact of your code, or building a complex application with custom instrumentation, the performance extensibility API provides the tools to gain a truly comprehensive understanding of what's happening under the hood.
By injecting your custom measurements and events, you can create tailored visualizations within the familiar Performance panel. Imagine seeing your framework's component lifecycle events alongside standard browser performance metrics, or tracking the execution flow of your custom rendering engine in perfect synchronization with the browser's rendering pipeline.
This API offers two approaches to achieve this:
1. The console.timeStamp API (extended for DevTools)
This API provides a high-performance method for instrumenting applications and surfacing timing data exclusively to the Performance panel in DevTools. It's designed for minimal runtime overhead, making it suitable for instrumenting hot paths and production builds. It does not add entries to the browser's internal performance timeline.
2. The User Timings API (using performance.mark and performance.measure)
This API leverages the existing User Timings API. It also adds entries to the browser's internal performance timeline, allowing for further analysis and integration with other performance tools.
Key benefits
Both APIs offer:
- Custom Tracks: Add dedicated tracks and track groups to represent the unique performance aspects of your code.
- Entries: Populate these tracks with entries that clearly mark important events or the duration of specific operation.
- Color Customization: Use color-coding to visually distinguish different types of events or measurements at a glance..
Choosing the right API for your needs:
console.timeStampAPI:- Performance impact of instrumentation is a primary concern, especially in production builds.
- You need a quick and efficient way to mark durations or events without the need for extra metadata.
- You only need the data to be visualized within the Performance panel.
User Timings API (
performance.mark,performance.measure):- Use when you need to store extra data with each entry, and when you are already using the User Timings API.
- You need to associate rich data (tooltips, detailed properties) with your performance entries.
- You want to add visual markers to highlight specific moments.
- You require the data to be available not only in DevTools but also in the browser's internal performance timeline for broader analysis or other tools.
- You are already familiar with or using the User Timings API.
Inject your data with console.timeStamp
The console.timeStamp API is extended to allow for the creation of custom timing entries in the Performance panel with minimal overhead, especially when DevTools is not recording a trace.
console.timeStamp(label: string, start?: string|number, end?: string|number, trackName?: string, trackGroup?: string, color?: DevToolsColor);
label:The label for the timing entry.
start(optional):If defined as string: the name of a previously recorded timestamp (using
console.timeStamp(timeStampName)).If defined as number: a timestamp in milliseconds relative to Performance.timeOrigin (for example, taken with
performance.now()) that represents the start time of the timing entry.If undefined, the current time is used as start time.
end:If defined as string: The name of a previously recorded timestamp.
If defined as number: a timestamp in milliseconds relative to Performance.timeOrigin (for example, taken with
performance.now()) that represents the end time of the timing entry.If undefined, the current time is used as end time.
trackName:The name of the custom track.
trackGroup:The name of the track group.
color:The color of the entry.
Inject your data with the User Timings API
To inject custom data, include a devtools object within the detail property of performance.mark and performance.measure methods. The structure of this devtools object determines how your data is displayed in the Performance panel.
Use
performance.markto record an instant event or timestamp in the timeline. You can mark the start or end of a specific operation or any point of interest that doesn't have a duration. When you include adevtoolsobject within thedetailproperty, the Performance panel shows a custom marker in the Timings track.Use
performance.measureto measure the duration of a task or process. When you include adevtoolsobject within thedetailproperty, the Performance panel shows custom measurement entries in the timeline in a custom track. If you're usingperformance.markas a reference point to create aperformance.measure, you don't need to include thedevtoolsobject inperformance.markcalls.
devtools object
These types define the structure of the devtools object for different extension features:
type DevToolsColor =
  "primary" | "primary-light" | "primary-dark" |
  "secondary" | "secondary-light" | "secondary-dark" |
  "tertiary" | "tertiary-light" | "tertiary-dark" |
  "error";

interface ExtensionTrackEntryPayload {
  dataType?: "track-entry"; // Defaults to "track-entry"
  color?: DevToolsColor;    // Defaults to "primary"
  track: string;            // Required: Name of the custom track
  trackGroup?: string;      // Optional: Group for organizing tracks
  properties?: [string, string][]; // Key-value pairs for detailed view
  tooltipText?: string;     // Short description for tooltip
}

interface ExtensionMarkerPayload {
  dataType: "marker";       // Required: Identifies as a marker
  color?: DevToolsColor;    // Defaults to "primary"
  properties?: [string, string][]; // Key-value pairs for detailed view
  tooltipText?: string;     // Short description for tooltip
}
View your data in the timeline
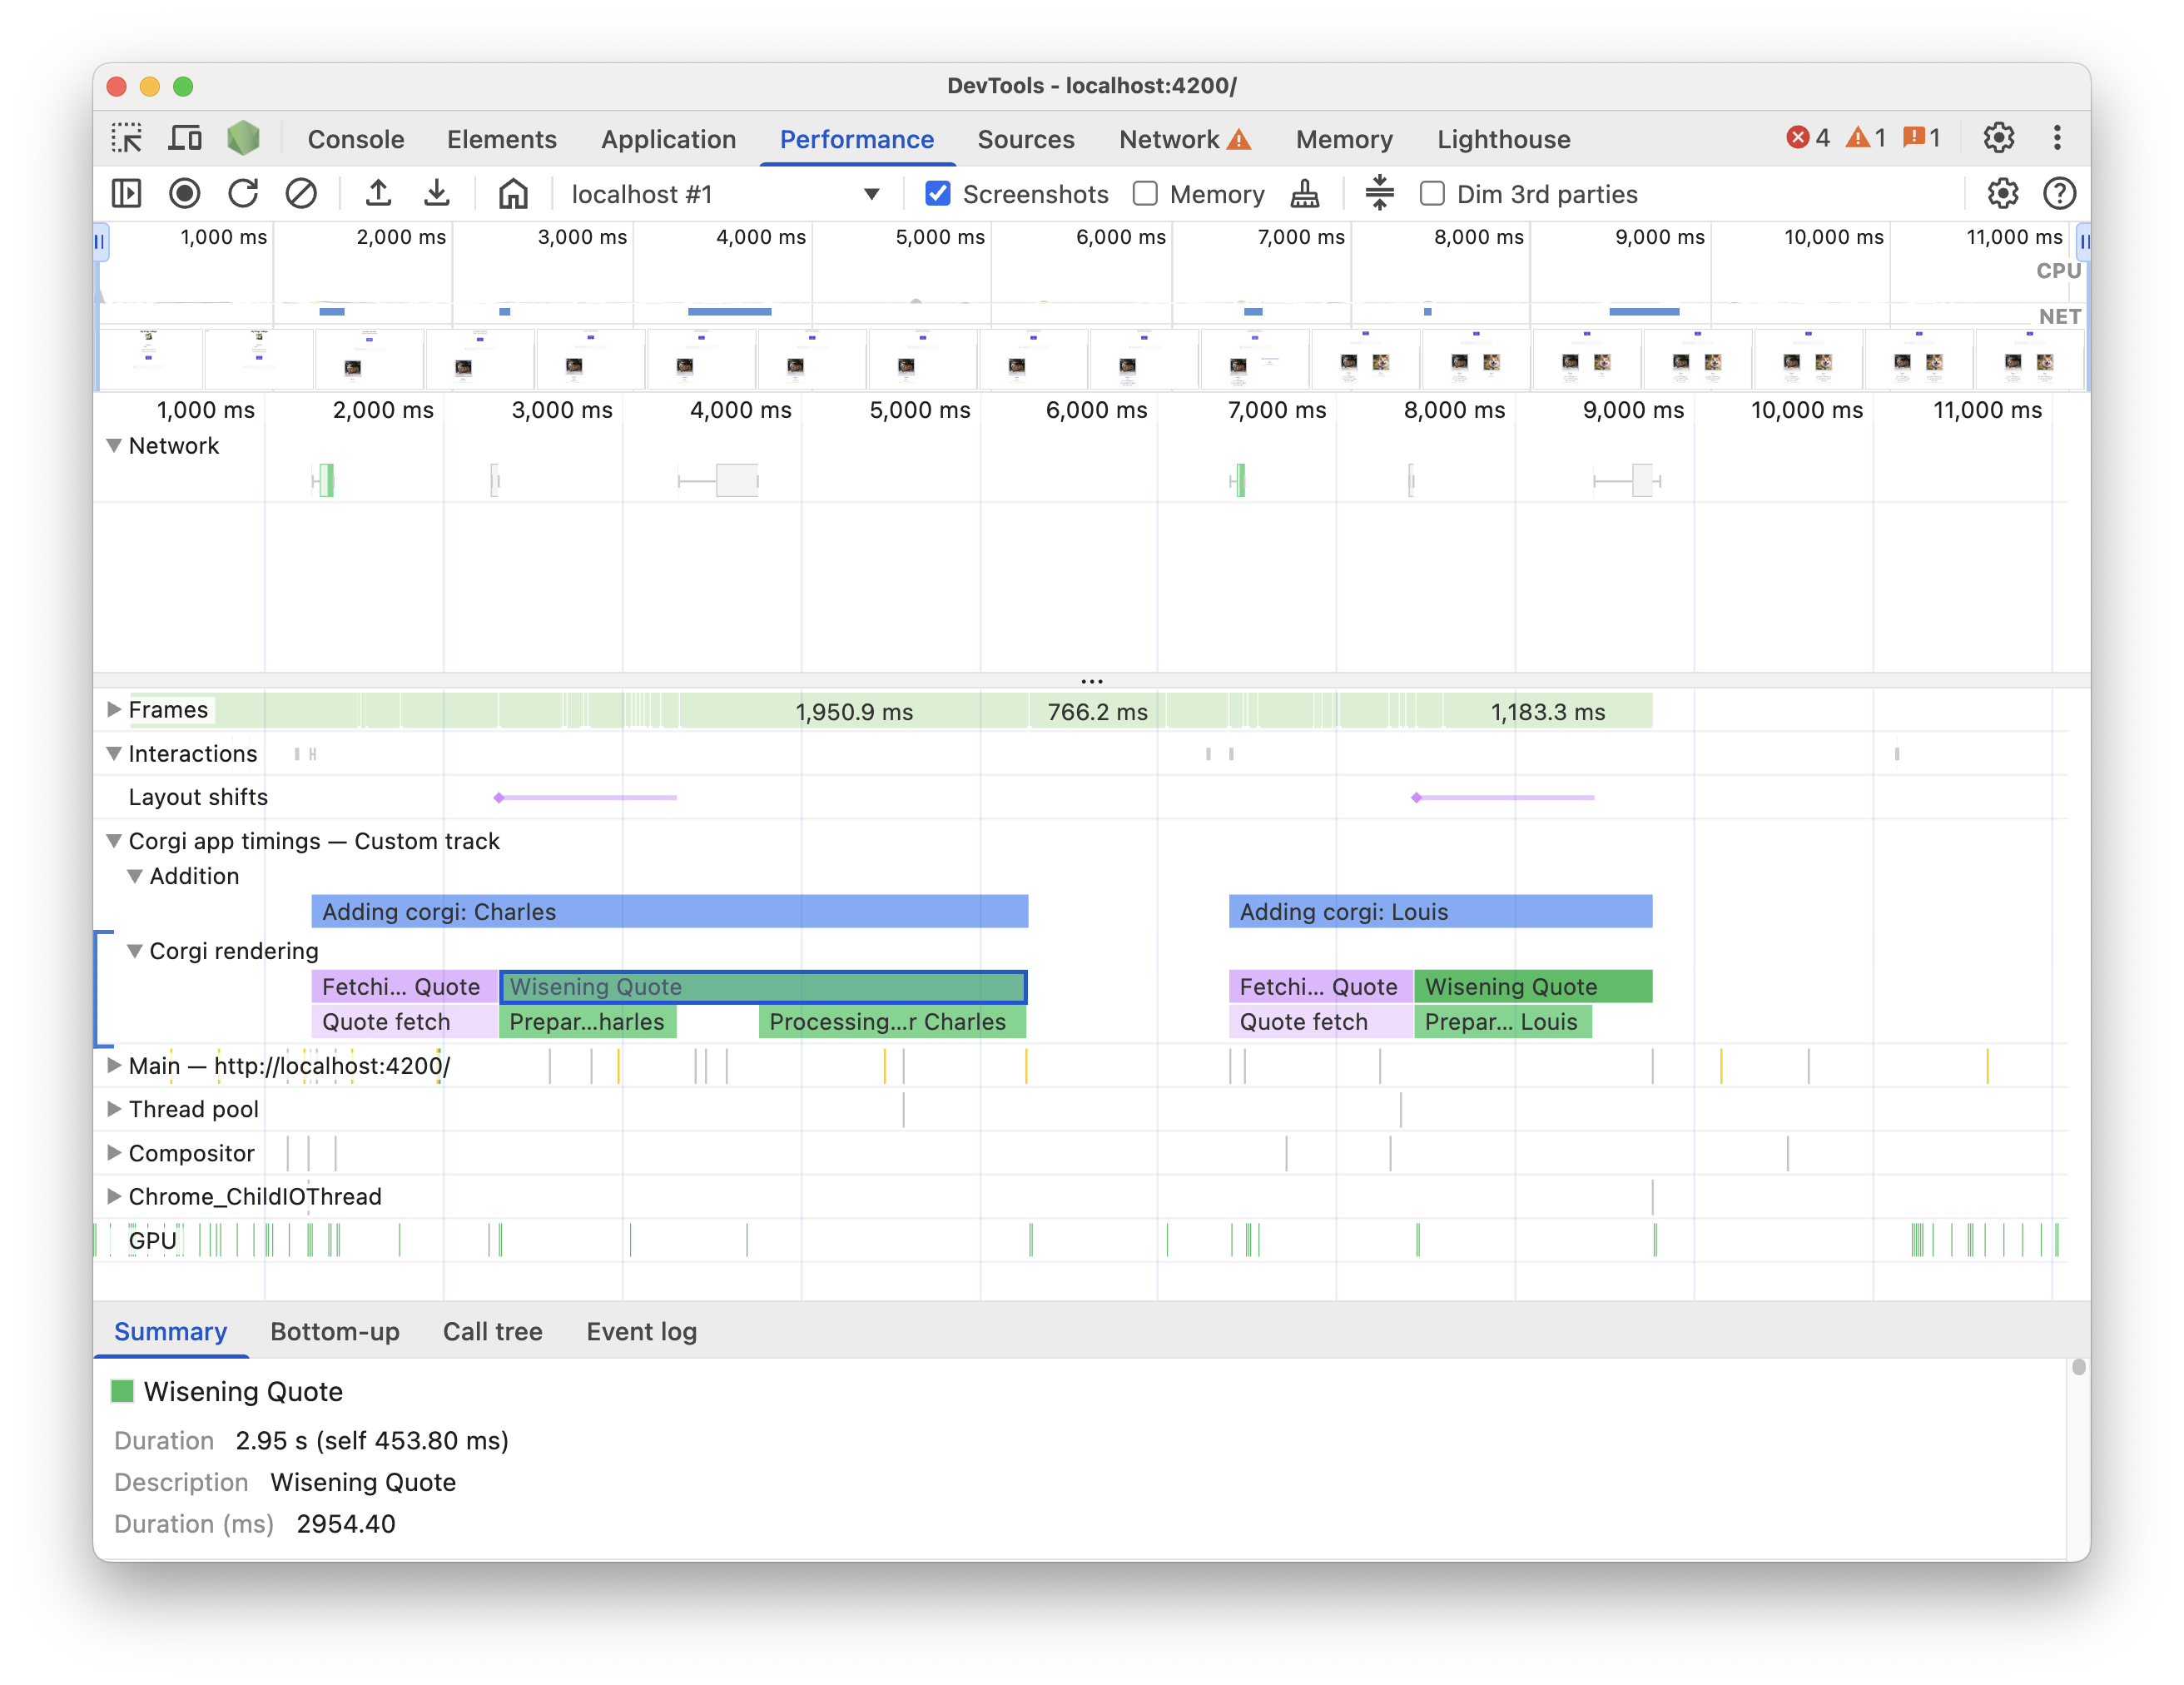
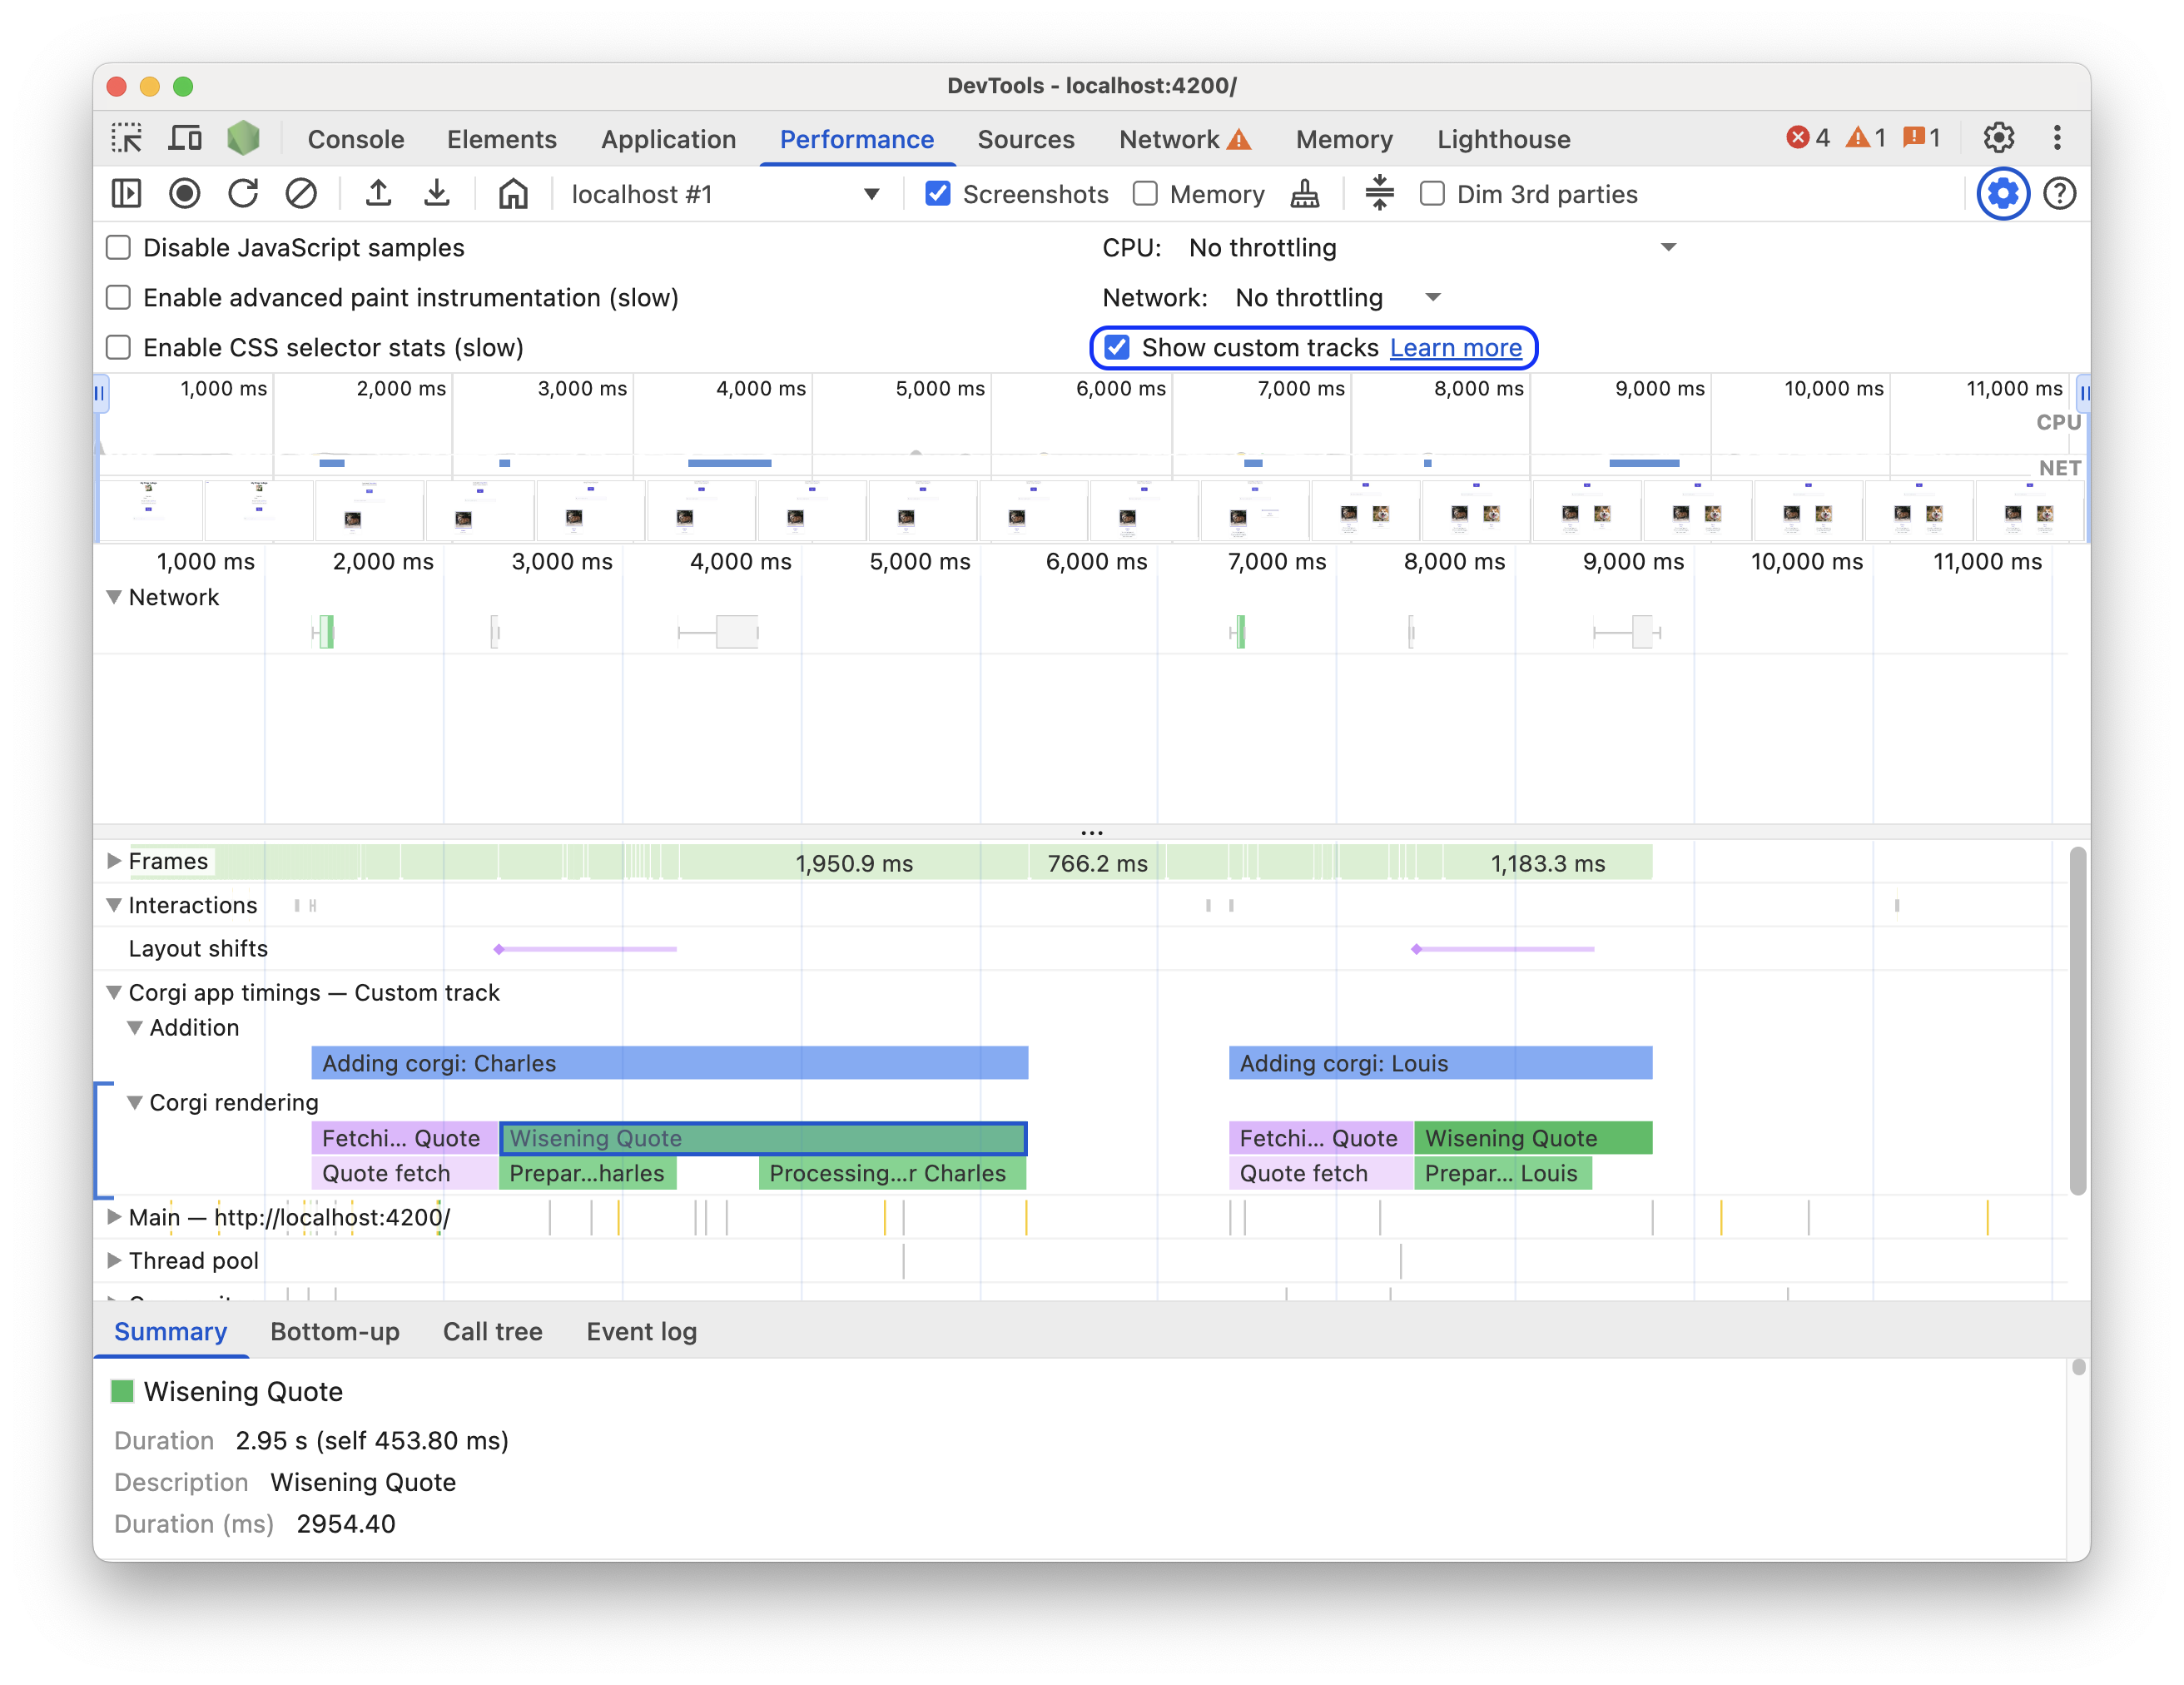
To see your custom data in the timeline, in the Performance panel, make sure the setting is on: Capture settings > Show custom tracks.
Try it on this demo page. Start a performance recording, click Add new Corgi on the demo page, then stop the recording. You'll see a custom track in the trace that contains events with custom tooltips and details in the Summary tab.
Code examples
Here are a few examples of how to use the API to add your own data to the Performance panel using each available mechanism.
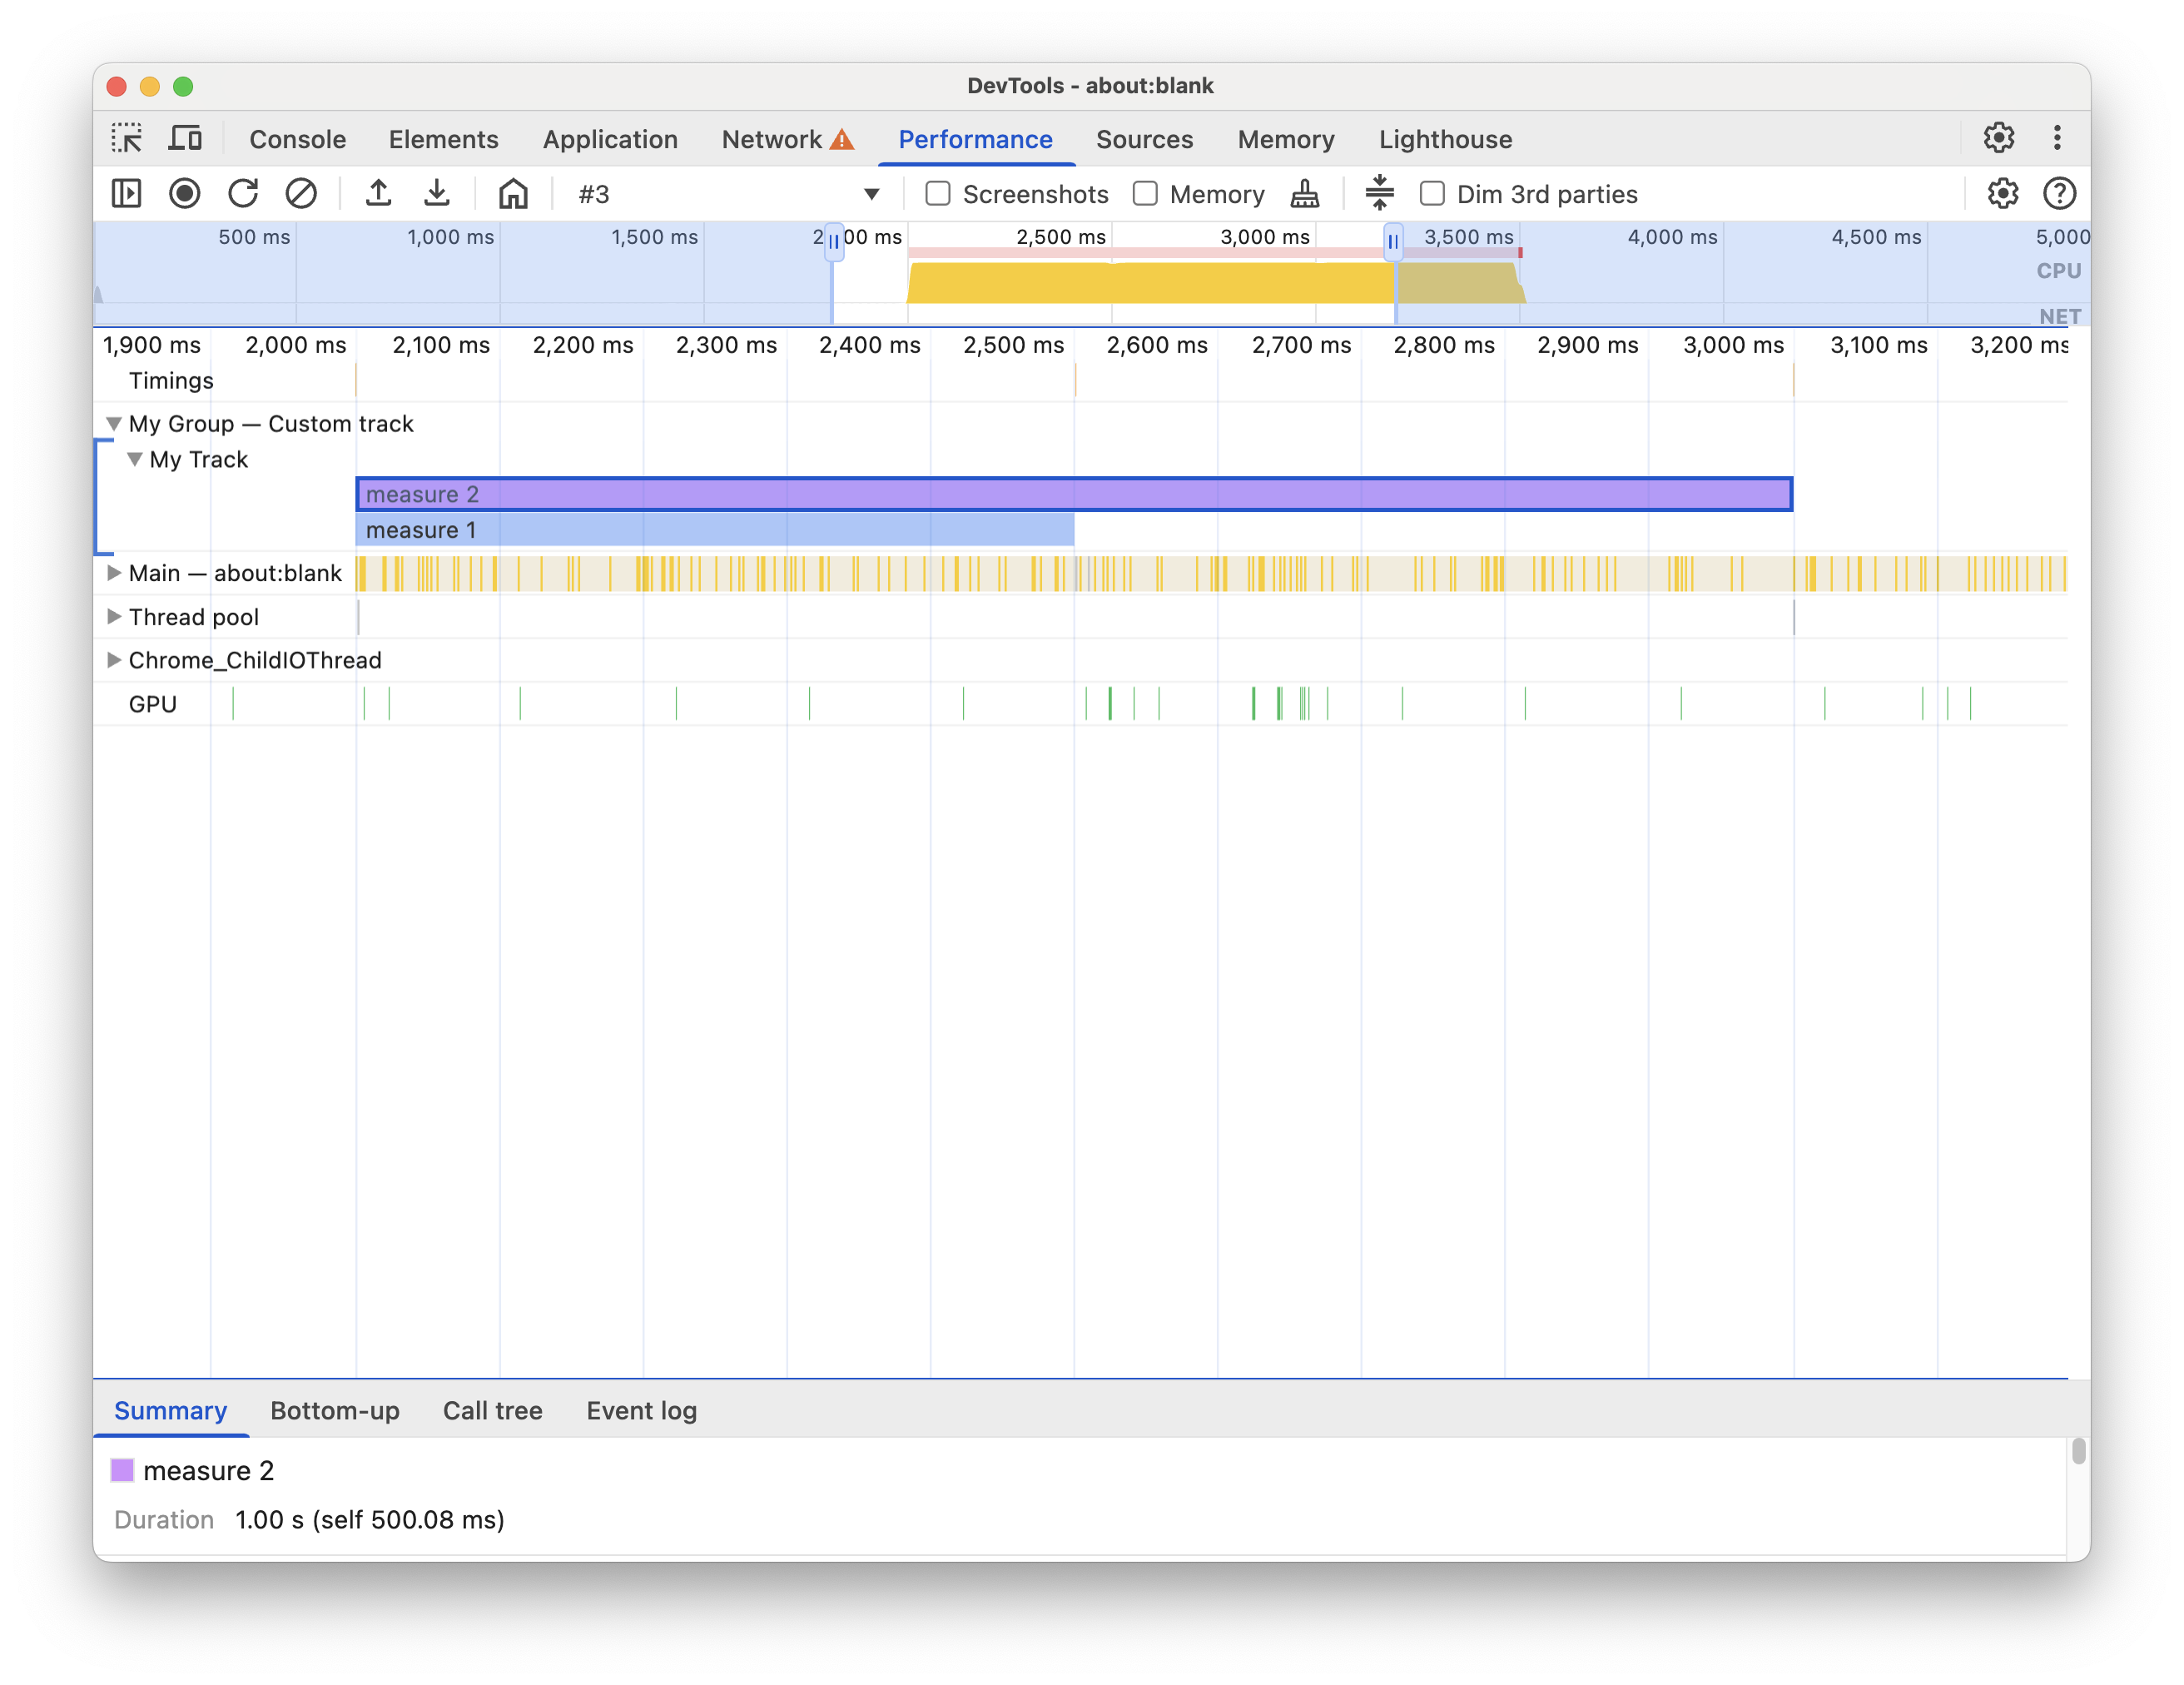
console.timeStamp API Examples:
// Take a start timestamp
const start = performance.now();

// Measure duration from start to now
console.timeStamp("measure 1", start, undefined, "My Track", "My Group", "primary-light");

// Take an end timestamp
const end = performance.now();

// Measure duration from start to end
console.timeStamp("measure 2", start, end, "My Track", "My Group", "secondary-dark");
This results in the following custom track entry in the performance timeline:
User Timings API Examples:
In the next sections, see the examples of code that showcase how to add the following to the performance timeline:
Custom tracks and entries
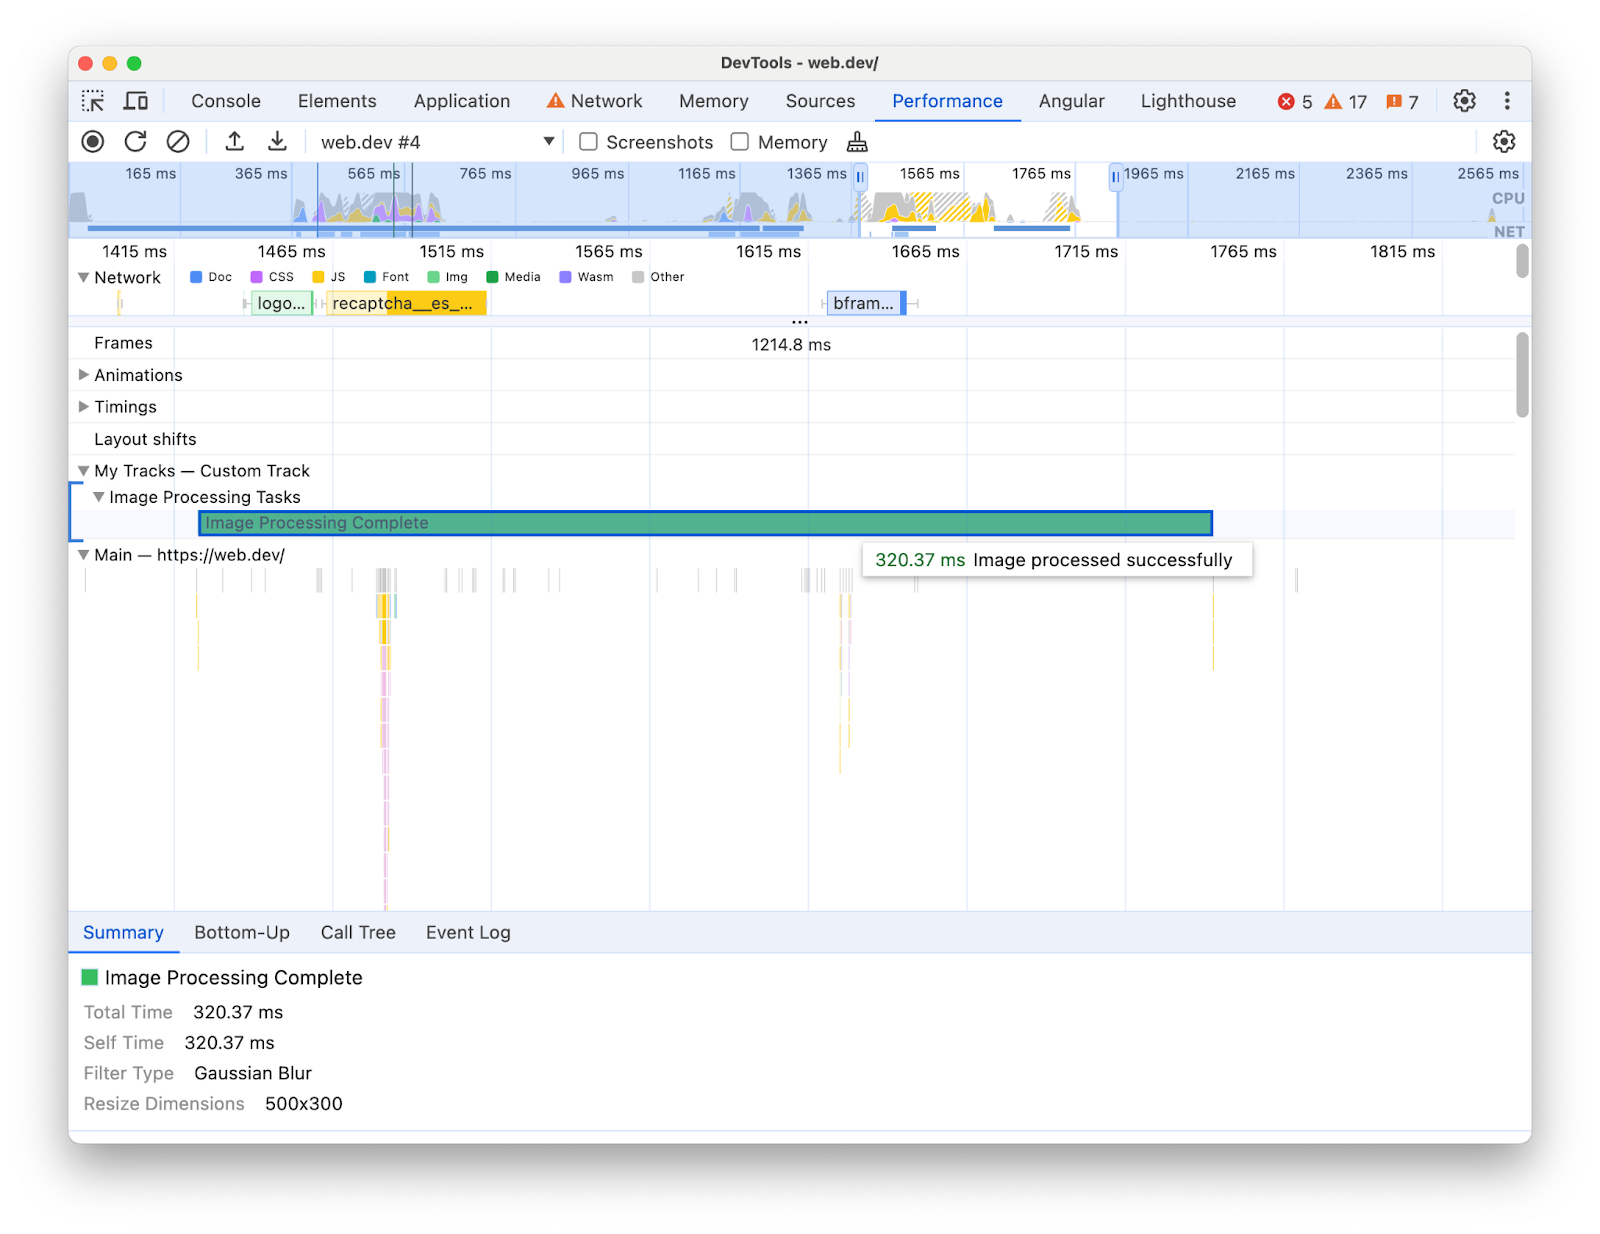
Create custom tracks and populate them with entries to visualize your performance data in a custom track. For example:
// Mark used to represent the start of the image processing task
// The start time is defaulted to now
const imageProcessinTimeStart = performance.now();

// ... later in your code

// Track entry representing the completion of image processing
// with additional details and a tooltip
// The start time is a marker from earlier
// The end time is defaulted to now
performance.measure("Image Processing Complete", {
  start: imageProcessinTimeStart,
  detail: {
    devtools: {
      dataType: "track-entry",
      track: "Image Processing Tasks",
      trackGroup: "My Tracks", // Group related tracks together
      color: "tertiary-dark",
      properties: [
        ["Filter Type", "Gaussian Blur"],
        ["Resize Dimensions", "500x300"]
      ],
      tooltipText: "Image processed successfully"
    }
  }
});
This results in the following custom track entry in the performance timeline, along with its tooltip text and properties:
Markers
Visually highlight specific points of interest in the timeline with custom markers that span across all tracks. For example:
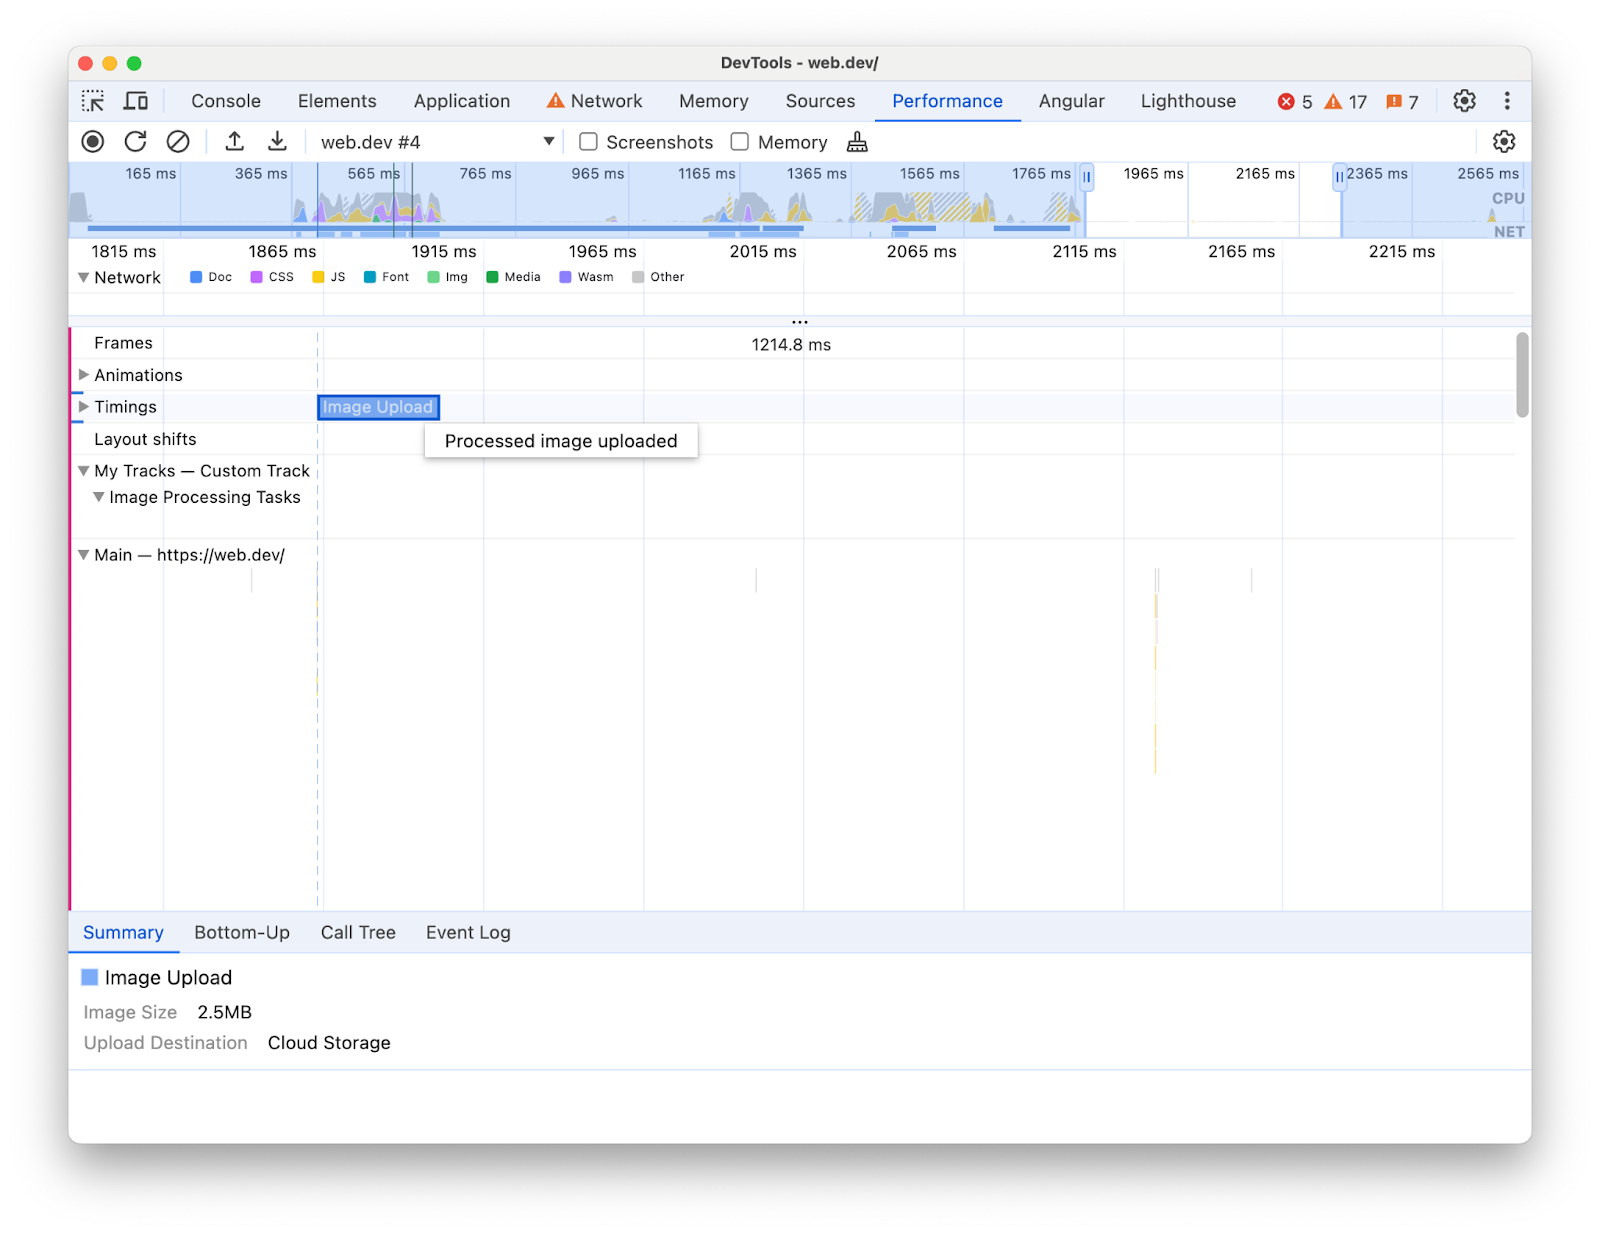
// Marker indicating when the processed image was uploaded
performance.mark("Image Upload", {
  detail: {
    devtools: {
      dataType: "marker",
      color: "secondary",
      properties: [
        ["Image Size", "2.5MB"],
        ["Upload Destination", "Cloud Storage"]
      ],
      tooltipText: "Processed image uploaded"
    }
  }
});
This results in the following marker in the Timings track, along with its tooltip text and properties: